
Method and system for monitoring sensor data of rotating equipment

a technology of rotating equipment and sensor data, applied in the field of monitoring, can solve the problems of inability for a human to investigate the full data manually, inability to apply correlation measures, and small loss of accuracy

Active Publication Date: 2017-12-21
SIEMENS AG
View PDF13 Cites 12 Cited by
  • Summary
  • Abstract
  • Description
  • Claims
  • Application Information

AI Technical Summary

Benefits of technology

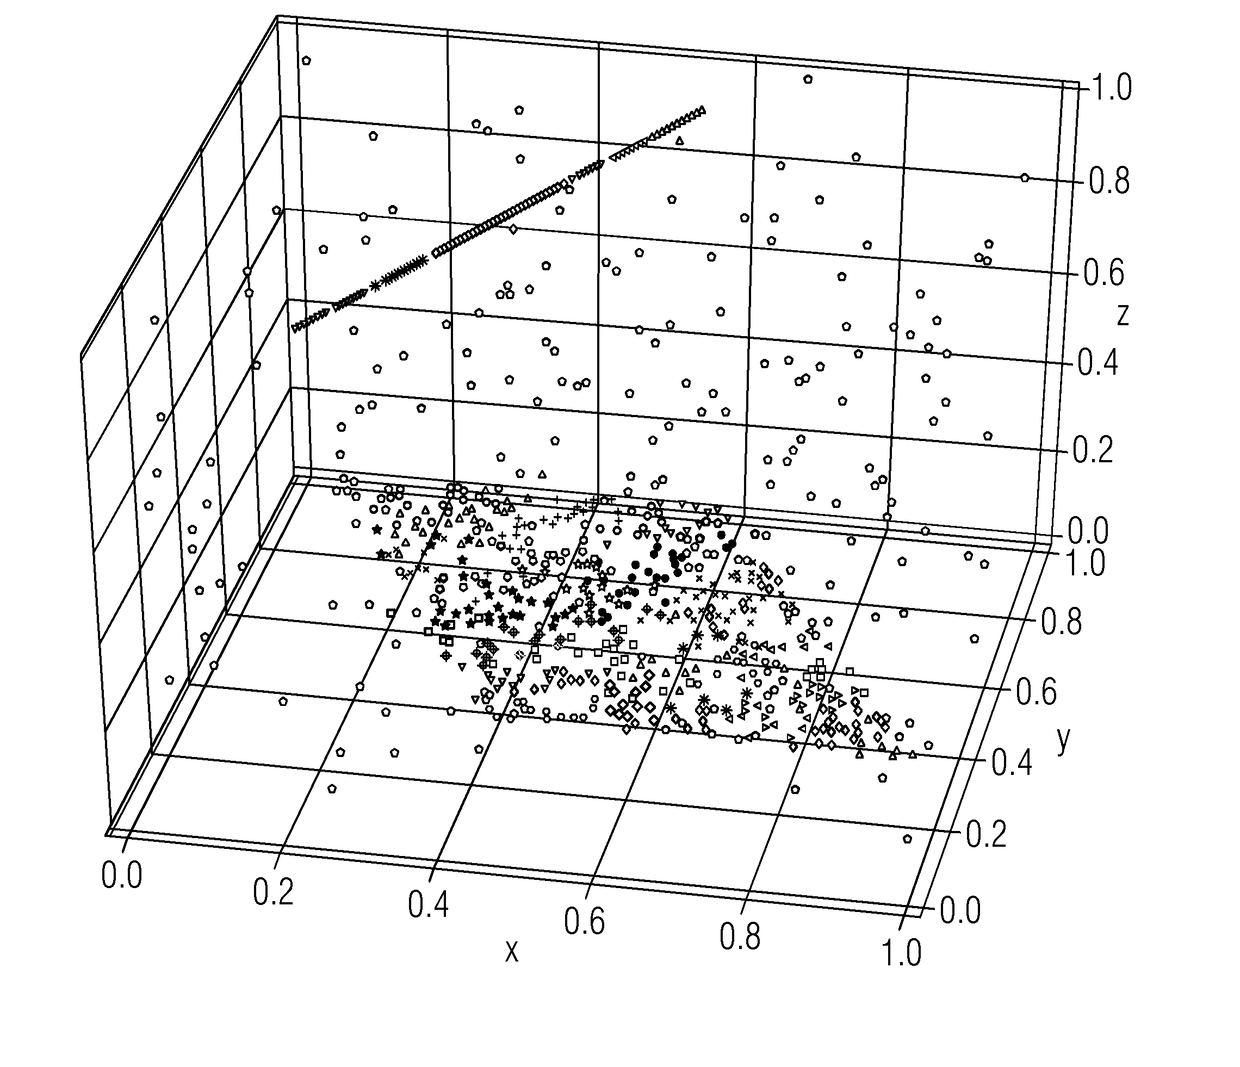
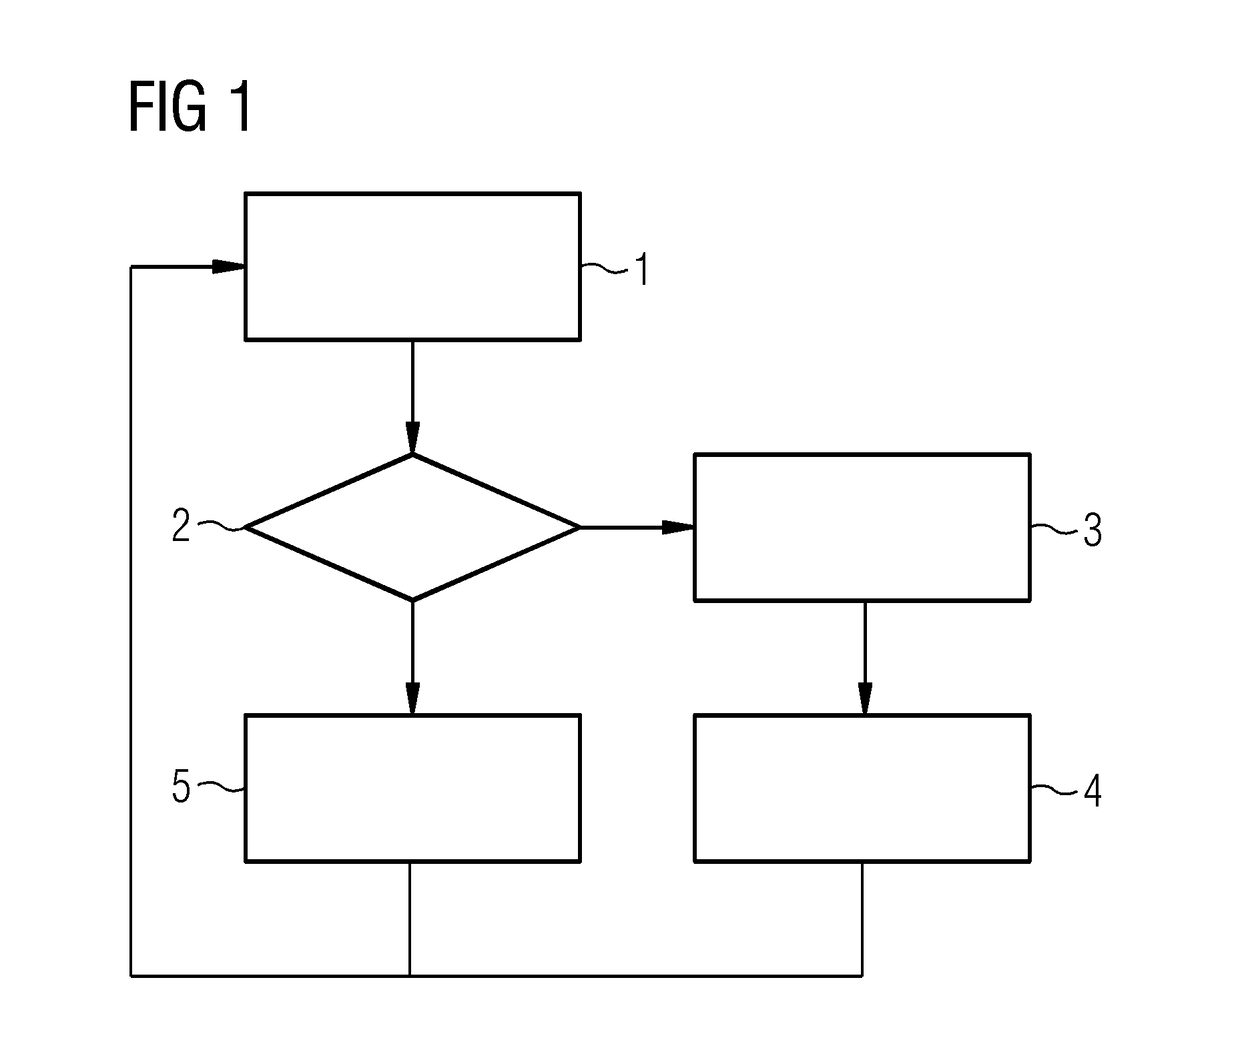
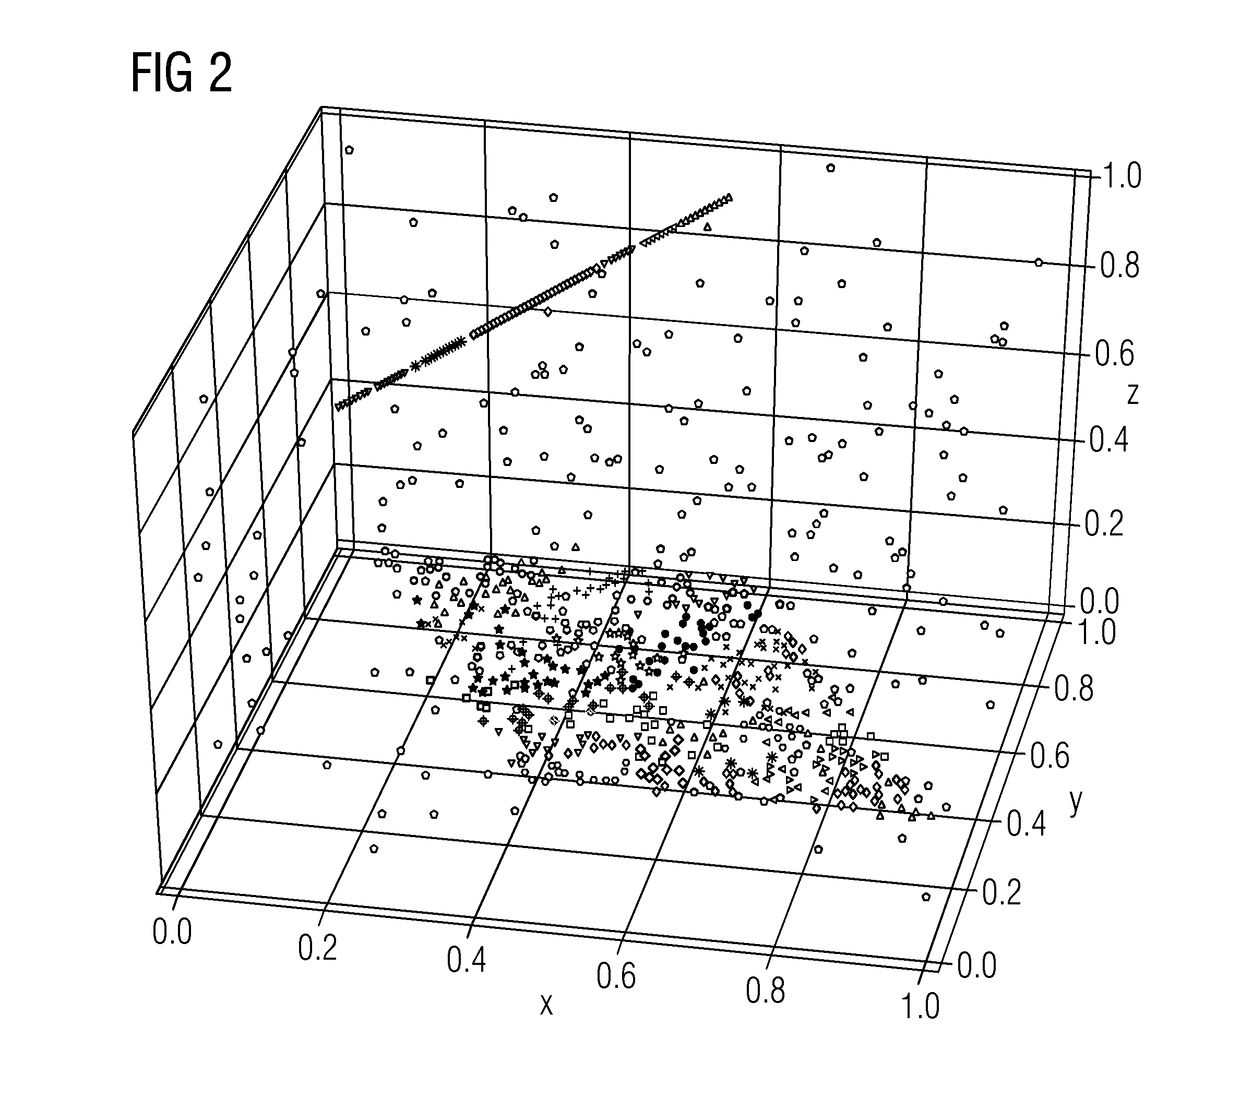
The patent describes a method for analyzing sensor data from rotating equipment such as turbines. The method uses microclusters to reduce computational complexity and automatically analyze the data. The microclusters compress the necessary statistical information and allow for a fast computation of the model without storing all the data. The method also allows for a fine grained comparison of feature subspaces which can provide deep insight into the state of a machine. The patent also describes an offline routine for building macroclusters on top of the generated microcluster structures. The technical effects of the method include reducing computational complexity, allowing for online monitoring of rotating equipment, and providing a deep understanding of machine state through fine grained comparison of feature subspaces.

Problems solved by technology

However, the sheer amount and velocity of sensor data (and derived events) arriving at the RDC make it impossible for a human to investigate the full data manually.
At the same time, the loss of accuracy is quite small.
Furthermore, clustering has the advantage of being an unsupervised learning method.
Newly arising microclusters or microclusters whose subspaces change their orientations significantly may indicate an abrupt failure.
In those cases, the correlation measure cannot be applied due to the lack of the microcluster's eigenspace.
Using the macrocluster model for offline comparison in certain time intervals or on demand, even insidious failures can be detected.

Method used


Image

  • Method and system for monitoring sensor data of rotating equipment
  • Method and system for monitoring sensor data of rotating equipment
  • Method and system for monitoring sensor data of rotating equipment

Examples


Embodiment Construction

[0047]The Principal Component Analysis (PCA) is a popular tool to compute the principal components of a data matrix by using an orthogonal transformation. As a form of true eigenvector-based multivariate analysis, it reveals an uncorrelated orthogonal basis vector set such that the underlying data has the maximum possible variance in the directions of the principal components. Each vector of the basis represents an eigenvector of the underlying covariance matrix. The first principal component is the eigenvector that has the largest possible variance, i.e. the largest eigenvalue, and further principal components maximize the variance with respect to the constraint that they build an orthogonal system.

[0048]In terms of correlation clustering, previously presented methods often use the PCA to detect correlation clusters. To formalize the idea of correlation clusters, we borrow the notions used in [1] and [2].

[0049]Let D be a dataset of n d-dimensional feature vectors, i.e. D⊂. Let C be...


PUM


Abstract

A sensor data stream is provided consisting of feature vectors acquired by sensors of rotating equipment, similar feature vectors are aggregated in microclusters. For newly arriving feature vectors, a correlation distance measure between the new feature vector and each microcluster is calculated. If there is no microcluster in range, then a new microcluster is created. Otherwise, the feature vector is assigned to the best fitting microcluster, and the necessary statistical information is incorporated into the aggregation contained in the microcluster. In other words, similar feature vectors are aggregated in the same microclusters. The microclusters thus provide a generic summary structure that captures the necessary statistical information of the incorporated feature vectors. At the same time, the loss of accuracy is quite small. Clustering the sensor data stream with microclusters has the benefit that the computational complexity can be reduced significantly.

Description

CROSS-REFERENCE TO RELATED APPLICATIONS[0001]This application claims priority to EP Application No. 16178412.9, having a filing date of Jul. 7, 2016, which is based upon and claims priority to EP Application No. 16174902.3, having a filing date of Jun. 17, 2016, the entire contents both of which are hereby incorporated by reference.FIELD OF TECHNOLOGY[0002]The following relates to monitoring, e.g. condition monitoring, of rotating equipment. Rotating equipment encompasses any rotatory driven equipment in technical plants or facilities, such as pumps, fans, compressors and turbines.BACKGROUND[0003]Modern turbines are equipped with a large number of sensors that monitor the current status. Often, this data is transmitted as a sensor data stream to a so-called “Remote Diagnostic Center” (RDC) where engineers use dashboards to monitor aggregated device status and diagnose detected errors.[0004]Experience shows that humans often use knowledge of similar cases from the past to diagnose an...

Claims


Application Information

Patent Timeline
Patent Type & Authority Applications(United States)
IPC IPC(8): G08B21/18G07C3/02G06N20/00
CPCG07C3/02G08B21/187G05B23/0221G05B2219/32201G06N20/00G05B23/024Y02P90/02G06F18/2135G06F18/24137G06N5/02G05B23/0254
Inventor BORUTTA, FELIXHUBAUER, THOMASKROGER, PEER
Owner SIEMENS AG
Learn More