Compositions, methods, and systems for tissue fixation
a tissue fixation and molecular technology, applied in the field of tissue fixation, can solve the problems of affecting the end, affecting the end, and standard techniques using aldehyde-based fixatives often fail to preserve tissue molecular details, and achieve abnormal upward accumulation of abnormal levels of phosphoproteins
- Summary
- Abstract
- Description
- Claims
- Application Information
AI Technical Summary
Benefits of technology
Problems solved by technology
Method used
Image
Examples
example 1
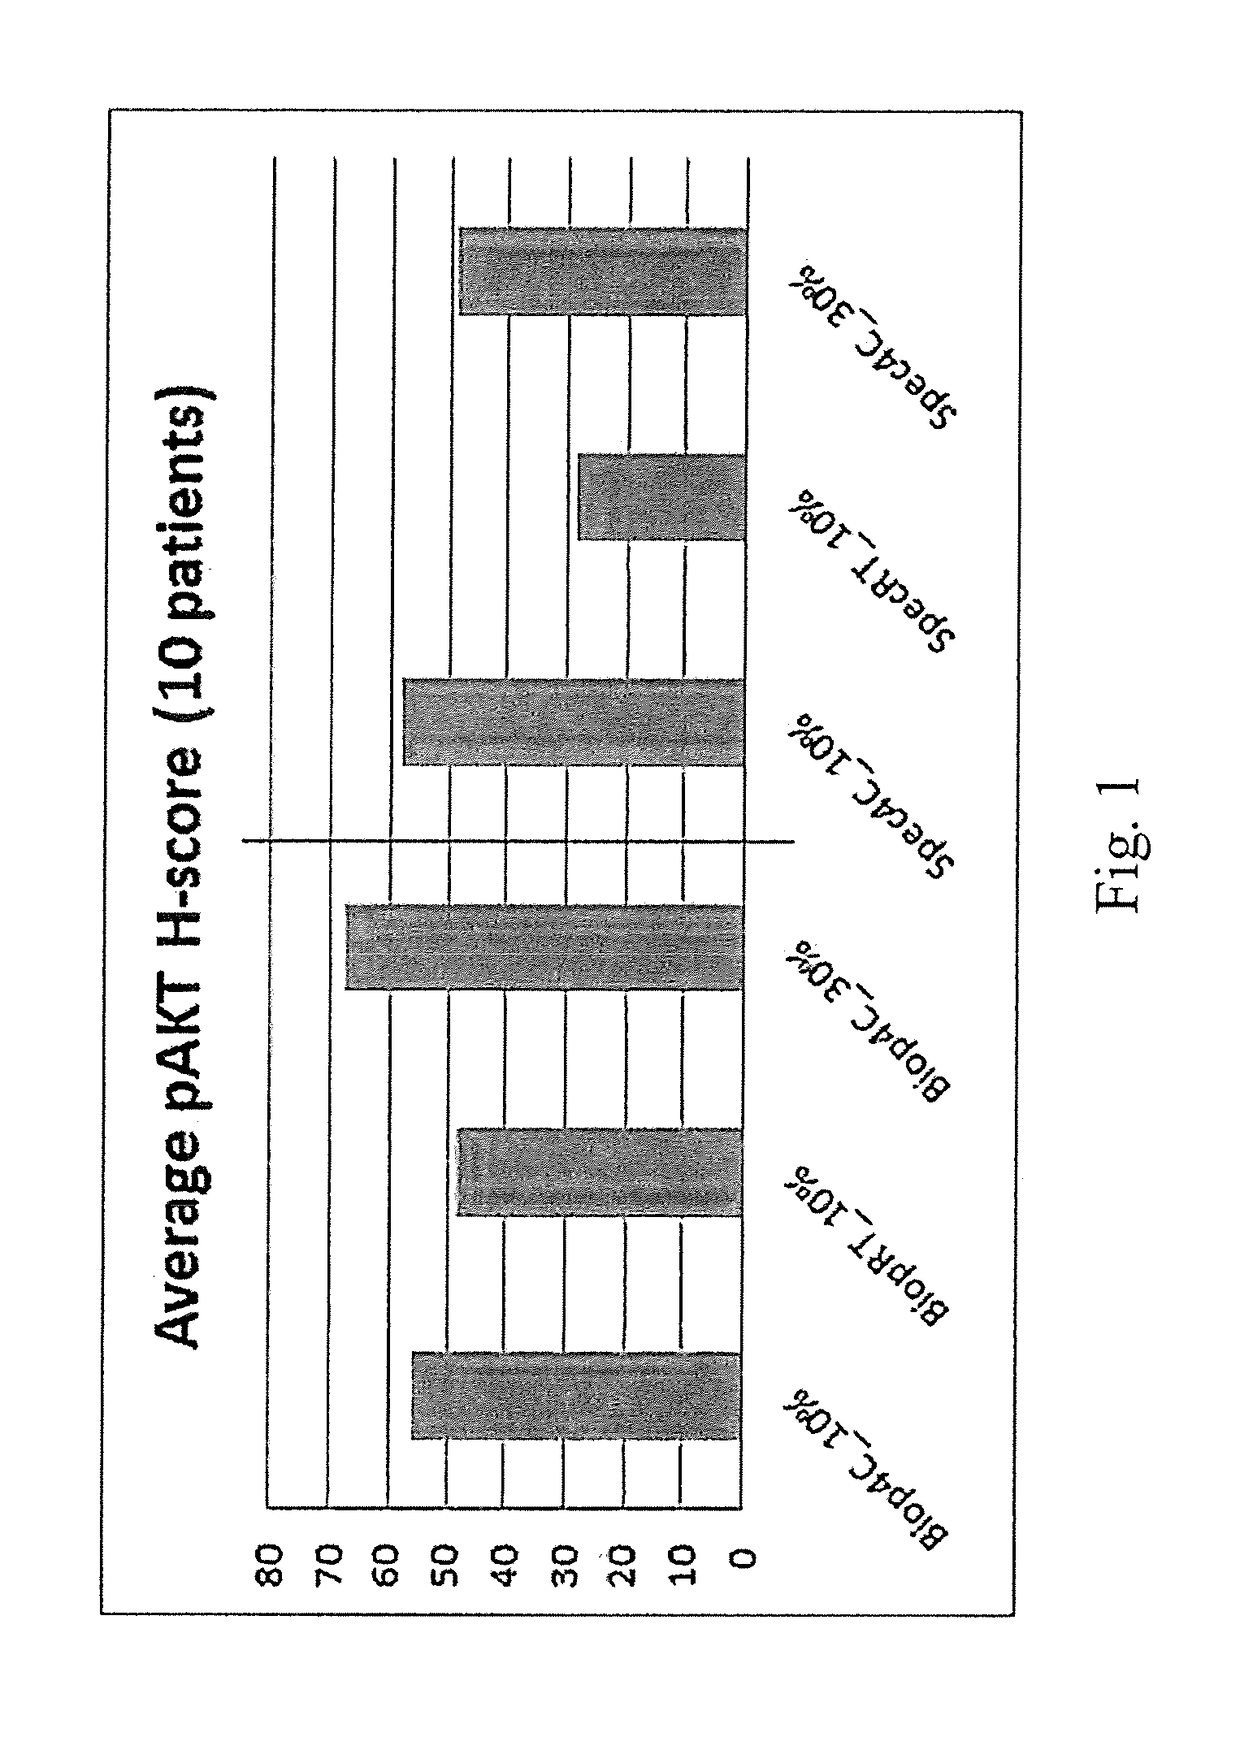
[0124]H-scores for pAKT staining level in colorectal cancer tissues are summarized for a set of 10 specimen collected with controlled cold ischemia condition (5-15 minutes). Each sample was cut into two groups of specimen sizes: 3 biopsies, “Biop” (typically with 2 mm diameter), and 3 resections, “Spec” (typically 10×10×5 mm). All specimen were then immersed into either 4° C. cold formalin with 10% or 30% concentrations, or RT 10% formalin. Samples were then stained for phospho-Akt using an anti-phospho-Akt (Ser473) monoclonal antibody (Cell Signaling Technologies). The following formula was used to calculate individual Hscores per sample:
Hscore=(low %)*1+(medium %)*2+(high %)*3
[0125]Results are shown at FIG. 1. Graph represents average pAKT Hscore for all 10 patient samples. For both sample sizes, the cold fixation method shows superior staining levels, with 30% showing the strongest Hscores.
example 2
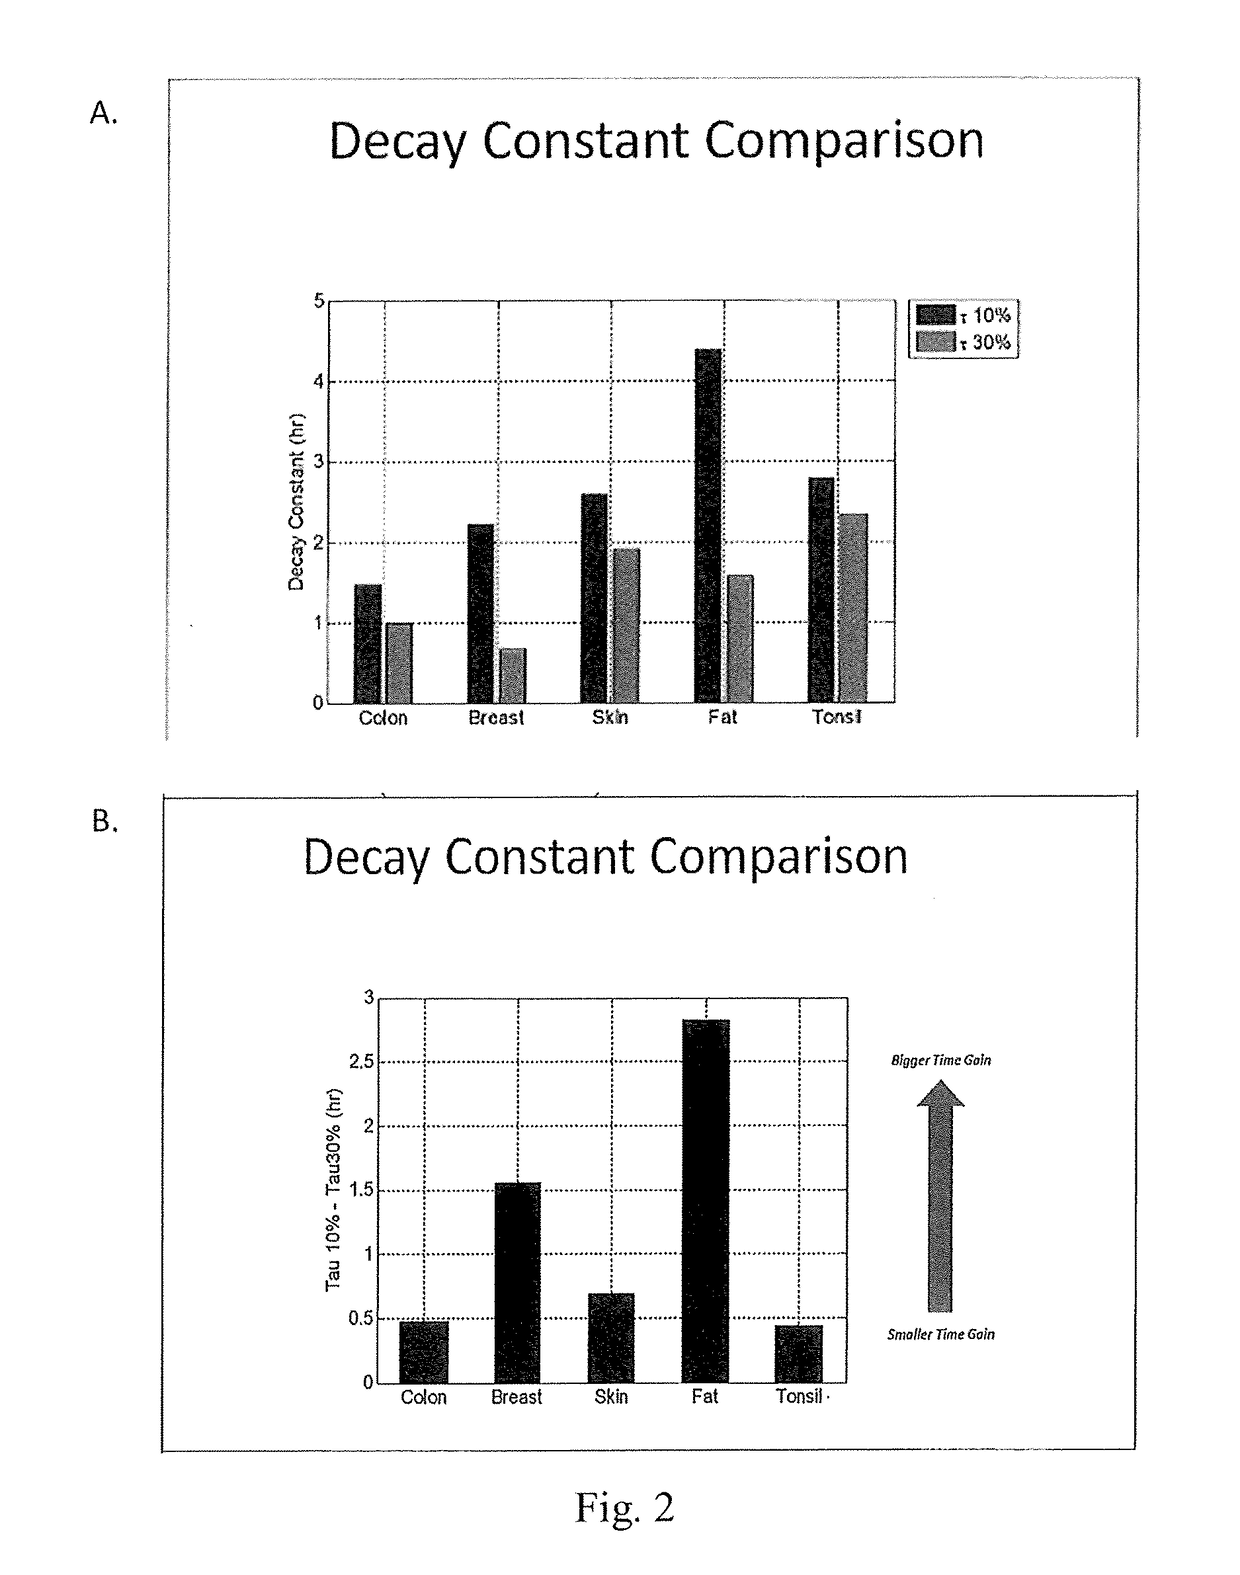
[0126]6 mm thick samples of colon, breast, skin, fat, and tonsil tissue were immersed in either 10% NBF or 30% NBF at 4° C. and the rate of fixative penetration was measured by the method of Bauer et al. (incorporated herein by reference in its entirety). Results are shown at FIGS. 2A and 2B. In FIG. 2A, the diffusion trend over time was fit to a single exponential curve. The reported decay constant, measured in hours, of that exponential curve mathematically represents the time it takes the signal to decrease by 63% of its entire amplitude and was thus used as a quantitative metric of how long diffusion takes. In FIG. 2B, diffusion speed gain comparing rate of diffusion with 30% vs 10% NBF was calculated as the differential of the decay constant's from each respective reagent. All types of tissue display noticeably faster diffusion in 30% NBF. The rate of diffusion increase was calculated as 100*(10% decay constant) / (30% decay constant), e.g. for fat 100*4.4 hr / 1.6 hr=275% faster.
example 3
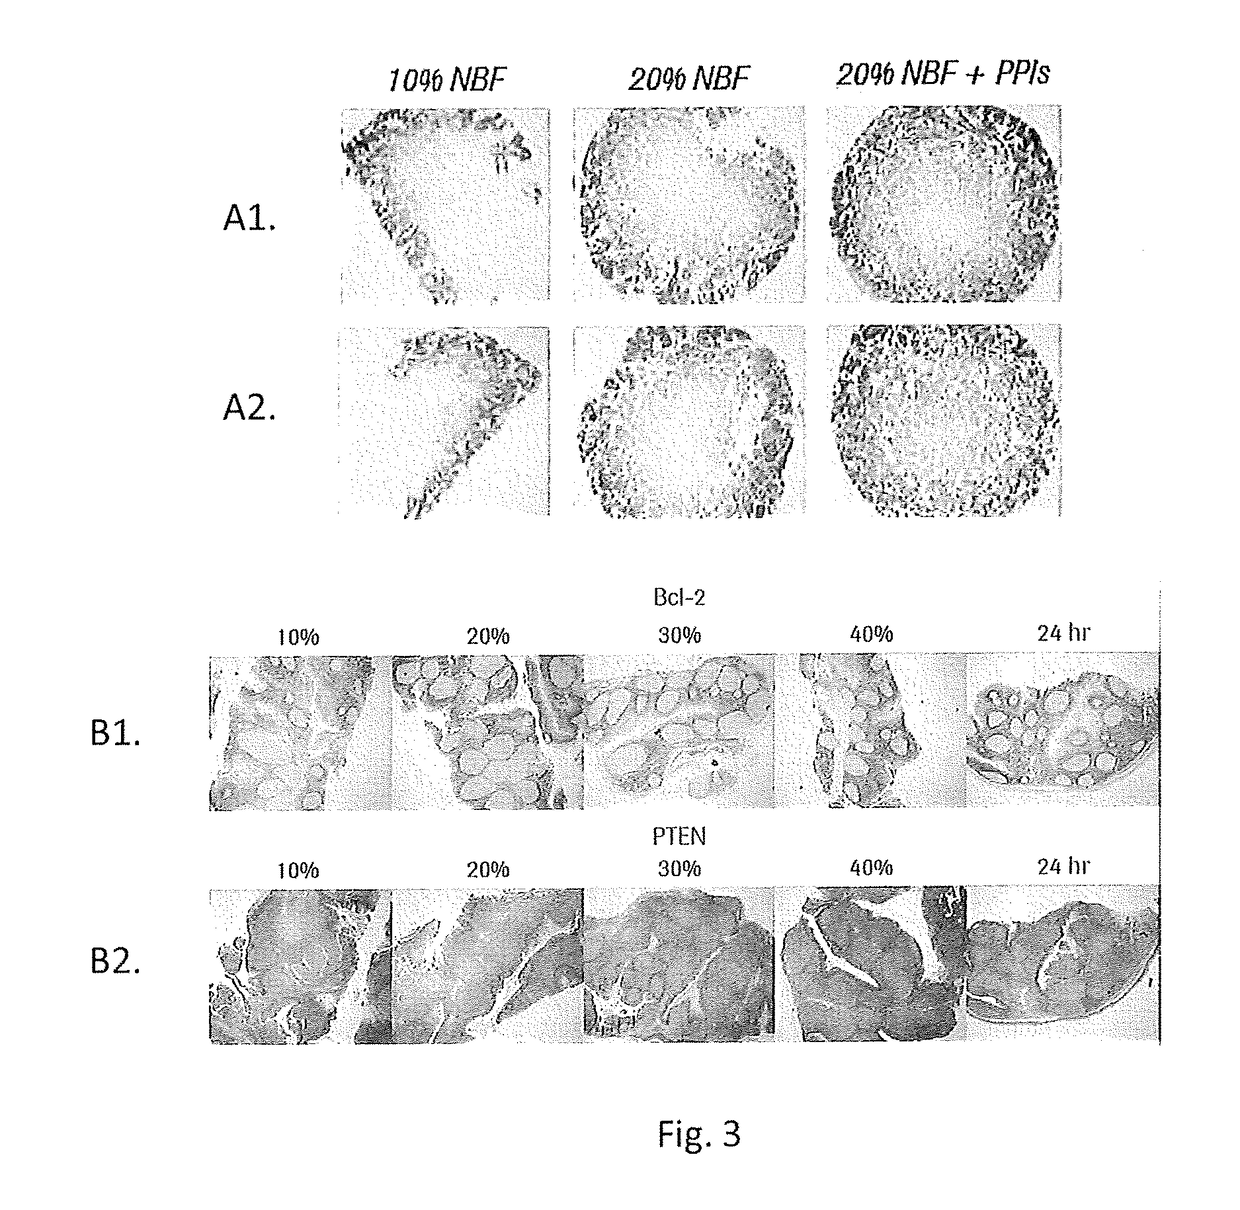
[0127]FIG. 3, Row A1 and A2 Calu3 Xenograft tumors were harvested and placed into fixative within 5 minutes. A biopsy coring device was used to remove 6 mm diameter samples from xenografts tumors to ensure the samples were of uniform size. Cores were placed into 4° C. formalin at 10%, 20% or 20%+a phosphatase inhibitor cocktail for 2 hours. Cores were then placed into 45° C. 10% NBF for 2 hours to initiate crosslinking. Samples were processed, embedded in wax and stained with an anti-pAKT antibody. FIG. 3, Row B1 and B2 Human tonsil samples cut to 4 mm thickness were placed into 4° C. formalin at 10%, 20%, 30%, or 40% NBF for 2 hours. Samples were then placed into 45° C. 10% NBF for 2 hours to initiate crosslinking. An additional sample was placed into room temperature (RT) 10% NBF for 24 hours as a control. All samples were processed, embedded and stained with either bcl-2 (B1) or PTEN (B2). Results are shown at FIG. 3.
PUM
 Abstract
Description
Claims
Application Information
 - R&D
- Intellectual Property
- Life Sciences
- Materials
- Tech Scout
- Unparalleled Data Quality
- Higher Quality Content
- 60% Fewer Hallucinations
Browse by: Latest US Patents, China's latest patents, Technical Efficacy Thesaurus, Application Domain, Technology Topic, Popular Technical Reports.
© 2025 PatSnap. All rights reserved.Legal|Privacy policy|Modern Slavery Act Transparency Statement|Sitemap|About US| Contact US: help@patsnap.com


