
Methods and Systems for Assessing Histological Stains

a method and system technology, applied in the field of histologically stained specimens, can solve the problems of specimen identification as inadequate quality, properties that are not useful in determining final quality and usability, and no way to re-calibrate the color pattern in images created

Active Publication Date: 2017-06-22
ABBOTT LAB INC
View PDF5 Cites 14 Cited by
  • Summary
  • Abstract
  • Description
  • Claims
  • Application Information

AI Technical Summary

Benefits of technology

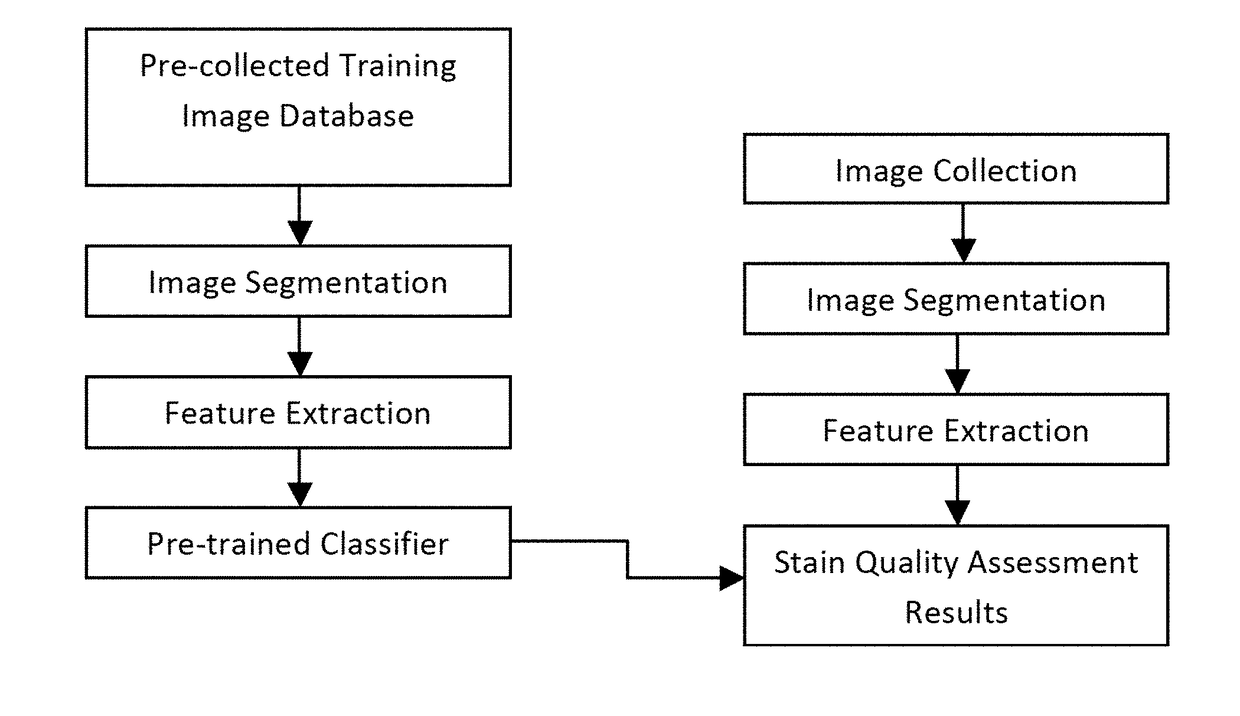
The patent describes a method for assessing the quality of a histologically stained specimen by analyzing a digital color image. The method involves defining a region of interest (ROI) based on the biological feature of the specimen and determining a color signature by quantifying color parameters over the ROI. The color signature is then compared to a reference color signature specific to the biological feature and the histological stain to assess the quality of the stain. The method can be used to evaluate the quality of a histological stain in a biological sample, such as a blood sample or a tissue sample.

Problems solved by technology

When performed by a human observer, there is no way to re-calibrate the coloration pattern in images created in microscopes using different illumination sources
If stain composition is not properly formulated or the stain is not properly used, it may create conditions in the cells in which the normal neutrophilic granules tend to overstain and appear as toxic granules.
Despite the existence of many analytical methods of determining stain components and their relative amount, purity, pH and other physicochemical properties of the reagents involved, these properties are not useful in determining their final quality and usability, primarily because these characteristic are related to the final stained product and not only the quality of the individual reagents used.
In some aspects, the system assesses whether the determined color signature is outside of a predetermined range and, when outside the range, the specimen is identified as inadequate quality and held to prevent further processing.

Method used


Image

  • Methods and Systems for Assessing Histological Stains
  • Methods and Systems for Assessing Histological Stains
  • Methods and Systems for Assessing Histological Stains

Examples


example 1

Assessing Coloration Patterns in a Romanowsky Type Stained Specimen Using a Set of 6 Color Parameters (i.e., “Coloration Coefficients Method”)

[0198]The method used digital images from a Romanowsky-type stained hematological specimen smear, obtained from an optical microscope equipped with a color charge-coupled device (CCD) camera in Red, Green, and Blue (RGB) format. For each pixel, 3 color parameters (8 bit digitized values of cumulative absorbance in red, green and blue spectral channels) were measured and 3 color coefficients (a Red Coefficient, a Blue Coefficient and a Blue-Red Balance) were calculated to characterize hue and intensity of the color for any given pixel in the image. A Red Coefficient was calculated as a ratio of mean intensity value in the red channel versus the green channel, a Blue Coefficient was calculated as a ratio of mean intensity value in the blue channel versus the red channel, while a Blue-Red Balance was a ratio of the Blue Coefficient versus the Red...

example 2

f “Coloration Coefficients Method” Using a Color Calibration Target with a Well-Defined Color Mask

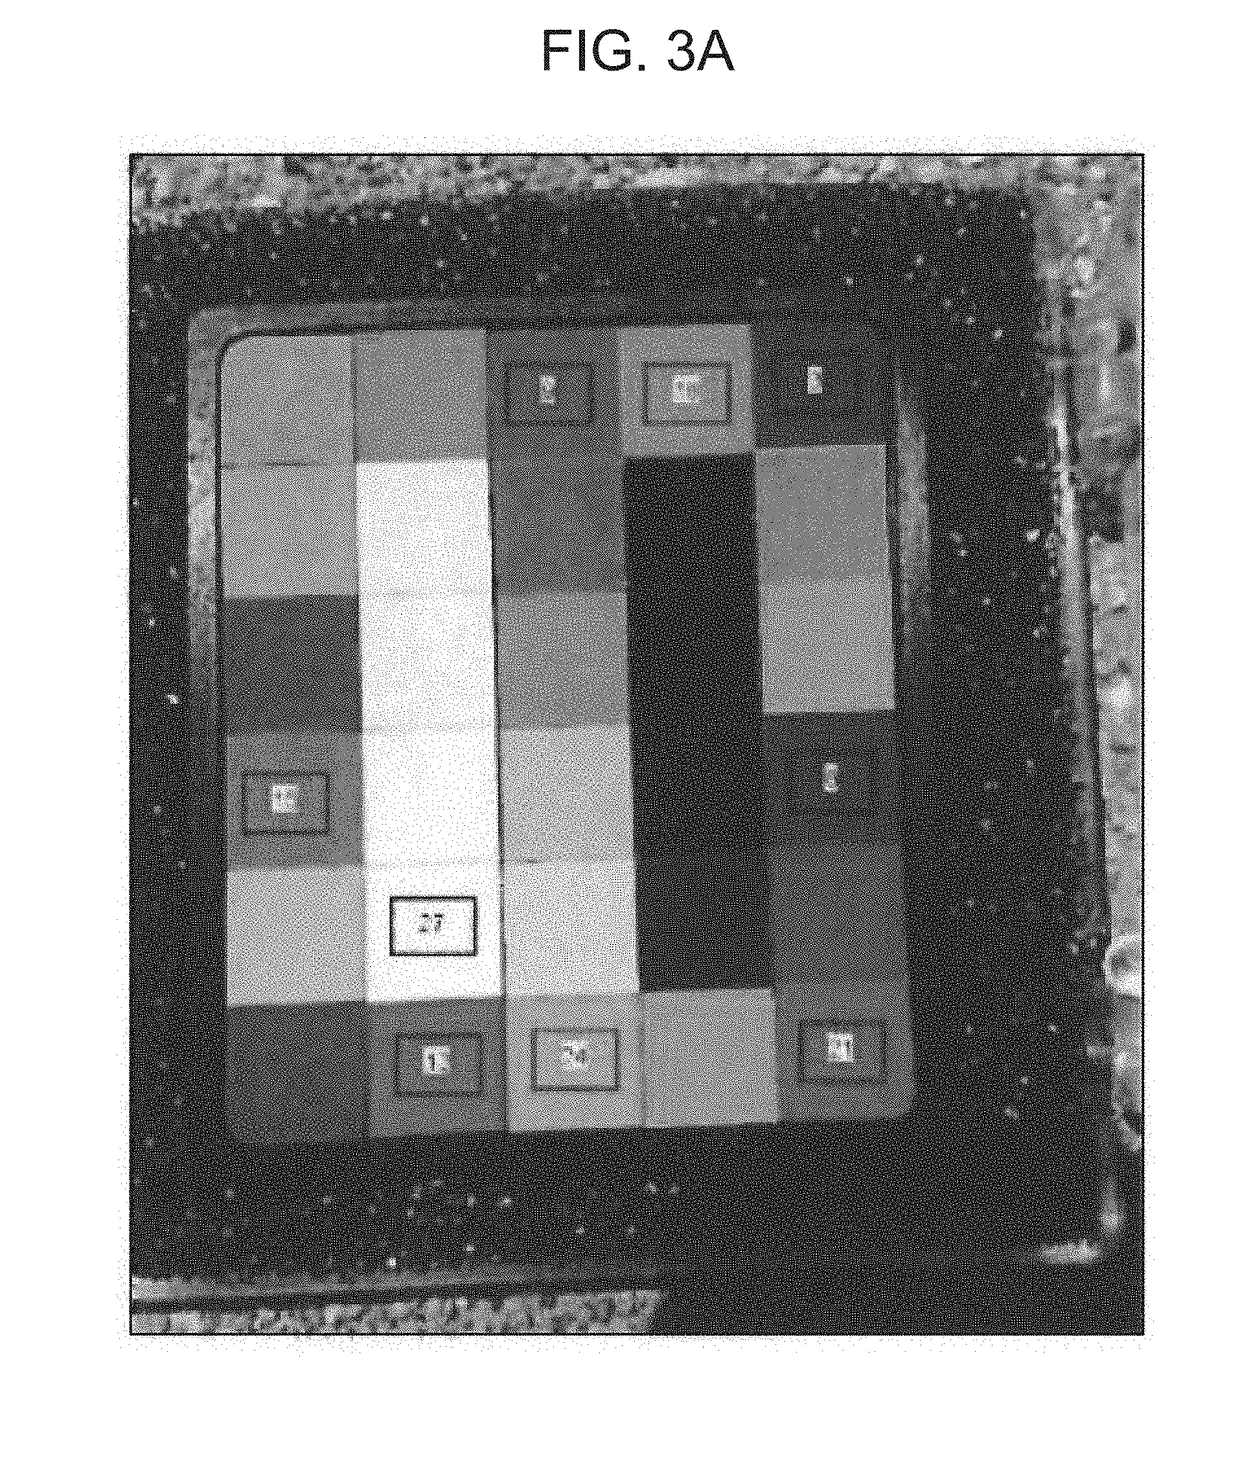
[0207]A concept of the present method was tested by using a color calibration target with a well-defined color mask (FIG. 3A). The data calculated for various hues of red, blue and purple colors on the mask (FIG. 3B) validate the concept of the method. For example, a Blue Coefficient obtained for blue colors was significantly higher compared to non-blue colors, while a darker versus lighter blue color is discriminated by a mean value of a blue signal. Similarly, reddish colors have a higher value of Red Coefficient, with a varying intensity of red signal depending on the lightness or darkness of the red color. Additional information on the ratio (balance) of red and blue hues in the specific color was given by the Blue-Red Balance, which respectively showed high values for blue colors, low values for red colors and around a unit value for hues of purple.

[0208]FIG. 3: A color target mask...

example 3

t of the Coloration of Eosinophils and Red Blood Cells Using “Coloration Coefficients Method”

[0209]This example demonstrates how the present method was applied to evaluate coloration of eosinophils and red blood cells in different smears stained with a Wright-Giemsa stain. As seen from the data provided, a pale eosinophil cell is clearly discriminated from a darker eosinophil cell by having higher values of R, G, B signals, while more reddish (for the granules) or more bluish (for the nuclei) hues for each main color can be distinguished by varying values of color coefficients (FIG. 4). Similarly, a normal erythrocyte can be discriminated from the erythrocyte with polychromasia by the value of the Blue-Red Balance, which indicates that a polychromatic cell has a higher degree of blue hue than the normal cell, with Blue-Red Balance values 1.03 (polychromatic) versus 0.85 (normal) (FIG. 5).

[0210]FIG. 4: Application of the present method to evaluate eosinophil coloration images of Wrig...


PUM


Abstract

The present disclosure includes methods of assessing a histologically stained specimen based on a determined color signature of a region of interest of the specimen. Such assessments may be performed for a variety of purposes including but not limited to assessing the quality of the histological stain, as part of identifying one or more biologically relevant features of the image, as part of differentiating one feature of the image from other features of the image, identifying an anomalous area of the stained specimen, classifying cells of the specimen, etc. Also provided are systems configured for performing the disclosed methods and computer readable medium storing instructions for performing steps of the disclosed methods.

Description

CROSS-REFERENCE[0001]This application claims the benefit of U.S. Provisional Patent Application No. 62 / 269,543 filed Dec. 18, 2015, which application is incorporated herein by reference in its entirety.INTRODUCTION[0002]The assessment of histologically stained specimens, including the assessment of the quality of such specimens, is typically a very subjective endeavor. The methodology used in the field was established based on visual examination of the specimen under the microscope by one trained individual at time, when digital optical microscopy was not available yet. Currently applied methodology relies on human perception of coloration in different cell types and intracellular compartments, and includes distinguishing of various hues and intensities of colors. For example, for neutrophil granulocytes a desired cell coloration is described as “dark blue to purple nucleus, pale pink to almost colorless cytoplasm, red to lavender small granules”. Similar type criteria (below provid...

Claims


Application Information

Patent Timeline
IPC IPC(8): G06T7/40C12Q1/00G06V30/224G06V10/50G06V10/56
CPCG06T7/0014G06T7/11G06T7/90G06K9/6202G06T2207/30024G06K9/00147G06T7/136G01N33/52G06T2207/10024G06K9/0014G06V20/695G06V20/698G06V10/255G06V10/50G06V10/56G06V10/758G06V20/69G01N15/1433
Inventor BEREZHNA, SVITLANA Y.NIEVES ALICEA, RENECOLEMAN, MARILOU L.STONAS, WALTER G.COWART, WILLIE J.LI, WENJINGCIUCUREL, EMA C.
Owner ABBOTT LAB INC
Learn More