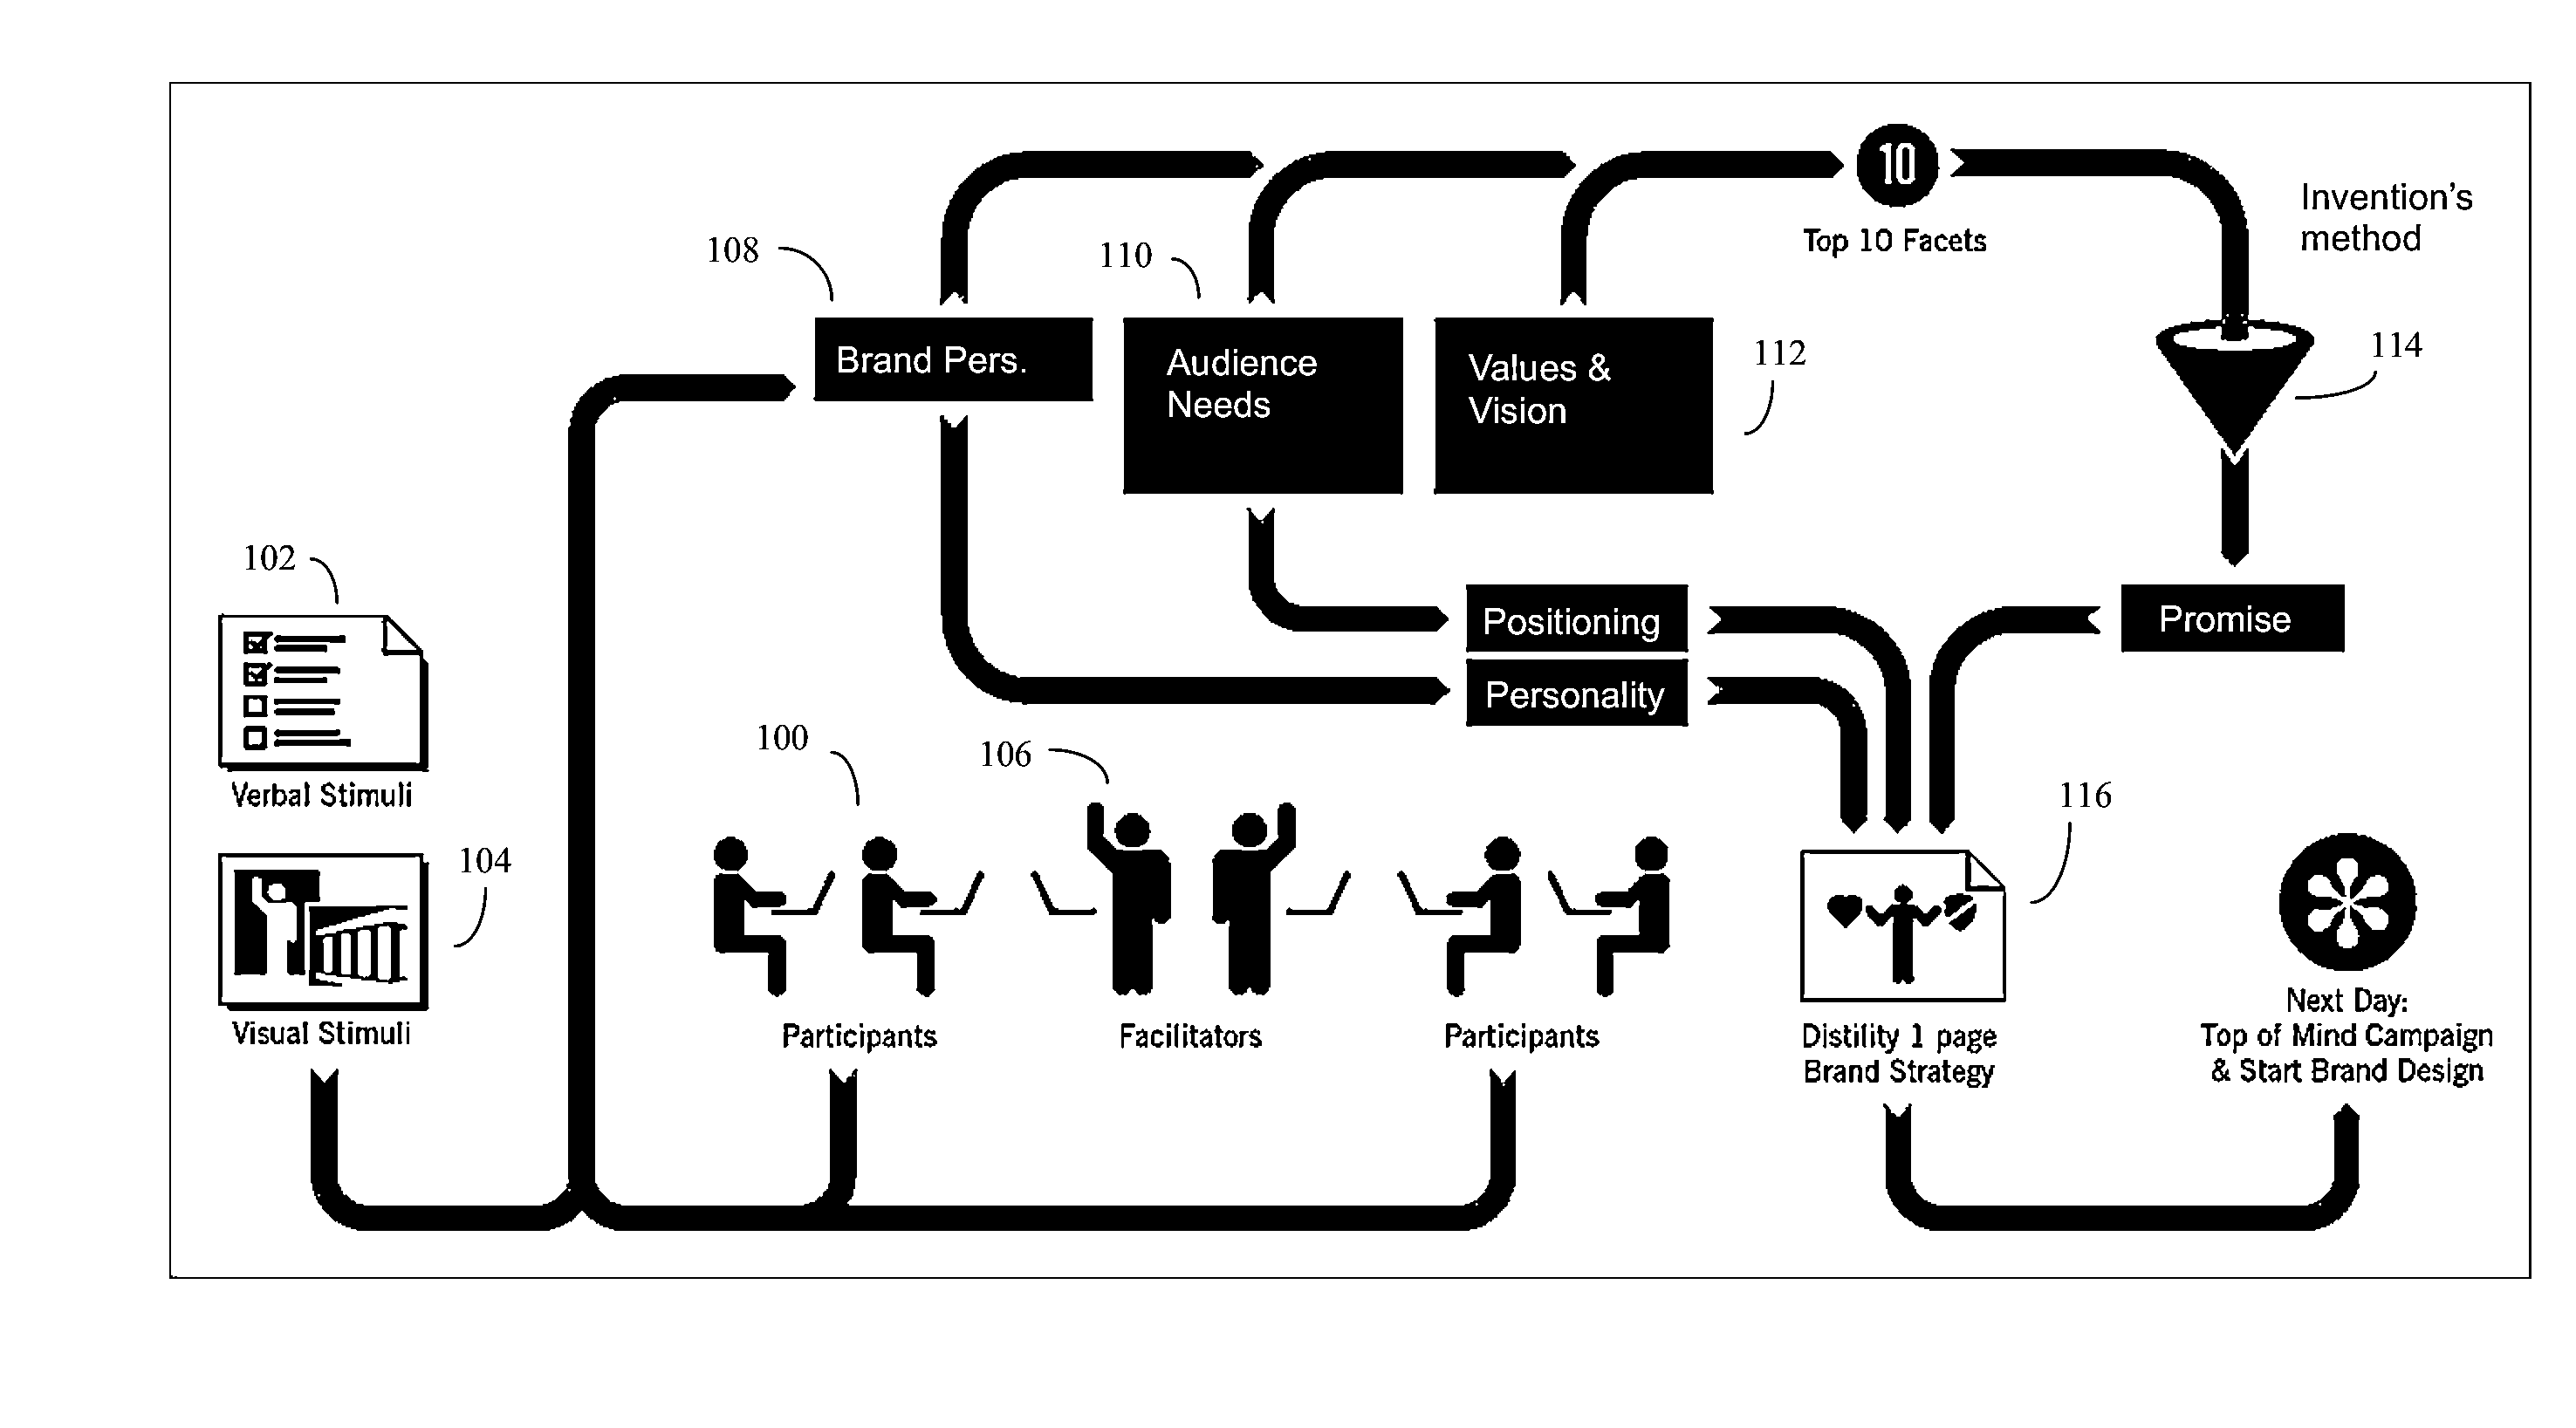
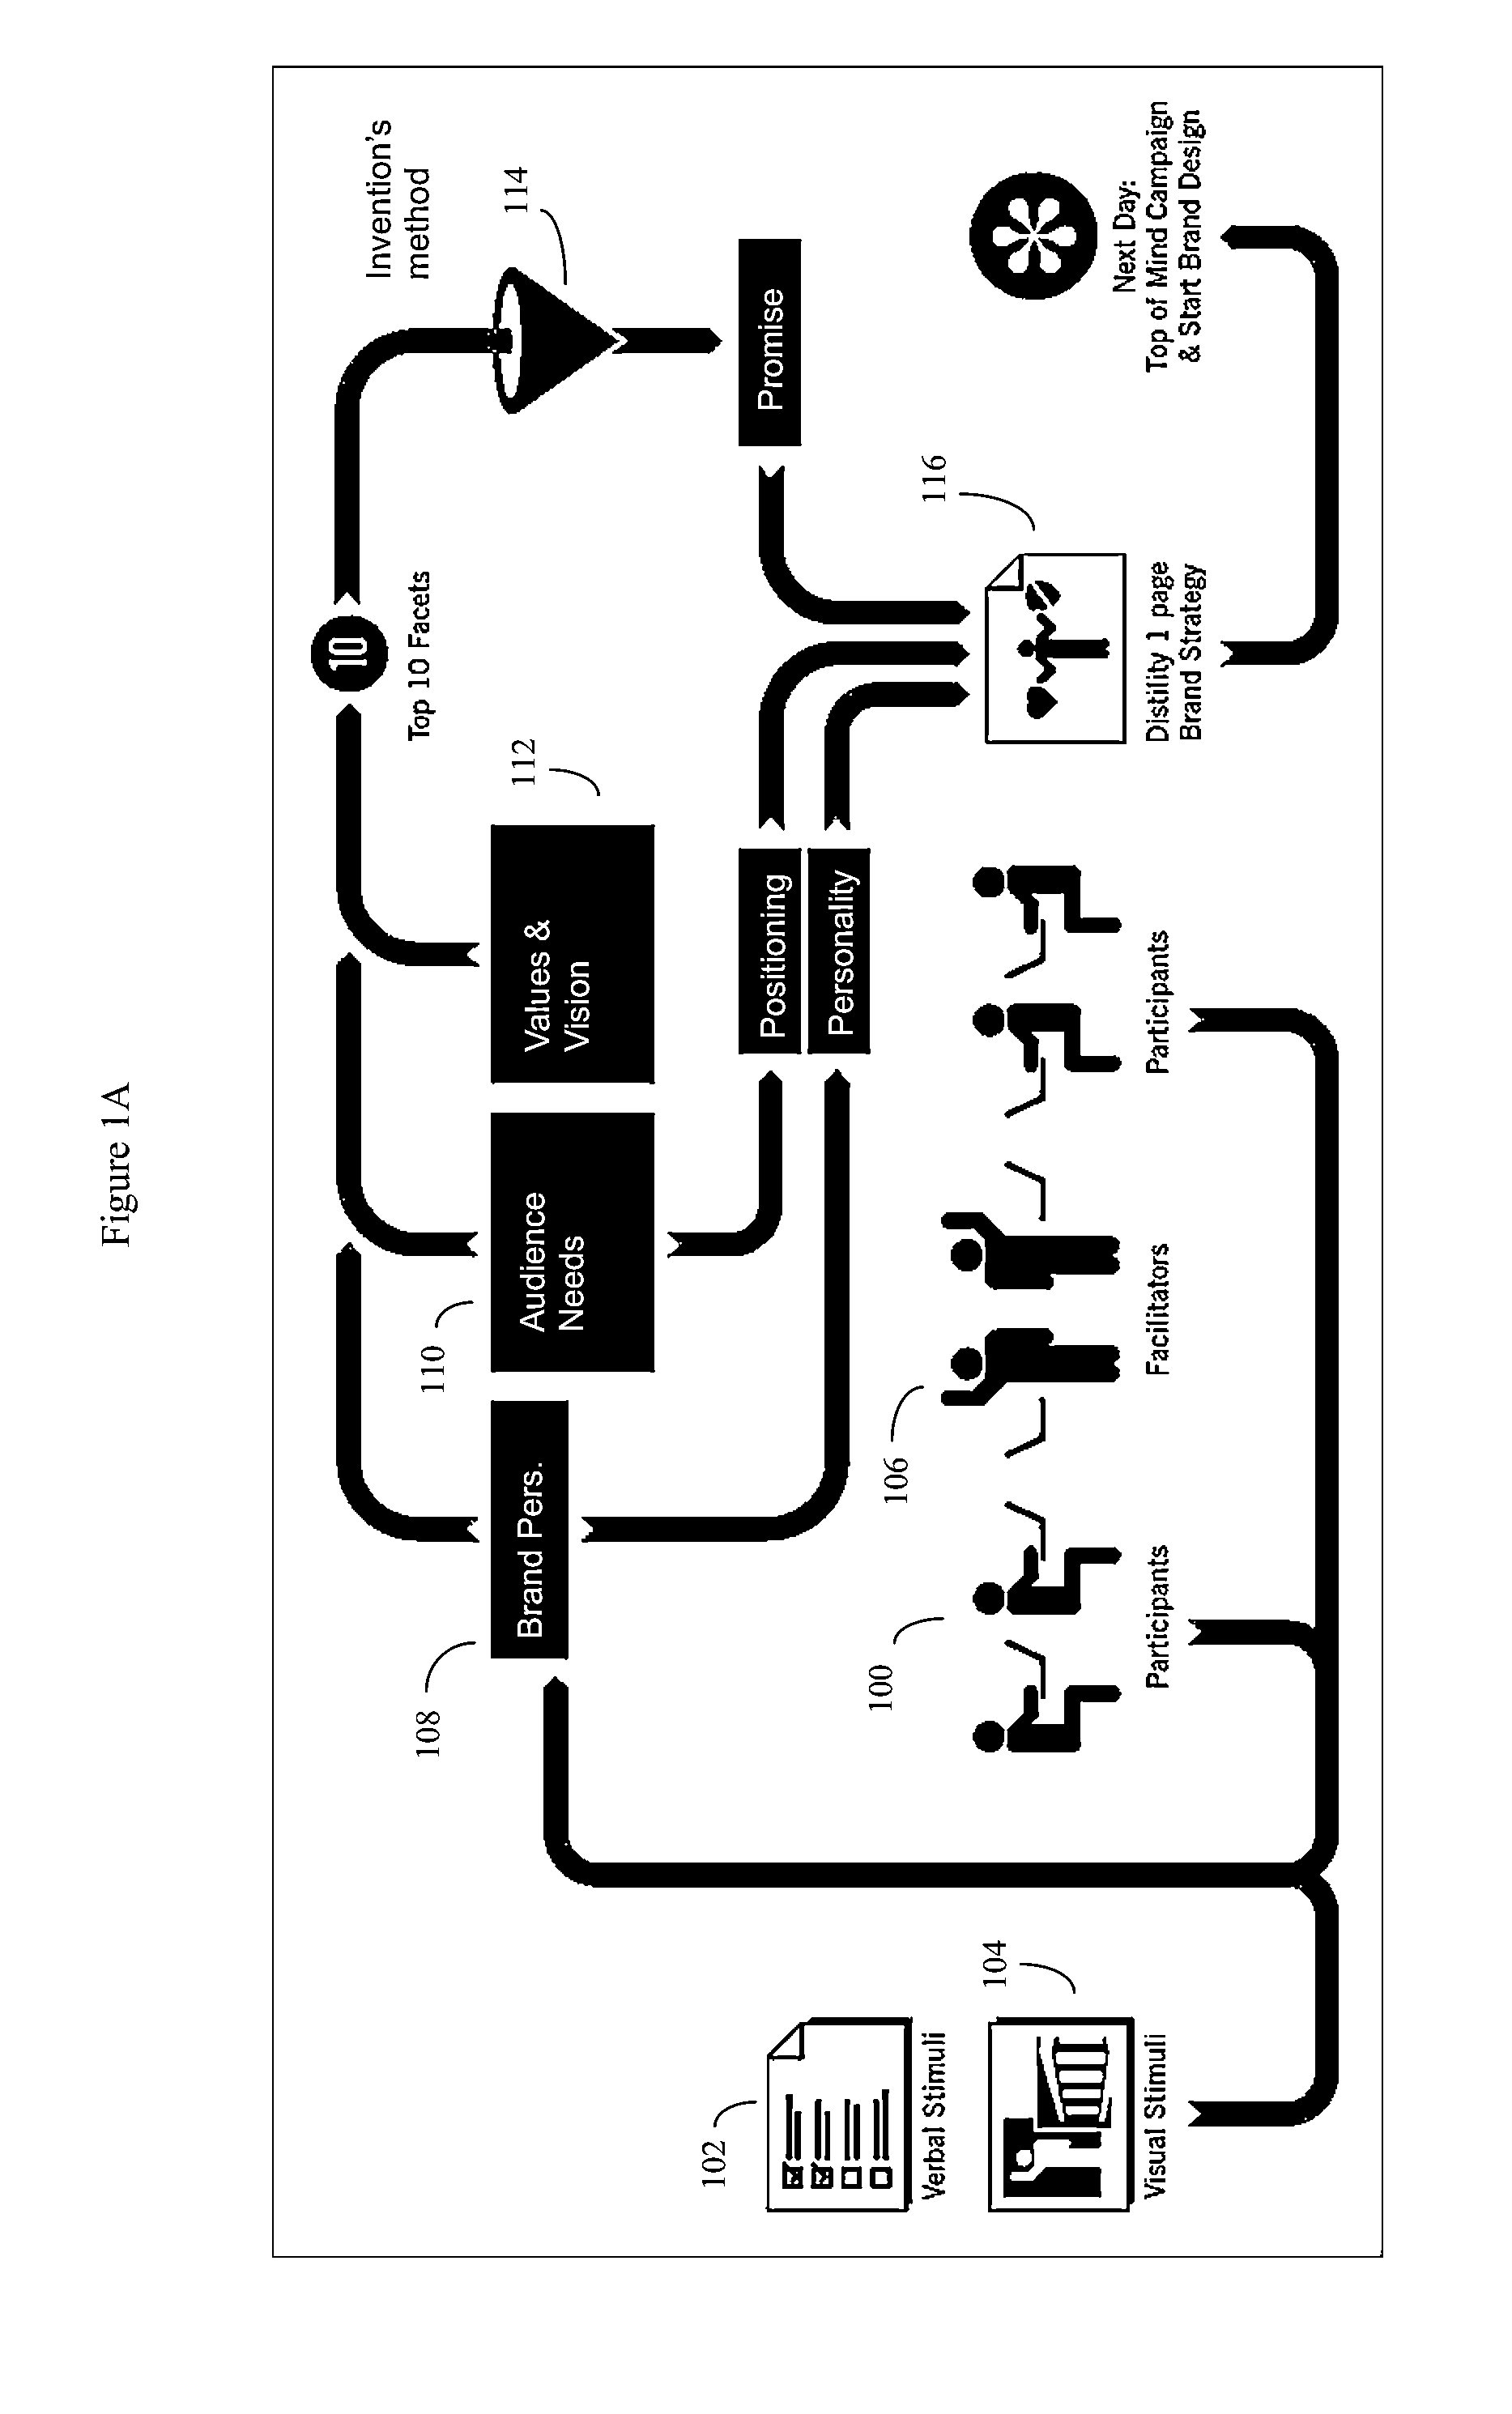
Method of visualizing the collective opinion of a group
a collective opinion and decision-making technology, applied in the field of computerized decision-making tools, can solve the problems of inability to fully capture group insights into brand marketing and other types of group decision, cumbersome and difficult for non-expert users to use, and inability to effectively harness the diversity of opinions and insights of brands, etc., to achieve high-quality results and facilitate complex group qualitative decisions
- Summary
- Abstract
- Description
- Claims
- Application Information
AI Technical Summary
Benefits of technology
Problems solved by technology
Method used
Image

Examples
example
[0095]Suppose we have summarized the user ratings into the similarity matrix as shown in FIG. 8.
[0096]For the ease of calculation, we will transform the values in this similarity matrix to show the similarity in a positive scale. The formula for transformation is:
−1*(Xij−maximum cell value), where Xij is value of row i and column j, iε(1,N) and jε(1,N), N is the total number of Data Points
[0097]In our example, the maximum cell value is Total # of Users*2=>9*2=18. This transformed matrix is shown in FIG. 9, which shows the similarity matrix transformed to a positive scale.
[0098]In the transformed similarity matrix, the smaller values represent more similar Data Points, while the larger values represent more dissimilar Data Points. The closest (i.e. most similar) pair of Data Points in this example are Data Point 1 and Data Point 10, with a rating of ‘1’. They are merged into a new cluster called “Data Point 1 / 10”. The level of the new cluster is thus L (Data Point 1, Data Point 10)=1...
PUM
 Abstract
Description
Claims
Application Information
 - Generate Ideas
- Intellectual Property
- Life Sciences
- Materials
- Tech Scout
- Unparalleled Data Quality
- Higher Quality Content
- 60% Fewer Hallucinations
Browse by: Latest US Patents, China's latest patents, Technical Efficacy Thesaurus, Application Domain, Technology Topic, Popular Technical Reports.
© 2025 PatSnap. All rights reserved.Legal|Privacy policy|Modern Slavery Act Transparency Statement|Sitemap|About US| Contact US: help@patsnap.com