Method of visualizing the collective opinion of a group

a collective opinion and decision-making technology, applied in the field of computerized decision-making tools, can solve the problems of inability to fully capture group insights into brand marketing and other types of group decision, cumbersome and difficult for non-expert users to use, and inability to effectively harness the diversity of opinions and insights of brands, etc., to achieve high-quality results and facilitate complex group qualitative decisions

Active Publication Date: 2012-04-19
6464076 CANADA OA DISTILITY DISTILITY
View PDF3 Cites 27 Cited by
  • Summary
  • Abstract
  • Description
  • Claims
  • Application Information

AI Technical Summary

Benefits of technology

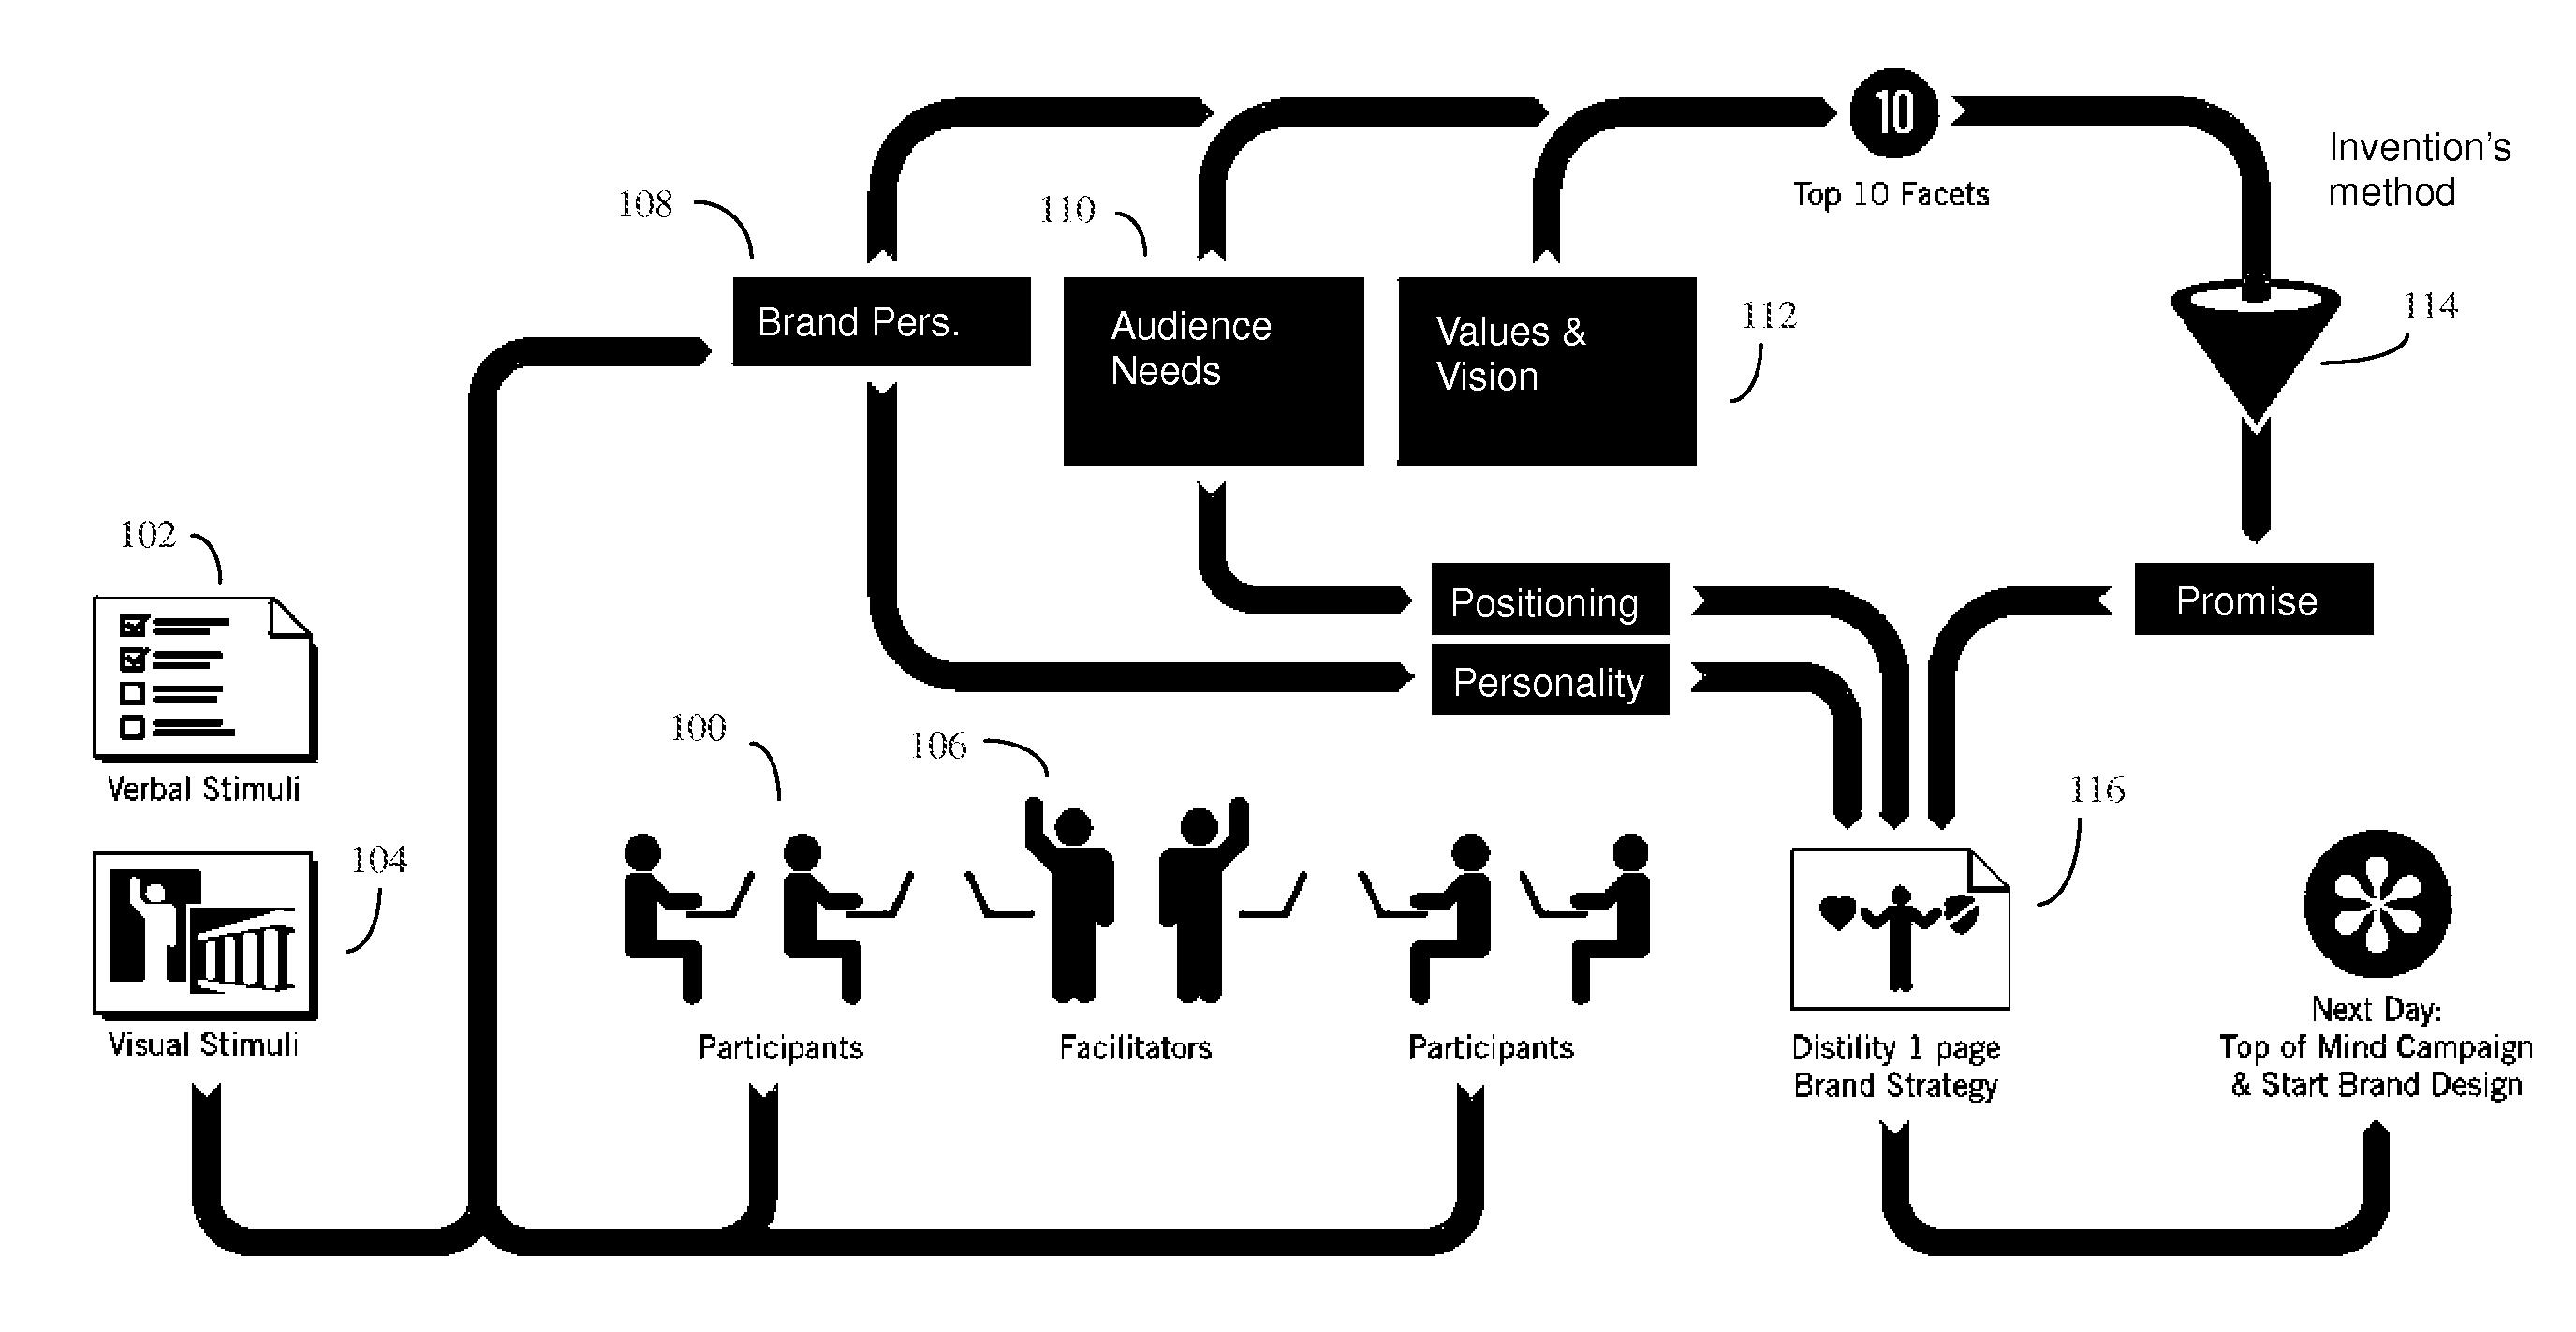
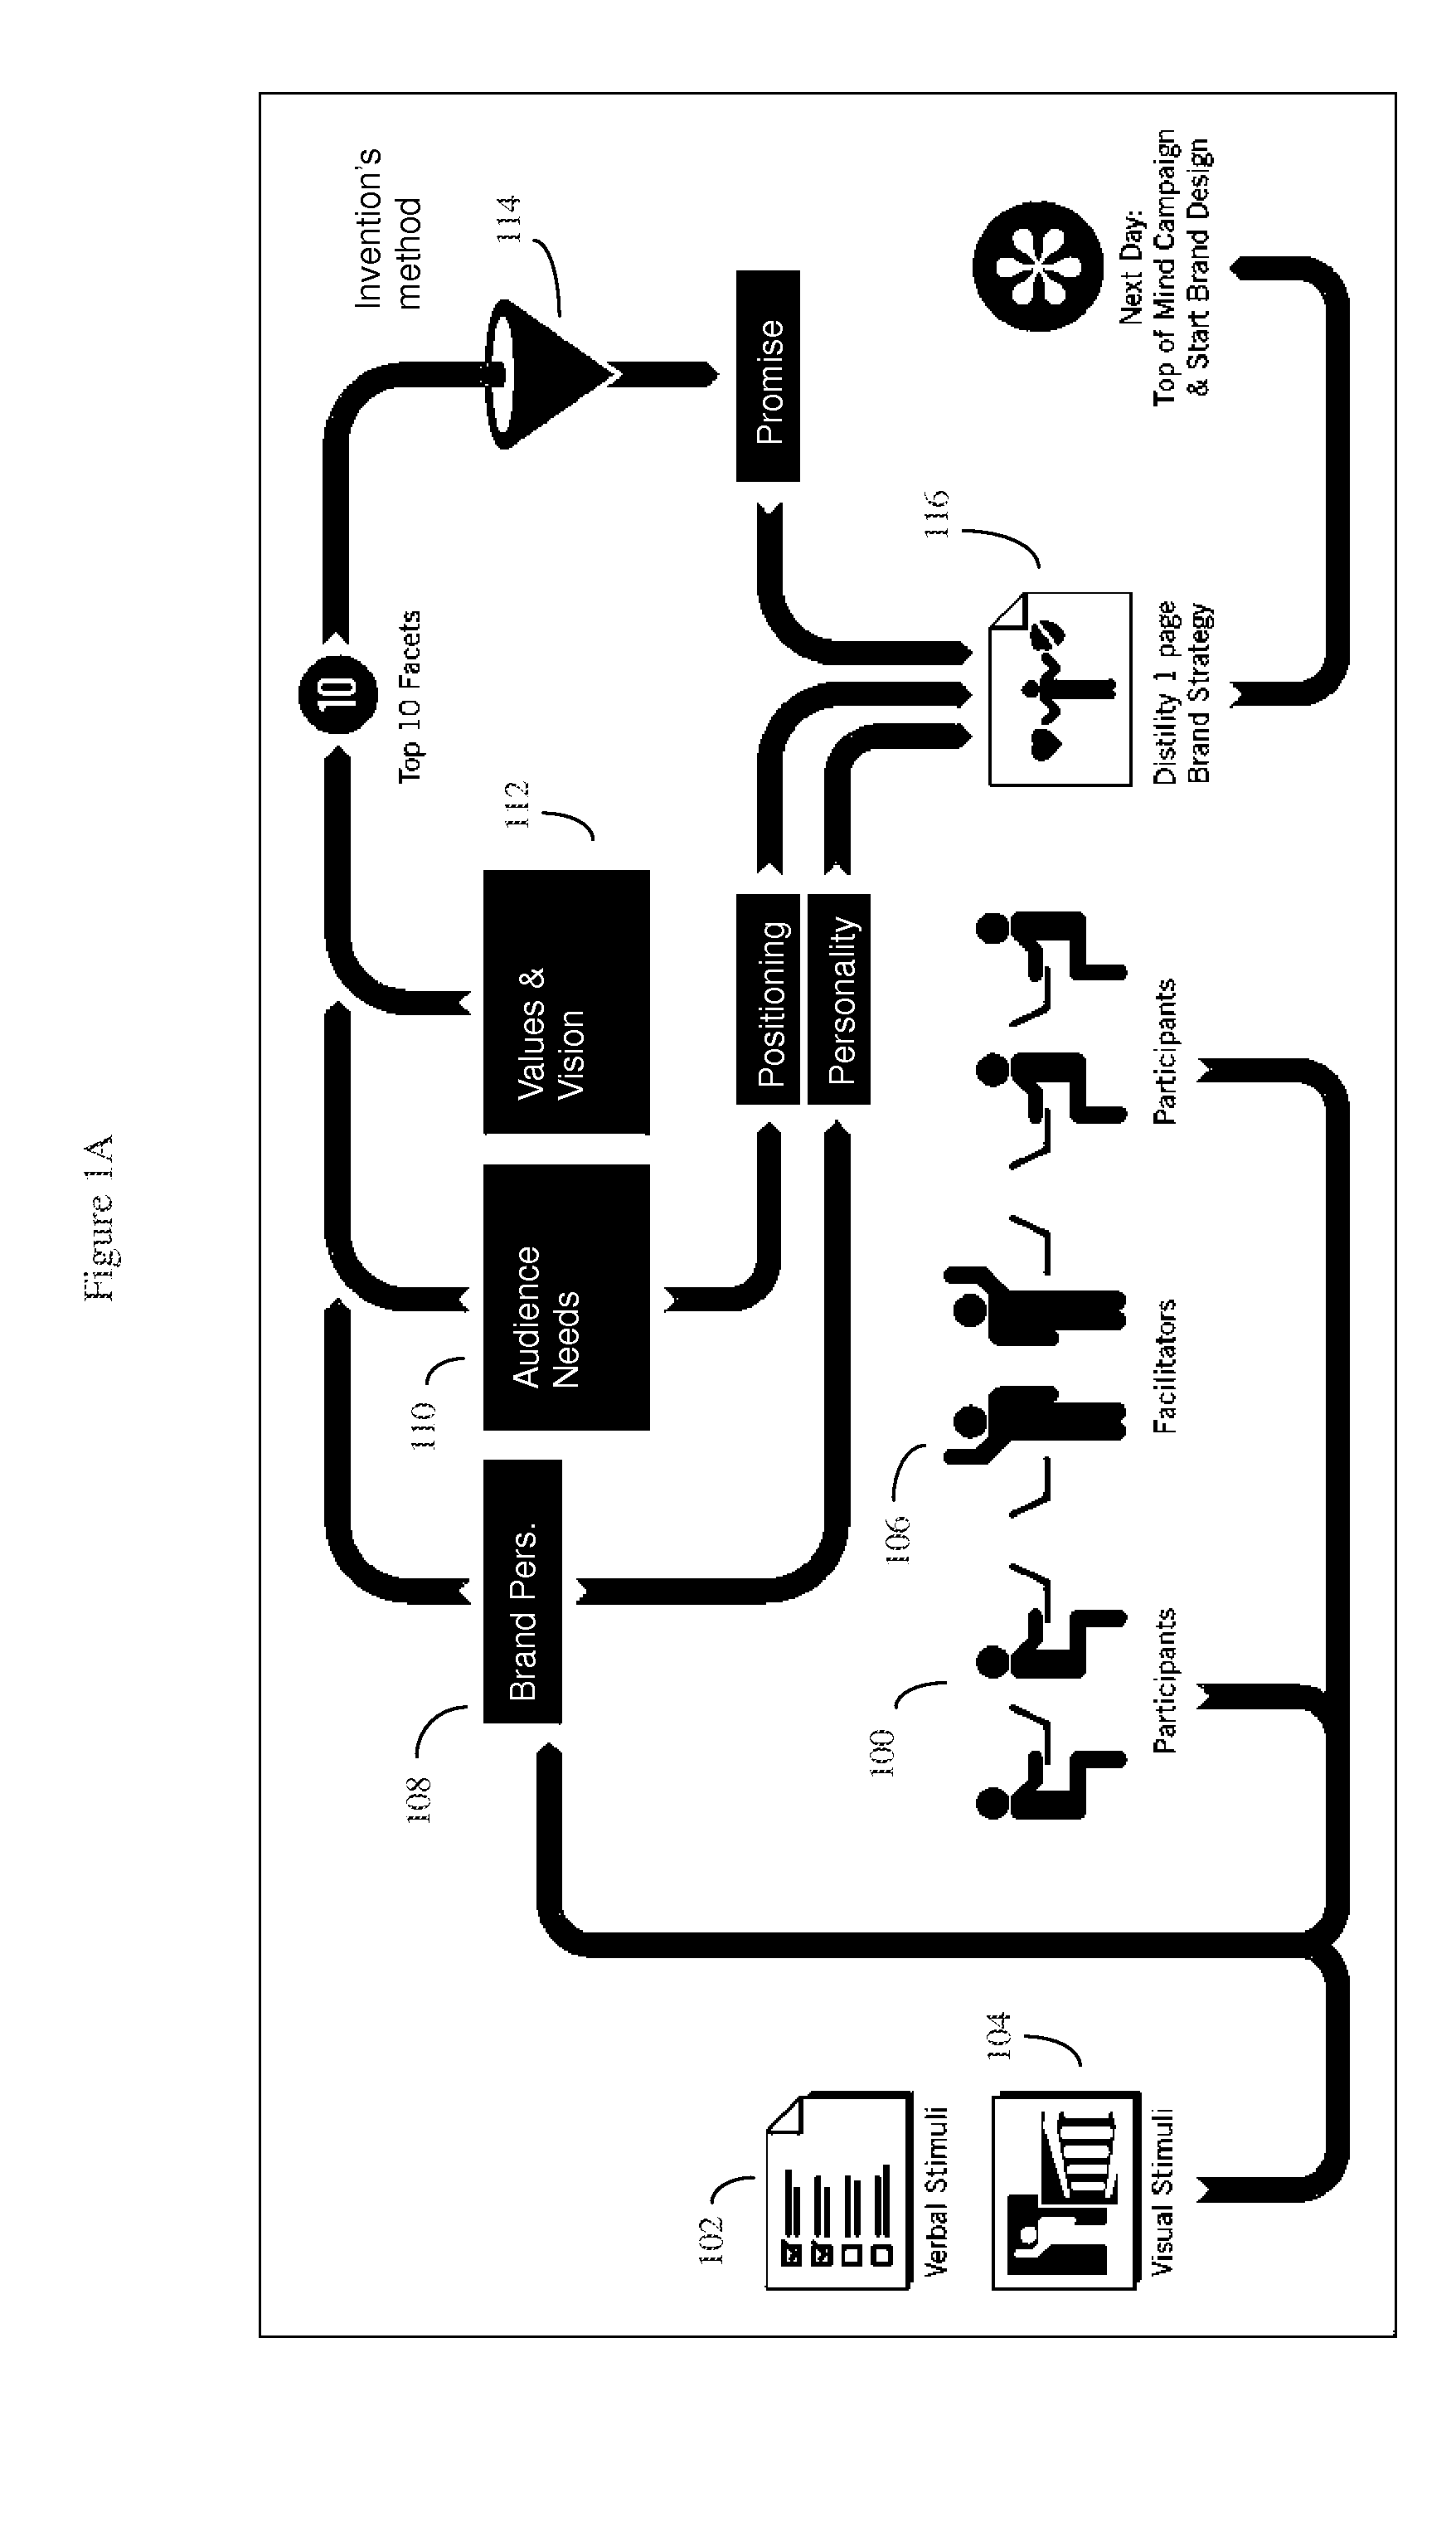
[0031]FIG. 15 shows how the entire process may be used to facilitate complex group qualitative decisions, such as product branding, and produce high quality results within a single day.

Problems solved by technology

Unfortunately, prior art methods of group decision making, brand analysis and brand strategy tended to not effectively harness the diversity of opinions and insight that larger groups can bring to a particular problem.
Prior art computerized group decision methods, exemplified by U.S. Pat. Nos. 7,177,851; 7,308,418 and U.S. patent application Ser. Nos. 10 / 848,989; 10 / 874,806; 11 / 181,644; 11 / 672,930; 11 / 672,930 and others tended to be cumbersome and difficult for non-expert users to use, and as a result failed to fully capture group insights into brand marketing and other types of group decision making.

Method used


Image

  • Method of visualizing the collective opinion of a group
  • Method of visualizing the collective opinion of a group
  • Method of visualizing the collective opinion of a group

Examples


example

[0092]Suppose we have summarized the user ratings into the similarity matrix as shown in FIG. 8.

[0093]For the ease of calculation, we will transform the values in this similarity matrix to show the similarity in a positive, scale. The formula for transformation is:

−1*(Xij−maximum cell value), where Xij is value of row i and column j, iε(1,N) and jε(1,N), N is the total number of Data Points

[0094]In our example, the maximum cell value is Total # of Users*2=>9*2=18. This transformed matrix is shown in FIG. 9, which shows the similarity matrix transformed to a positive scale.

[0095]In the transformed similarity matrix, the smaller values represent more similar Data Points, while the larger values represent more dissimilar Data Points. The closest (i.e. most similar) pair of Data Points in this example are Data Point 1 and Data Point 10, with a rating of ‘1’. They are merged into a new cluster called “Data Point 1 / 10”. The level of the new cluster is thus L (Data Point 1, Data Point 10)=...


PUM


Abstract

A computerized method of visualizing the collective opinion of a group regarding one or more qualitative issues. The group initially selects N issues from the universe of potential issues and often assigns the issues images and titles. The system presents each user with graphical user interface screens wherein individual users vote on the relative importance and degree of relationship between the N aspects (Data Points) and issues, often using drag and drop methods. The software computes N×N similarity matrices based on users voting input and clusters various aspects into groups of greater and lesser similarity and importance, and presents results of users qualitative ranking in easy to read relationship tree diagrams where the relative importance and qualitative relationship of the issues may be designated by size and other graphical markers. The software may reside on a network server and present display screens to web browsers running on users computerized devices.

Description

[0001]This application claims the priority benefit of provisional patent application 61 / 393,283, “METHOD OF VISUALIZING THE COLLECTIVE OPINION OF A GROUP”, inventor Alexander L. Davids, filed Oct. 14, 2010, the contents of which are incorporated herein by reference.BACKGROUND OF THE INVENTION[0002]1. Field of the Invention[0003]The invention is in the general field of computerized decision-making tools, in particular tools for qualitative analysis of issues such as corporate, product, service or cause branding, marketing, business strategy and communications messaging.[0004]2. Description of the Related Art[0005]In some areas of group decision making, particularly areas relating to taste or subjective opinions or qualitative assessment, often the collective opinions of a large group of individuals are viewed as the most optimal or “best” solution.[0006]In the business world, this sort of statistical averaging approach is somewhat related to problems encountered in certain types of g...

Claims


Application Information

Patent Timeline
Patent Type & Authority Applications(United States)
IPC IPC(8): G06F17/30
CPCG06Q10/10
Inventor DAVIDS, ALEXANDER
Owner 6464076 CANADA OA DISTILITY DISTILITY
Why Eureka
Try Eureka