
Non-invasive method for diagnosis of prostate cancer

a prostate cancer and non-invasive technology, applied in combinational chemistry, biochemistry apparatus and processes, library screening, etc., can solve problems such as pain, cancer cells may metastatically spread, and difficulty in urination, and achieve the effects of reducing the risk of cancer, and reducing the risk of prostate cancer

Inactive Publication Date: 2013-02-07
DRESDEN UNIVERSITY OF TECHNOLOGY
View PDF1 Cites 2 Cited by
  • Summary
  • Abstract
  • Description
  • Claims
  • Application Information

AI Technical Summary

Benefits of technology

The diagnostic method described in this patent increases reliability by analyzing the expression levels of certain genes including hepsin, prostate cancer antigen 3 (PCA3), prostate specific antigen (PSA), PCA3 in combination with EZH2 or prostein, or the combination of PCA3, EZH2, and prostein. The method can also consider the expression levels of TRPM8, a marker gene. The use of fluorescent compounds allows for the monitoring of the reaction and the optimization of amplification conditions. Overall, the diagnostic method provides a more accurate and reliable means of diagnosing prostate cancer.

Problems solved by technology

Prostate cancer may cause difficulties in urinating, pain, problems during sexual intercourse, or erectile dysfunction.
Moreover, the cancer cells may metastasize (spread) from the prostate to other parts of the body, particularly the lymph nodes and bones subsequently leading to pain in the back and the bones.
AAH can be difficult to distinguish from hyperplasia.
None of these methods can reliably detect all prostate cancers, particularly the small cancers.
The procedure requires a local anaesthetic, and is associated with frequent complications, e.g. bleeding in the urine, bleeding in the stool, blood in the ejaculate and soreness in the biopsied area afterwards.
However, the lack of detection of hepsin in blood, serum or urine limits its role as a biomarker so far (Parekh et al.
However, the disadvantages of this method are the still unsatisfactory rates for sensitivity and specificity (Kirby et al.
Even though widely used, PSA levels can not alone be a reliable marker for diagnosis of prostate cancer.

Method used


Image

  • Non-invasive method for diagnosis of prostate cancer
  • Non-invasive method for diagnosis of prostate cancer
  • Non-invasive method for diagnosis of prostate cancer

Examples


example 1

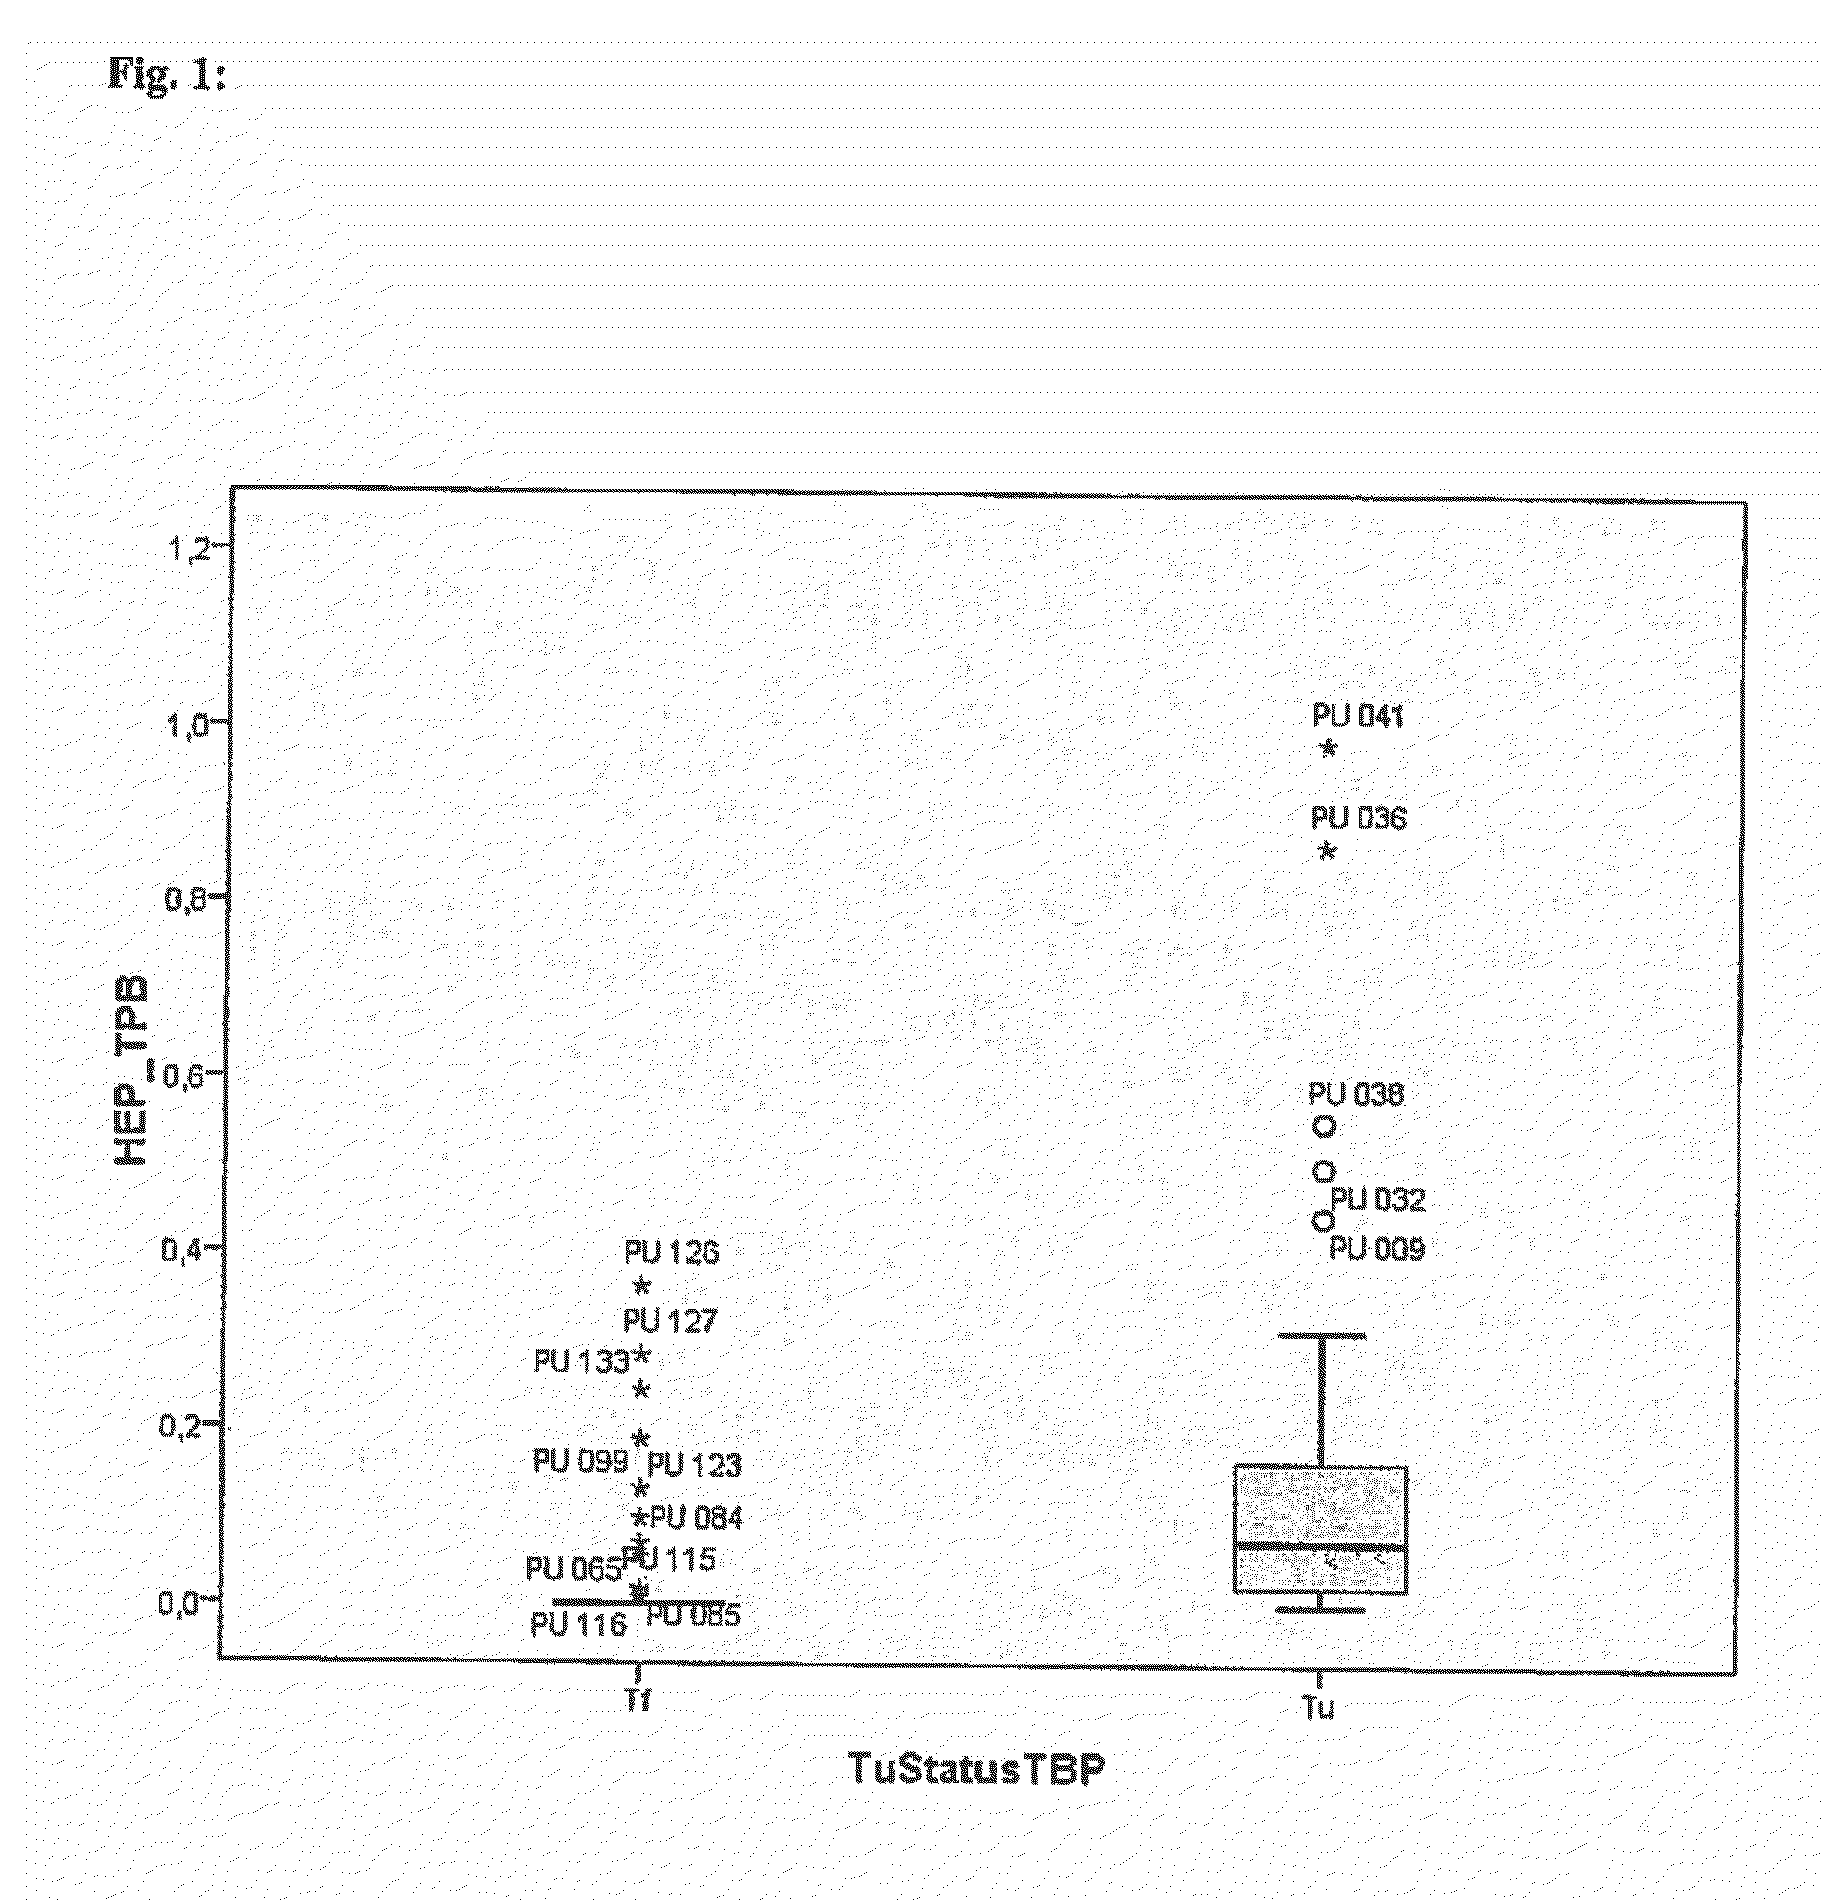
Comparison of the Relative Expression Levels (Average and Median) Between Patients with (Tu) and without (Ti) Prostate Cancer (as Tu / Tf Ratios)

[0067]For each prostate-associated transcript marker (normalized to the reference gene TBP) the values for the averages, medians and standard deviations (SD) as well as the bounds of evidence in the tumor (Tu) group and the tumor-free (Tf) group are given. To reflect the degree of up- or down-regulation of the respective marker in the Tu group, the ratios of the relative expression levels in the urine samples form prostate cancer patients and from patients without evidence of prostate cancer were calculated by division of the average or median levels per group. The Mann-Whitney U-test was used for statistical calculation whether expression levels of the markers are significantly different between the Tu group and the Tf group. Resulted values equal zero are substituted by a value at the bound of evidence.

TABLE 2Comparison of the relative expr...

example 2

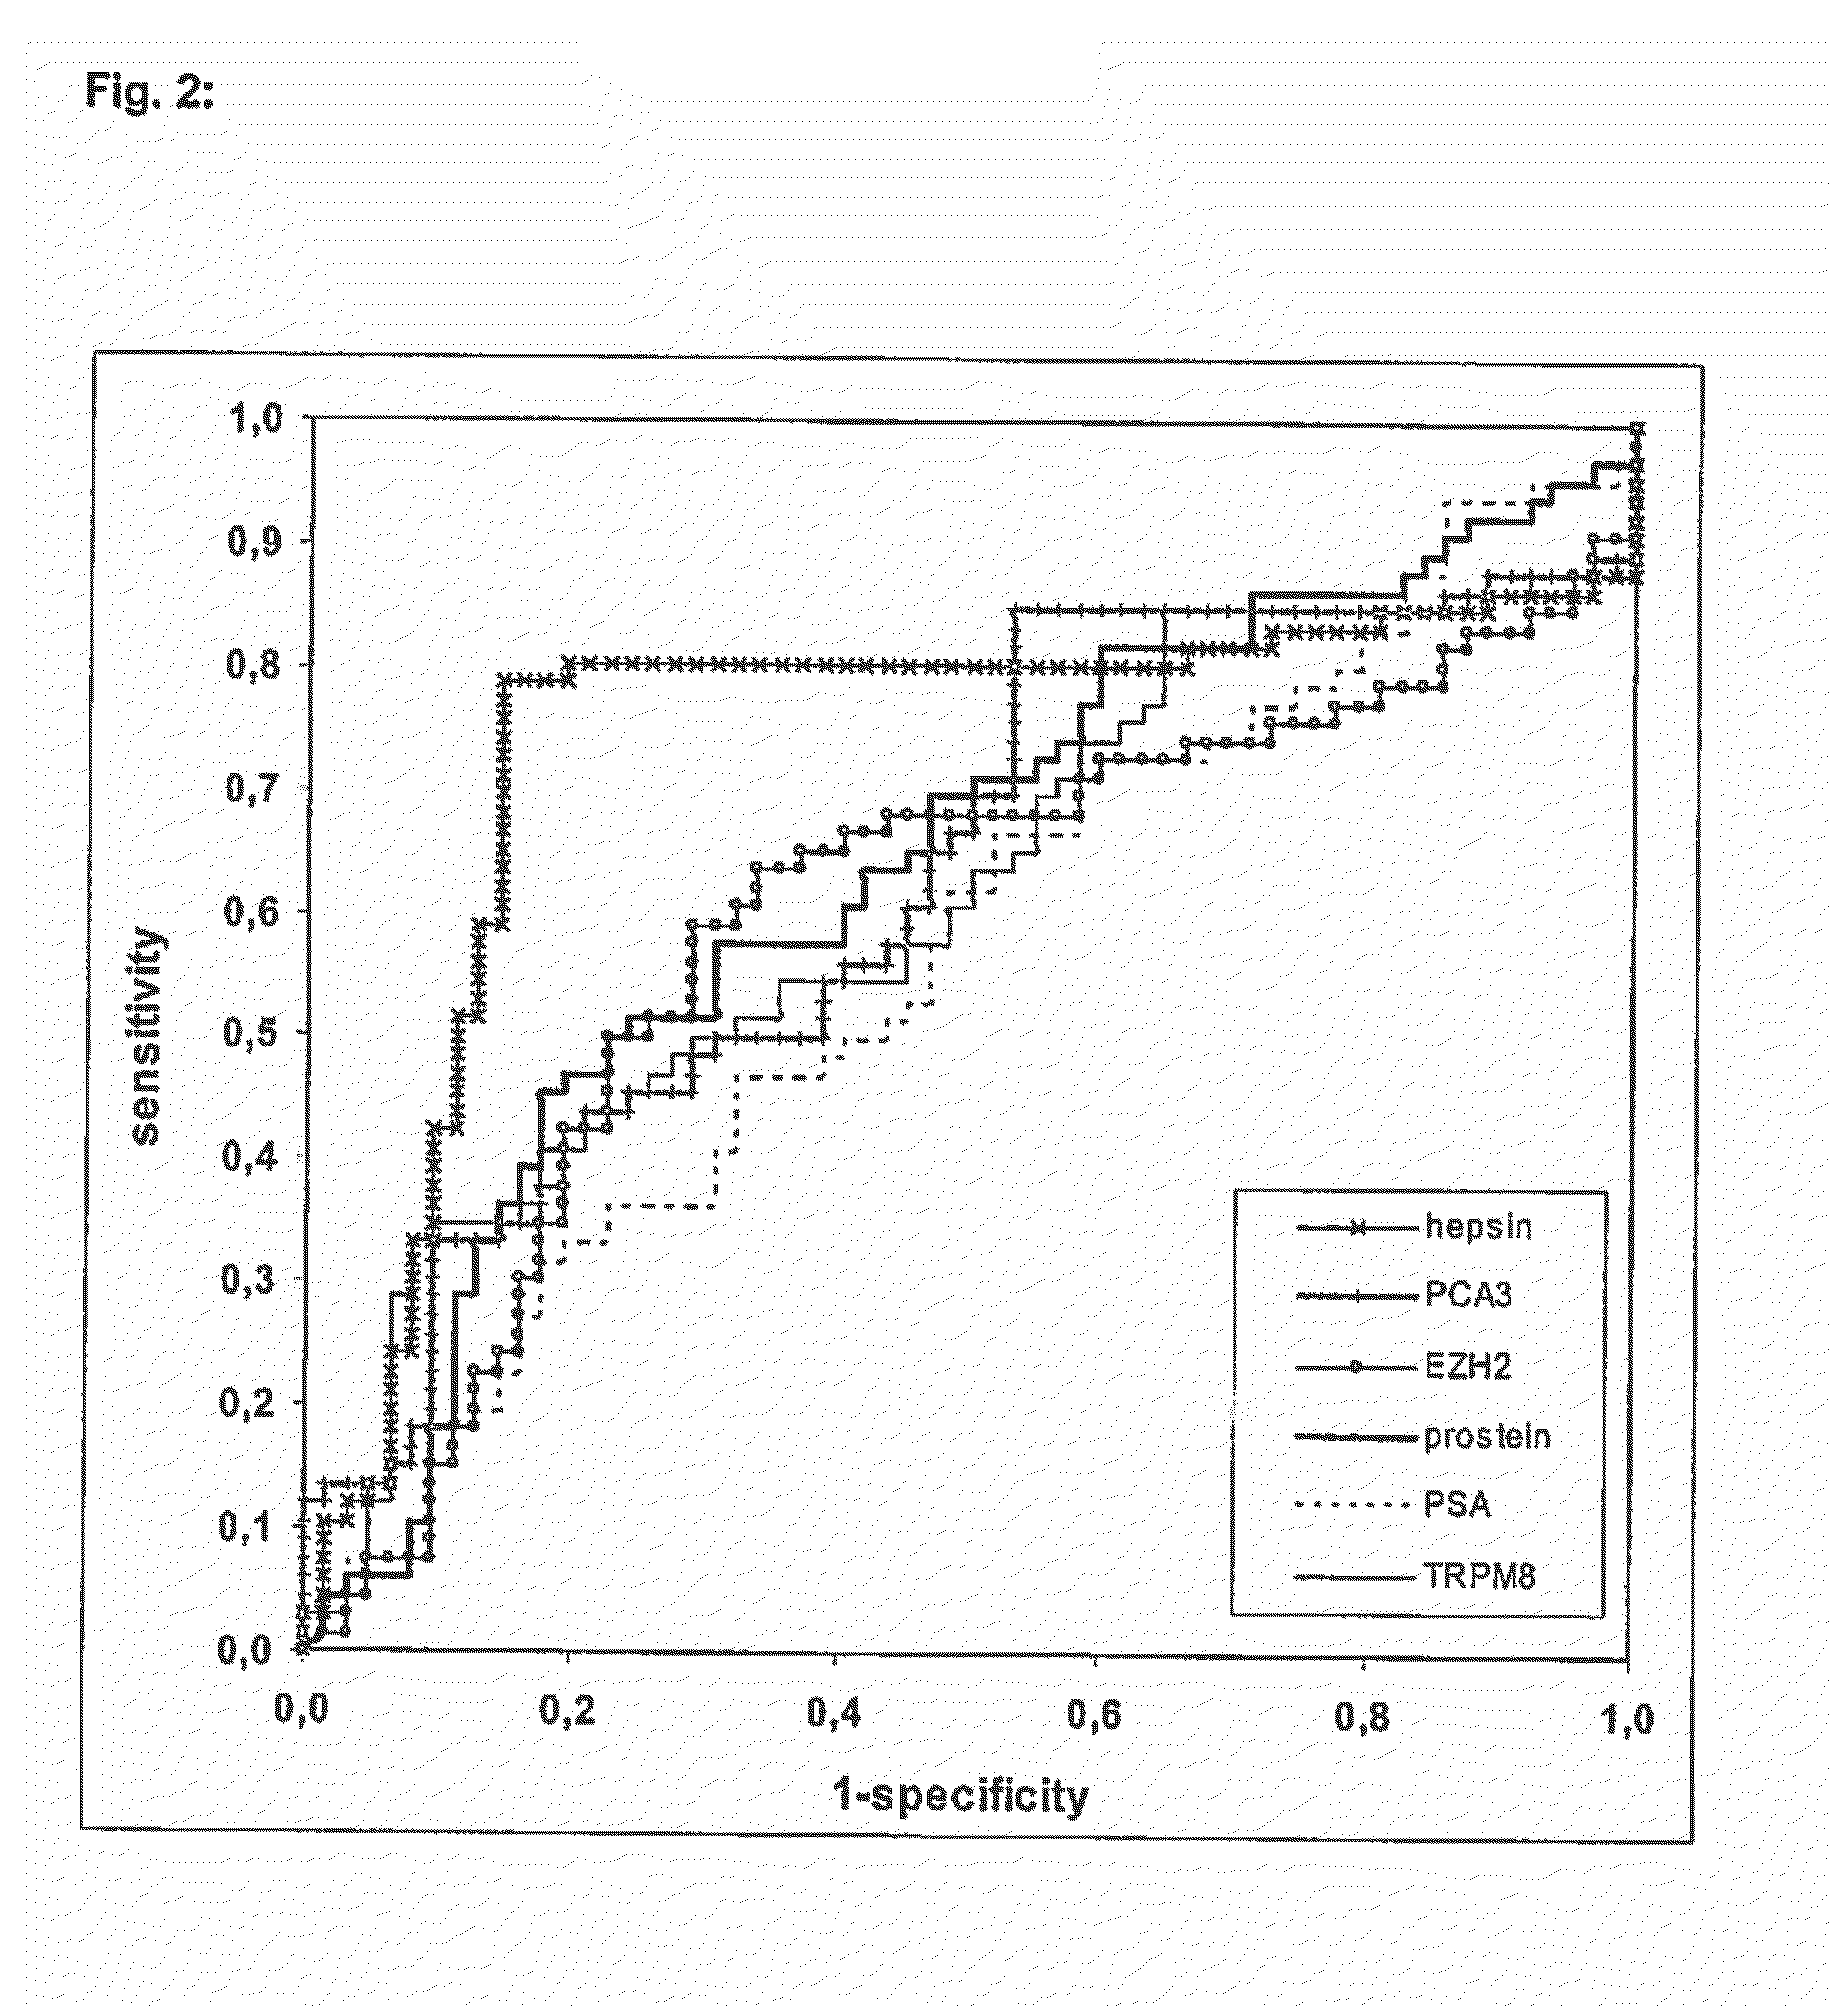
Thresholds for the Relative Expression Levels of Different Marker Genes Normalized to TBP and Predictive Values for Exemplified Pre-Test Probabilities, Likelihood Ratios and AUC Values

[0069]Table 3 gives the regression coefficients and their statistical characteristics for the logistic model which predicts the probability of tumor, and an example for the calculation for an exemplary patient.

TABLE 3Final logistic regression model using four genes, and computation of certainty ofdiagnosis for a exemplary patientexemplarycontribution toRegressionstandardvalue ofthe logitVariablecoefficienterrorp-valuea patientof the patientIntercept2.82792.19060.19672.8279(PCA 3 / TBP)1 / 33.07260.87110.00040.2453.0726 * 0.2451 / 3 =1.9226(EZH2 / TBP)1 / 2−3.74181.08560.00062.047−3.7418 * 2.0471 / 2 = −5.3535(EZH2 / TBP)3 * 10−37.33172.41660.00247.3317 * 2.0473 * 10−3 =0.0629(EZH2 / TBP)−1 / 3−1.13070.58490.0532−1.1307 * 2.047−1 / 3 = −0.8905(prostein / TBP)−1 / 32.26380.70260.00131.1082.2638 * 1.108−1 / 3 =2.1877(prostein / TBP)...

example 3

Thresholds for the Relative Expression Levels of Different Marker Genes Normalized to TBP and Predictive Values for Exemplified Pre-Test Probabilities, Likelihood Ratios and AUC Values

[0070]The given thresholds in Table 4 are selected for maximal LR+ in the data of the diagnostic study. The positive predictive values (ppv) gives the certainty of diagnosis “tumor” in the ease of test positive result, and the negative predictive value (npv) gives the certainty of diagnosis “no tumor” in the case of test negative result for 3 different pretest values corresponding to 3 different case mixes in the clinical situation. LR+ is the factor for the increase of the pretest odds for the diagnosis “tumor” in the case of a test positive result, and LR− is the inverse of the factor for the increase of the pretest odds for the diagnosis “no tumor” in the case of a test negative result. The AUC of the ROC estimates the rate of right diagnoses independently of the threshold for the test positive meas...


PUM

PropertyMeasurementUnit
Fractionaaaaaaaaaa
Fractionaaaaaaaaaa
Fractionaaaaaaaaaa

Abstract

The present invention relates on a non-invasive method for diagnosing prostate cancer and / or assessing the risk of a subject acquiring prostate cancer comprising the analysis of the expression of the marker gene hepsin in an urine sample. It further relates on a non-invasive method for diagnosing prostate cancer and / or assessing the risk of a subject acquiring prostate cancer by determining the expression levels of the marker genes hepsin, EZH2, prostein and PCA3.

Description

FIELD OF THE INVENTION[0001]Subject of the present invention is a non-invasive method for diagnosis of prostate cancer or the assessment of the risk of a subject to acquire prostate cancer. Particularly by determining the presence of at least hepsin in urine samples.BACKGROUND OF THE INVENTION[0002]Prostate cancer is a form of cancer that develops in the prostate. Prostate cancer may cause difficulties in urinating, pain, problems during sexual intercourse, or erectile dysfunction. Moreover, the cancer cells may metastasize (spread) from the prostate to other parts of the body, particularly the lymph nodes and bones subsequently leading to pain in the back and the bones. Prostate cancer tends to develop in men over the age of fifty and it is one of the most prevalent types of cancer in men. Development of prostate cancer is influenced by many factors, including genetics and diet.[0003]Atypical adenomatous hyperplasia (AAH) is a term that has been utilized to describe changes histolo...

Claims


Application Information

Patent Timeline
IPC IPC(8): C12Q1/68C40B30/04
CPCC12Q2600/158C12Q1/6886
Inventor WIRTH, MANFREDFUESSEL, SUSANNEKOCH, RAINER
Owner DRESDEN UNIVERSITY OF TECHNOLOGY
Learn More