
Real Time Pump Monitoring

a real-time pump and monitoring technology, applied in the field of pumps, can solve the problems of unscheduled shutdown of wellbore service, increased probability of unscheduled shutdown, and catastrophic failur

Inactive Publication Date: 2010-12-02
HALLIBURTON ENERGY SERVICES INC
View PDF20 Cites 190 Cited by
  • Summary
  • Abstract
  • Description
  • Claims
  • Application Information

AI Technical Summary

Problems solved by technology

Faults that go undetected during a regular maintenance check-up may lead to catastrophic failure and unscheduled shutdown of the wellbore service.
The probability of an unscheduled shutdown increases as the time period between successive maintenance inspections increases.
The frequency of performing maintenance, however, is limited by availability of man-power and financial resources and hence is not easily increased.
The lost production time may cost many times more than the labor cost involved.
There is also a possibility that the reassembled machine may fail due to an assembly error or high start up stresses for example.
Finally, periodically replacing components (via routine preventive maintenance) such as bearings, seals, or valves is costly since the service life of good components may unnecessarily be cut short.
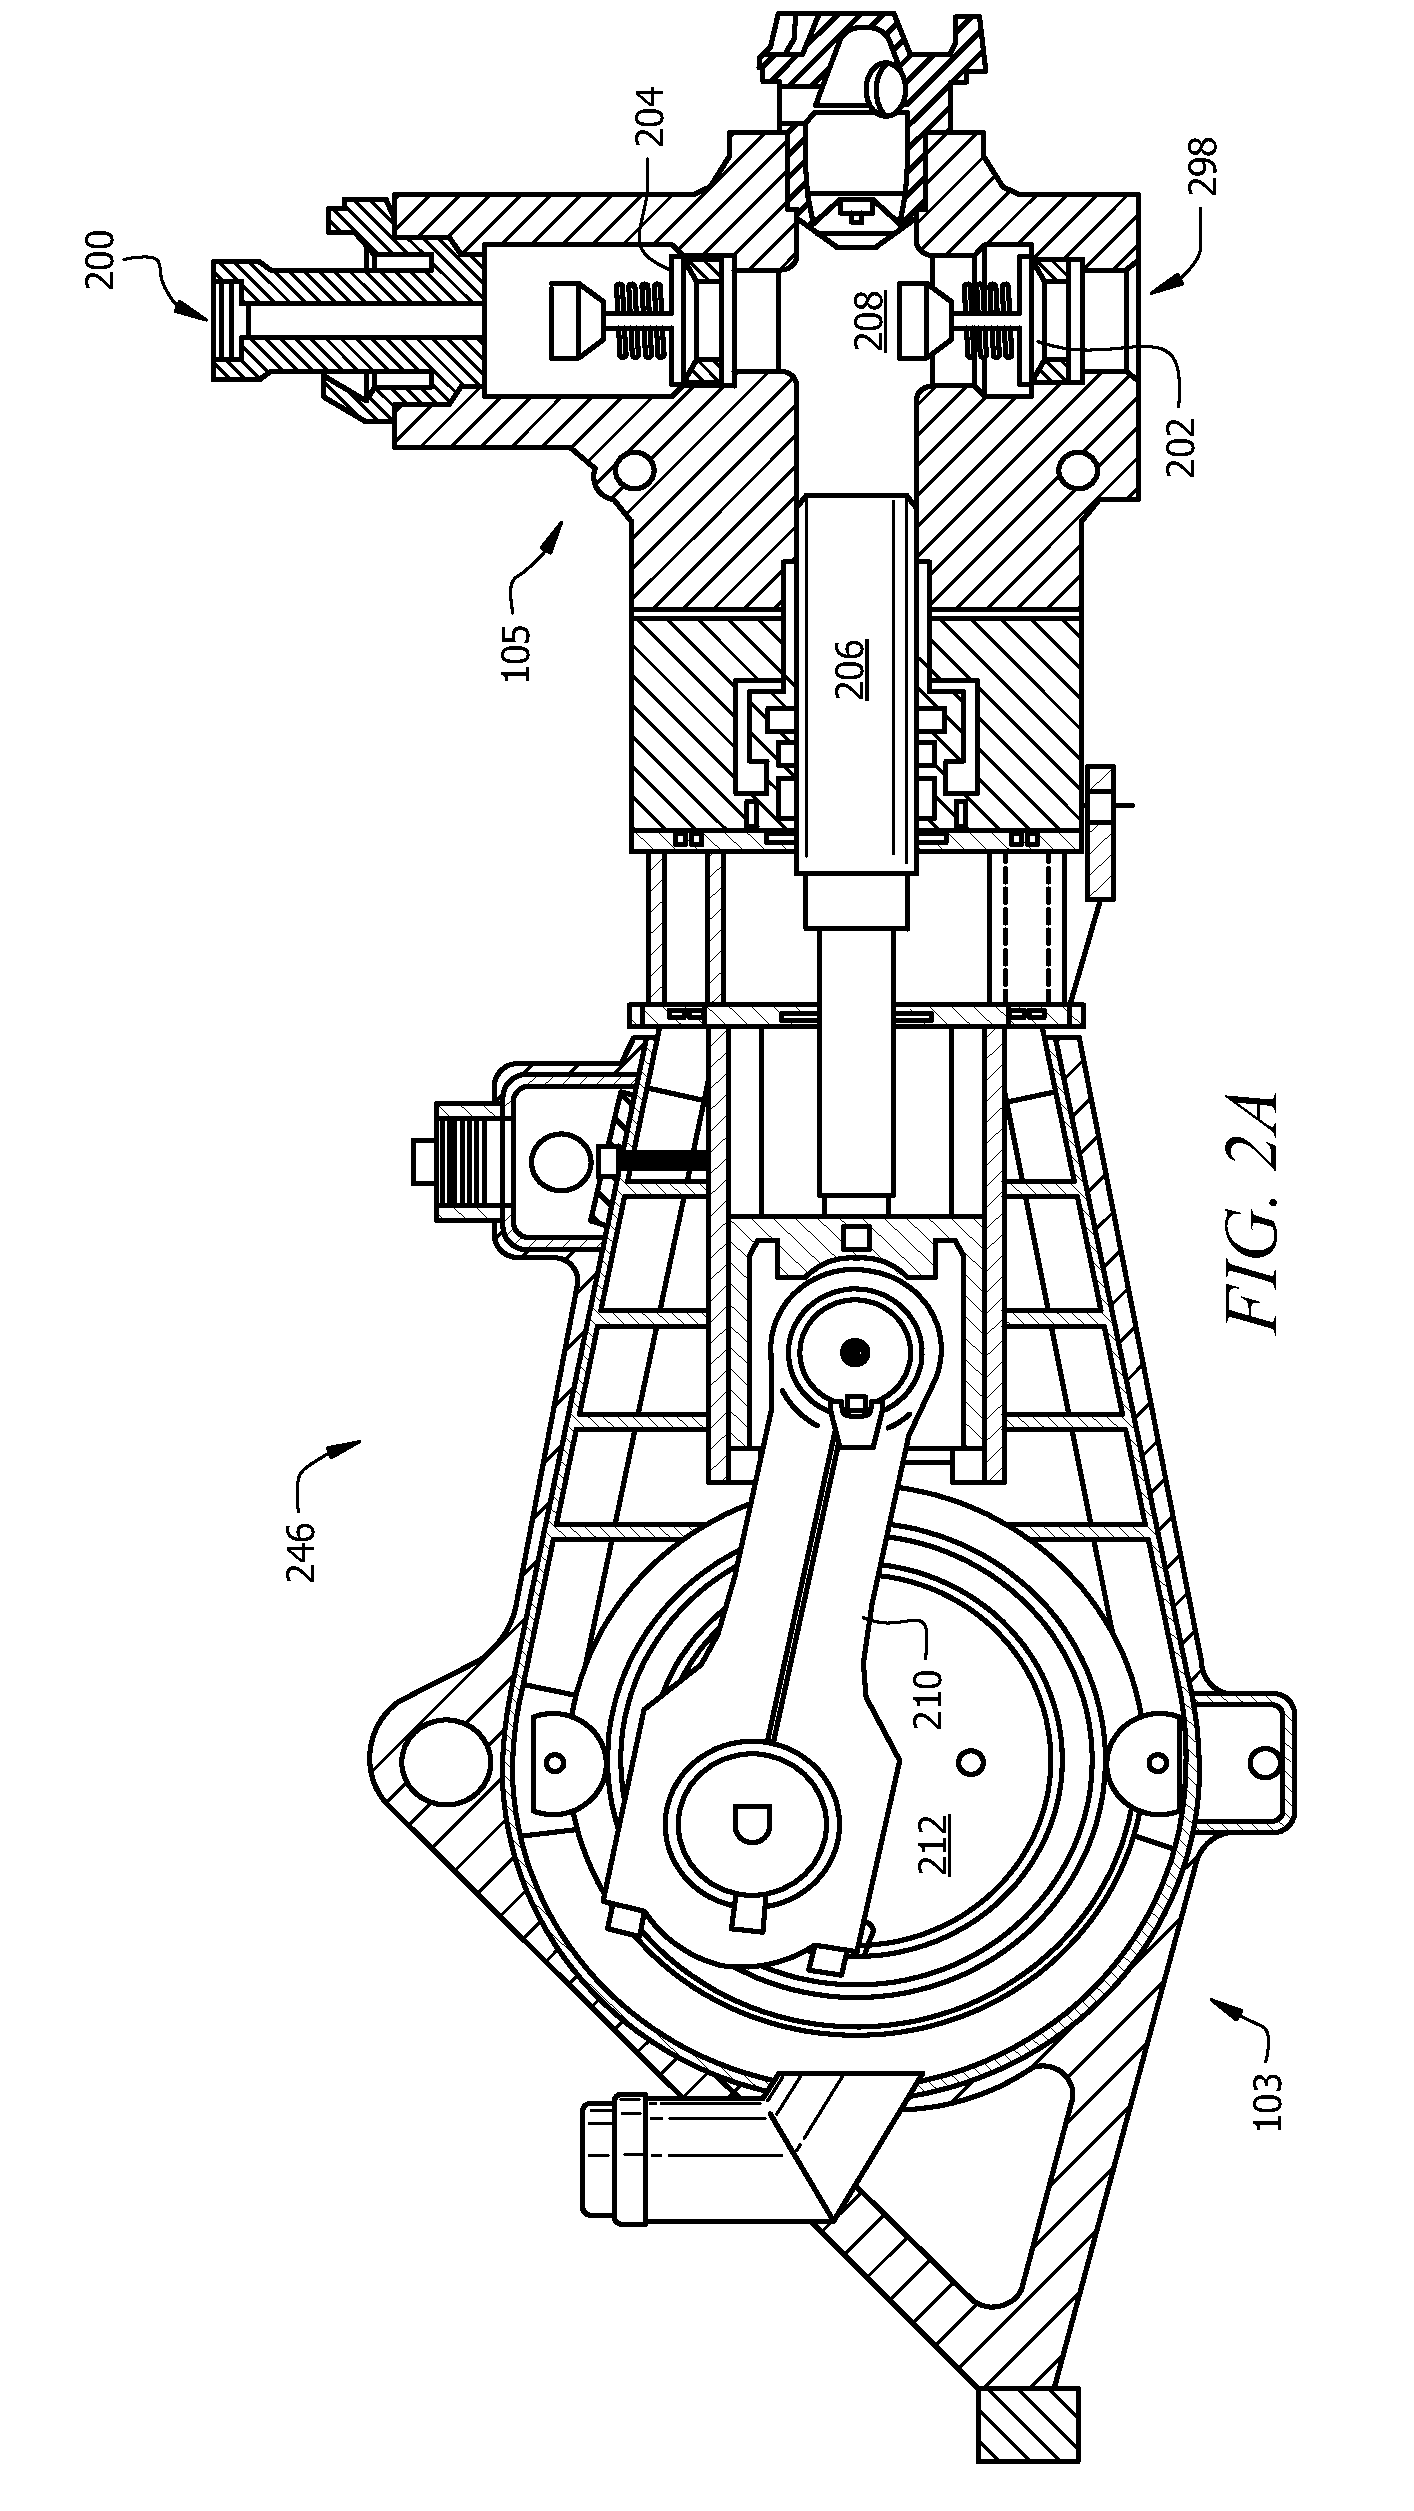
Cavitation, leakage and valve damage are common problems / faults encountered with pumps.
In particular, cavitation can cause accelerated wear and mechanical damage to pump components, couplings, gear trains, and drive motors.
These vapor bubbles collapse or implode when they enter a high pressure zone (e.g., at the discharge valve during the discharge / power stroke) of the pump causing erosion of and / or damage to pump components.
If a pump runs for an extended period under cavitation conditions, permanent damage may occur to the pump structure and accelerated wear and deterioration of pump internal surfaces and seals may occur.
Depending on the type of pump, other problems can occur such as inlet or outlet blockage, leakage of air into the system due to faulty pump seals or valves, leaky or damaged valves, internal parts impacting the pump casing, etc.

Method used


Image

  • Real Time Pump Monitoring
  • Real Time Pump Monitoring
  • Real Time Pump Monitoring

Examples


example 1

Cavitation

[0051]While operating the pump in gears 3-6 as set forth in Table 1, data was collected from the knock sensor and plotted in FIGS. 8-11, respectively. The strip charts (i.e., the lower plots so labeled) in FIGS. 8-11 represent a plot of RMS g's over a test period of time for operation in gears 3-6, respectively. Within the test period for a given gear, power spectrum analysis (as represented by the upper plots so labeled in FIGS. 8-11) was performed via FFT at various time intervals and plotted as RMS g's as a function of frequency from 0 to 5000 Hz. During the test period, pump speed was increased for each gear and cavitation was induced in the pump by restricting fluid flow to the pump by partially closing a valve in the suction side flow line to the pump.

[0052]Referring to FIG. 8, the pump was operated for a test period of about 150 seconds in gear 3. From about 0 to about 47 seconds of the test period, the pump was operating in gear 3 at lower rpms (e.g., about 100 rpm...

example 2

Leaky Suction Valve

[0062]Valve leakage was reproduced by placing a known leaky suction valve in one of the chambers of the three chamber pump. While operating the pump in gears 3-6 as set forth in Table 1, data was collected from the knock sensor and plotted in FIGS. 12-15, respectively. The strip charts in FIGS. 12-15 represent a plot of RMS g's over a test period of time for operation in gears 3-6, respectively. Within the test period for a given gear, power spectrum analysis (as represented by the upper plots so labeled in FIGS. 12-15) was performed via FFT at various time intervals and plotted as RMS g's as a function of frequency from 0 to 5000 Hz.

[0063]Referring to FIG. 12, the pump was operated for a test period of about 60 seconds in gear 3 at about 150 rpm. The strip chart of FIG. 12 shows g's ranging from about 3 to about 5 (alternatively, from about 3.5 to about 4.5 g's, alternatively equal to or greater than about 4 g's) during this period, which may be associated with t...


PUM


Abstract

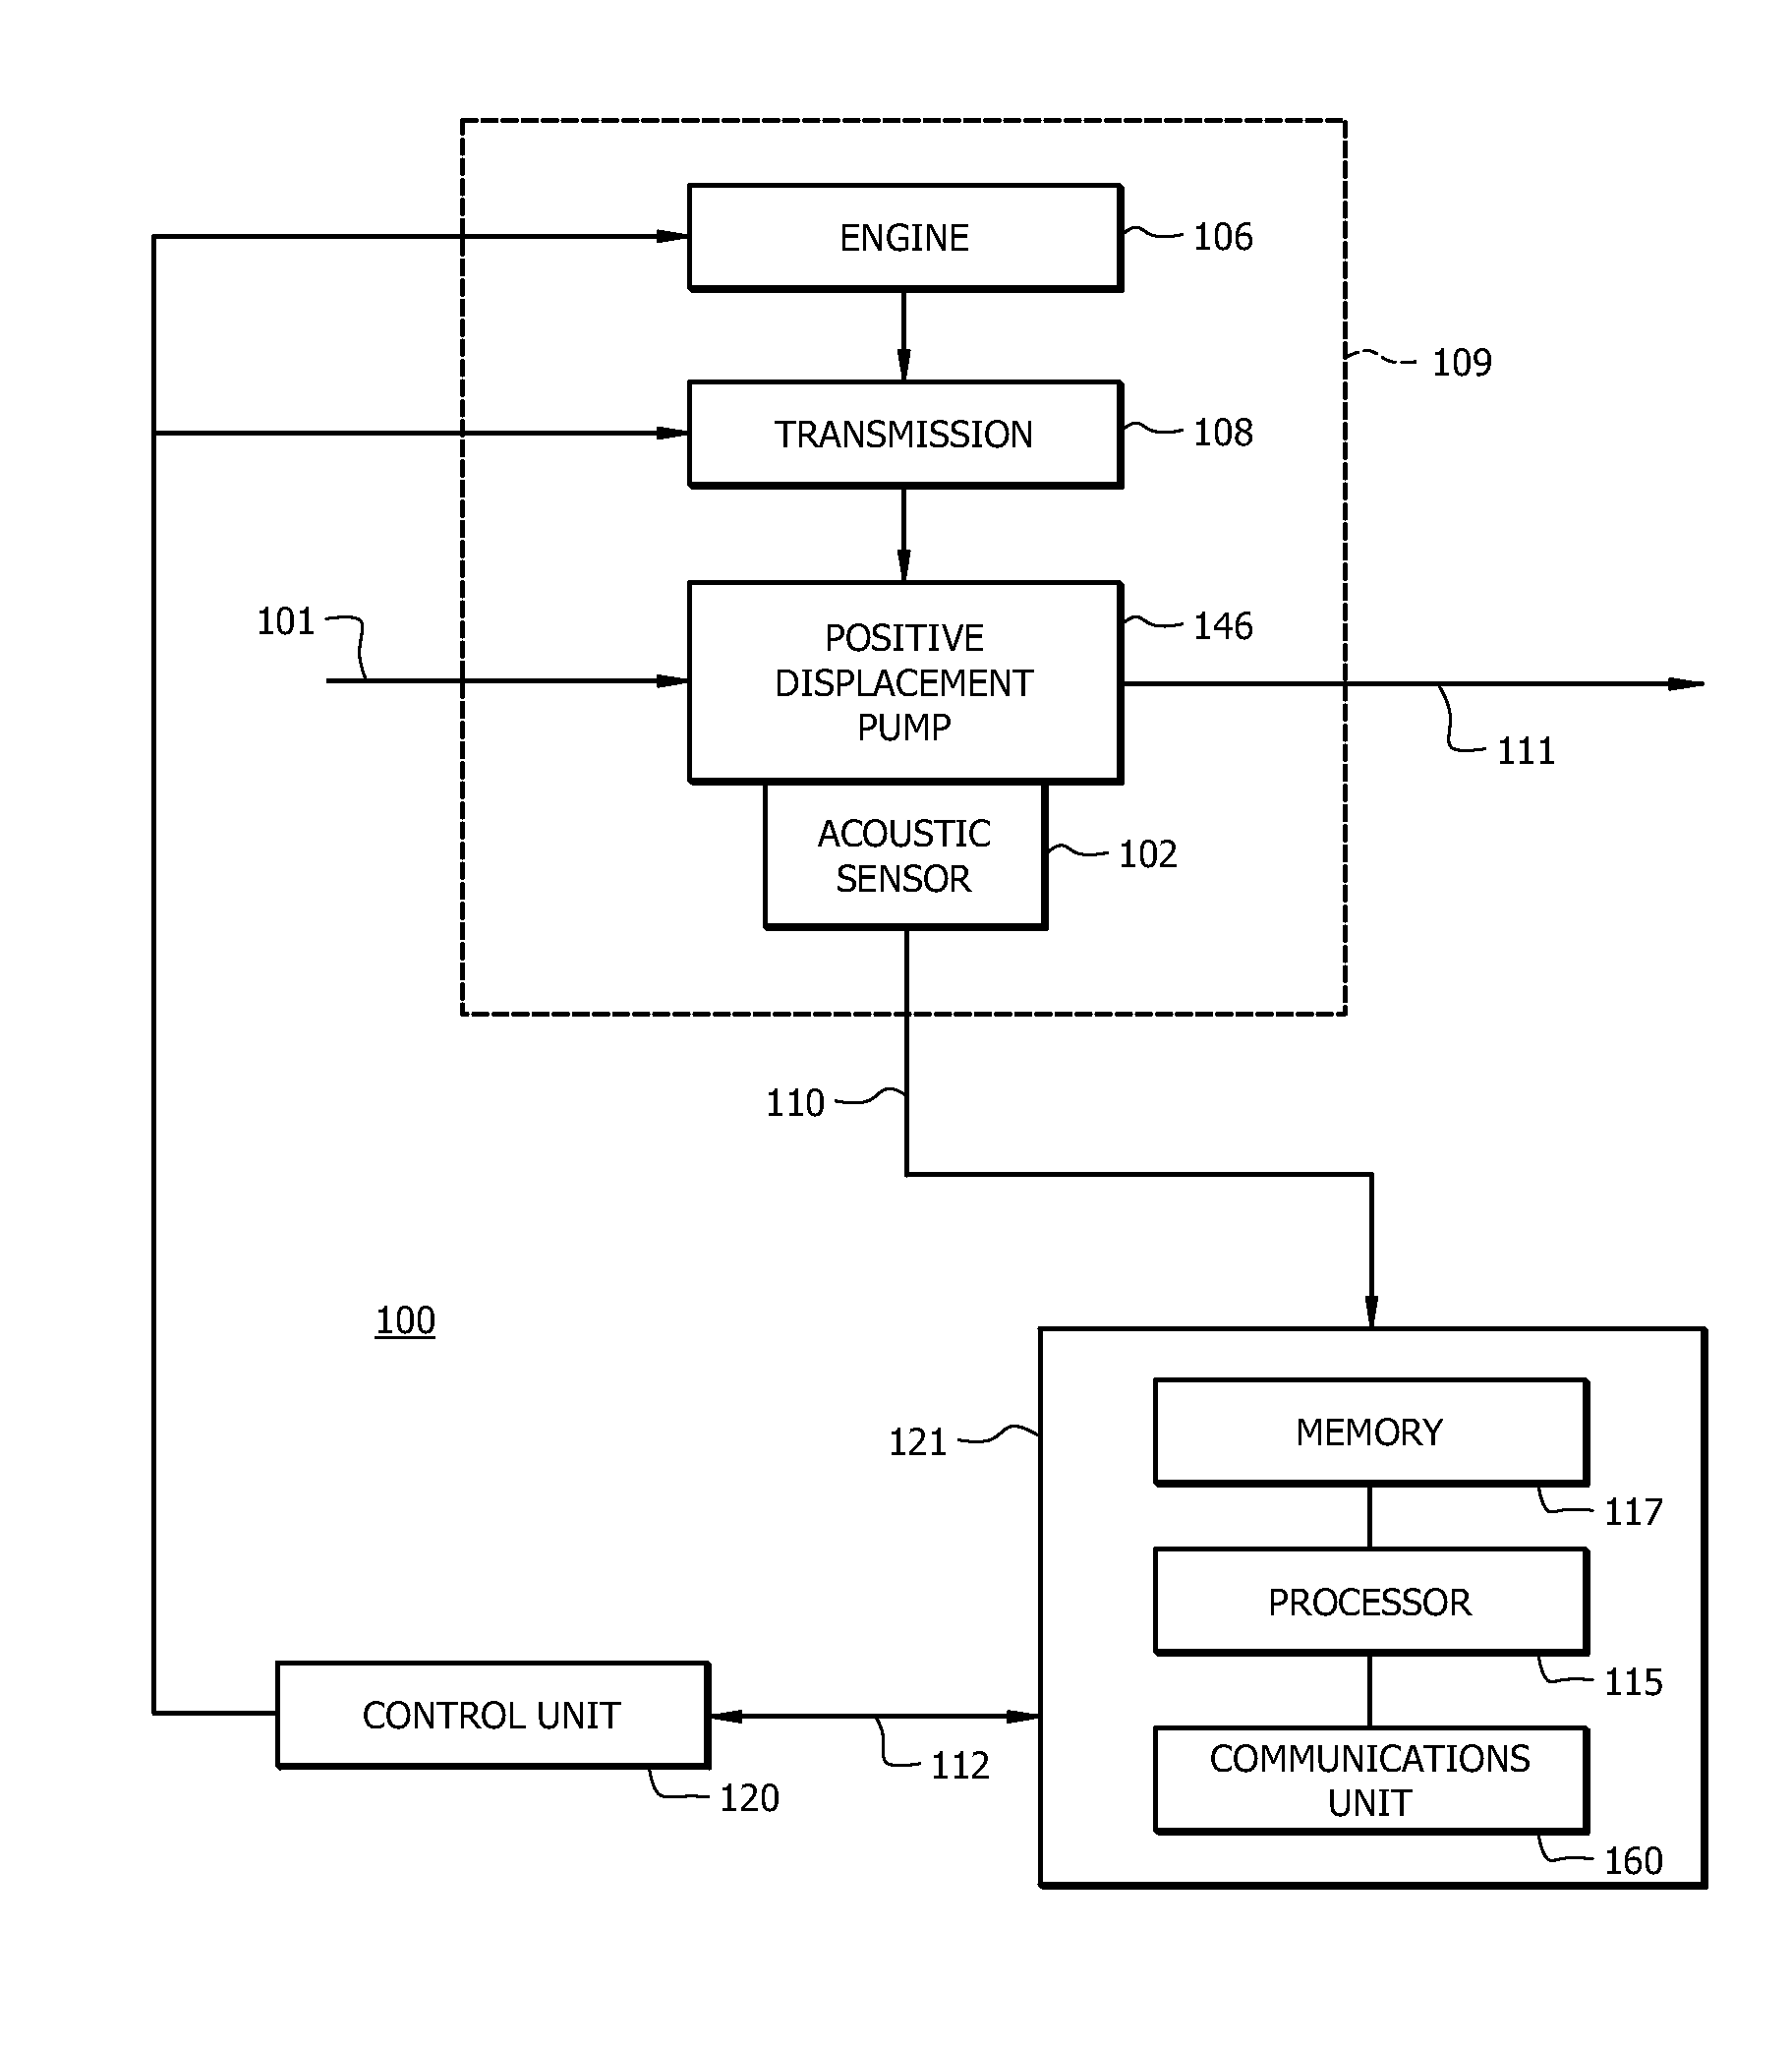
A system and method for monitoring operation of a pump are disclosed herein. The methods and systems make use of acoustic sensors to collect and analyze data in order to detect cavitation. The disclosed methods and systems may also be used to detect valve damage. The pump may be a positive displacement pump that is employed in a wellbore servicing operation such as pumping a wellbore servicing fluid into a wellbore.

Description

CROSS-REFERENCE TO RELATED APPLICATIONS[0001]Not applicable.BACKGROUND[0002]1. Field of the Invention[0003]This invention relates generally to the field of pumps and improved systems and methods for monitoring and detecting potential problems or faults in pumps. More specifically, the invention relates to methods and systems for real time sensing of cavitation and / or valve leakage in pumps, for example positive displacement pumps used in wellbore servicing operations.[0004]2. Background of the Invention[0005]Wellbore servicing systems and equipment may include a variety of pumps, which require maintenance over time. With conventional maintenance strategies such as exception-based and periodic checking, faults developed in pumps have to be detected by human experts through physical examination and other off-line tests (e.g., metal wear analysis) during a routine maintenance in order for corrective action to be taken. Faults that go undetected during a regular maintenance check-up may...

Claims


Application Information

Patent Timeline
IPC IPC(8): E21B47/00E21B43/00
CPCE21B47/0007E21B21/06E21B47/008
Inventor LOOPER, DAVID W.TALIAFERRO, CHRIS N.STRIBLING, DAVID M.STEPHENSON, STANLEY V.
Owner HALLIBURTON ENERGY SERVICES INC
Learn More