Eureka AIR delivers breakthrough ideas for toughest innovation challenges, trusted by R&D personnel around the world.

Iterative Reservoir Surveillance

a technology of reservoirs and monitoring systems, applied in the field of oil and gas production, can solve the problems of limited ability to spatially represent geologic and engineering production data in 3d, lack of ability to interact with 2d plots, long production life, etc., and achieve the effect of reducing differences

Active Publication Date: 2010-08-19
EXXONMOBIL UPSTREAM RES CO
View PDF6 Cites 87 Cited by
  • Summary
  • Abstract
  • Description
  • Claims
  • Application Information

AI Technical Summary

Benefits of technology

The patent describes a method for making production forecasts for oil and gas reservoirs in a field. The method involves developing a three-dimensional earth model of the field, based on physical data and measured data. A geologic model is then developed, which is a cellular-based representation of the reservoir, assigning values to properties such as pore space, fluid types, and amounts in place. A reservoir simulator is then developed, which can predict production rates. Simulated historical production data is obtained and compared with actual production data. The earth model is then adjusted to reduce any differences between the simulated and actual data. This process is repeated until the differences are within a tolerance level. The adjusted earth model is then used to make production forecasts for the field. The technical effect of this method is to improve the accuracy of production forecasts, which can help optimize oil and gas production.

Problems solved by technology

Only limited capabilities are available to spatially represent geologic and engineering production data in 3D space.
Nor is there capability to interact with the 2D plots to animate the temporal component of the production data.
This is particularly problematic for large fields, with many wells and a long production life.
As a result, identifying anomalous well and reservoir performance is time and labor intensive.
Although all of the data may be available to do an analysis, identifying root causes of production problems usually requires significant manipulation and parsing of the data and comparing multiple static plots.
Integration of scales is difficult and for each scale analyzed, the geoscientist or engineer typically uses a different set of data for the analysis.
Hence, the impact of issues that are identified at one scale may not be readily identified at other scales.
The reservoir simulation model data would be useful to include in the analysis, but often, the well based model data and especially the cell based model data can not be easily integrated into the analysis.
Finally, dynamic representation of the 3D spatial component of the production data is not possible.
Nor is the ability to animate the production data through time concurrently in 3D space and in 2D plots.

Method used


Image

  • Iterative Reservoir Surveillance
  • Iterative Reservoir Surveillance
  • Iterative Reservoir Surveillance

Examples


example

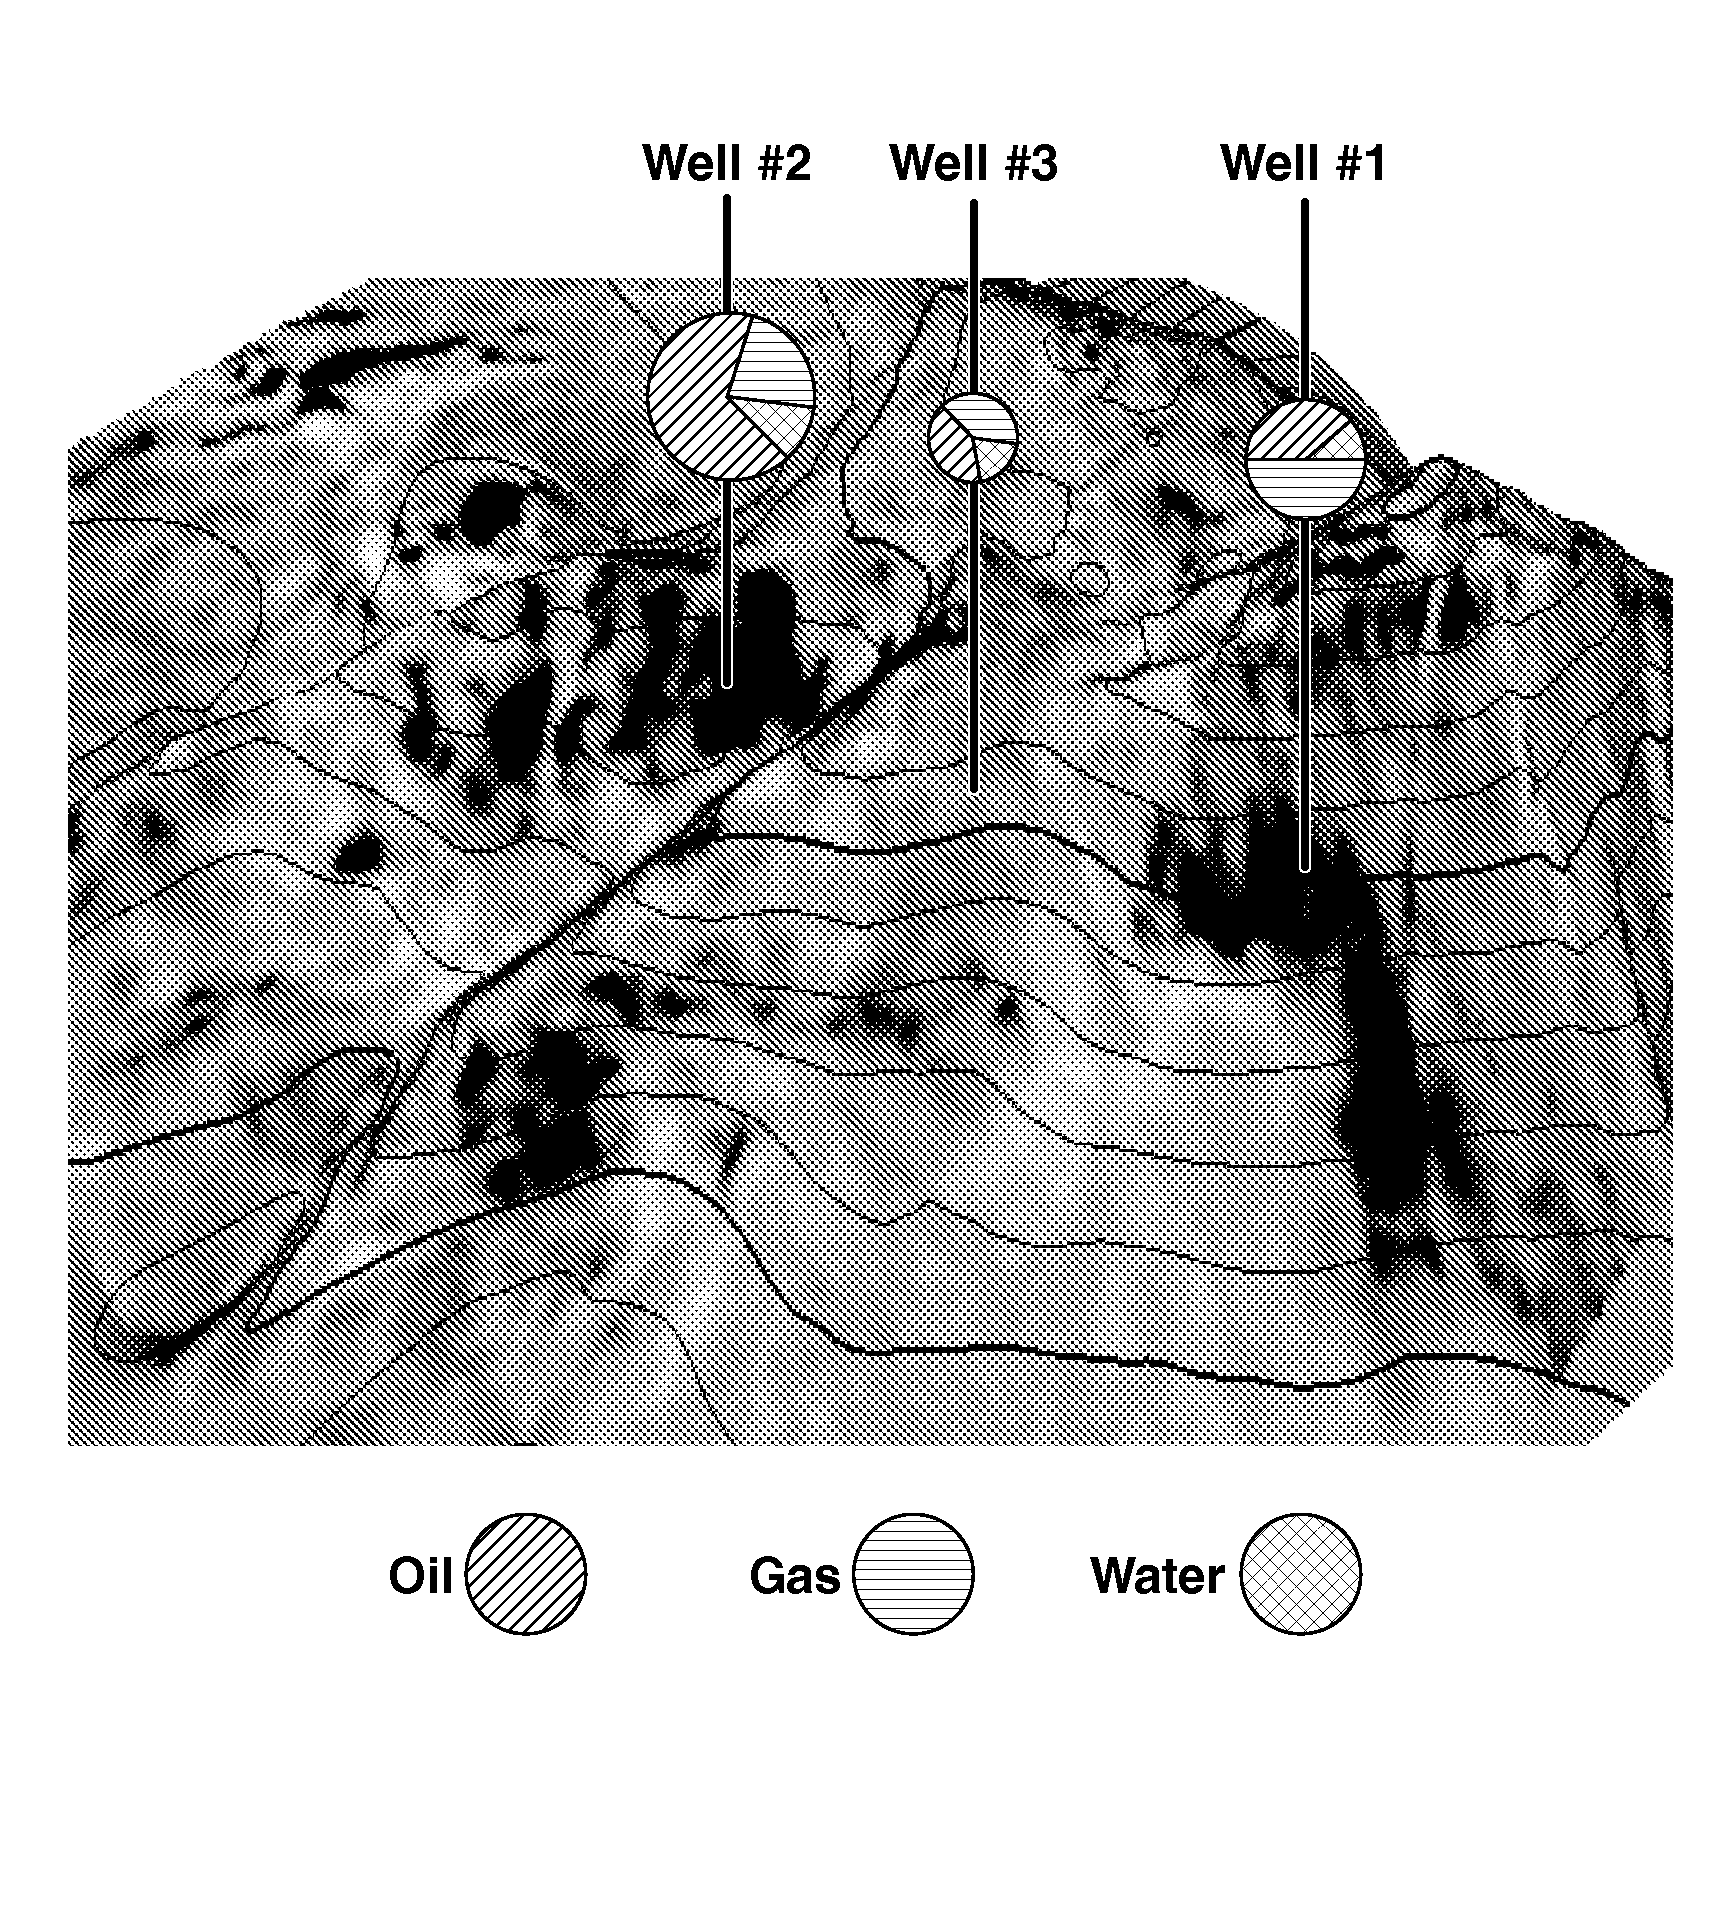
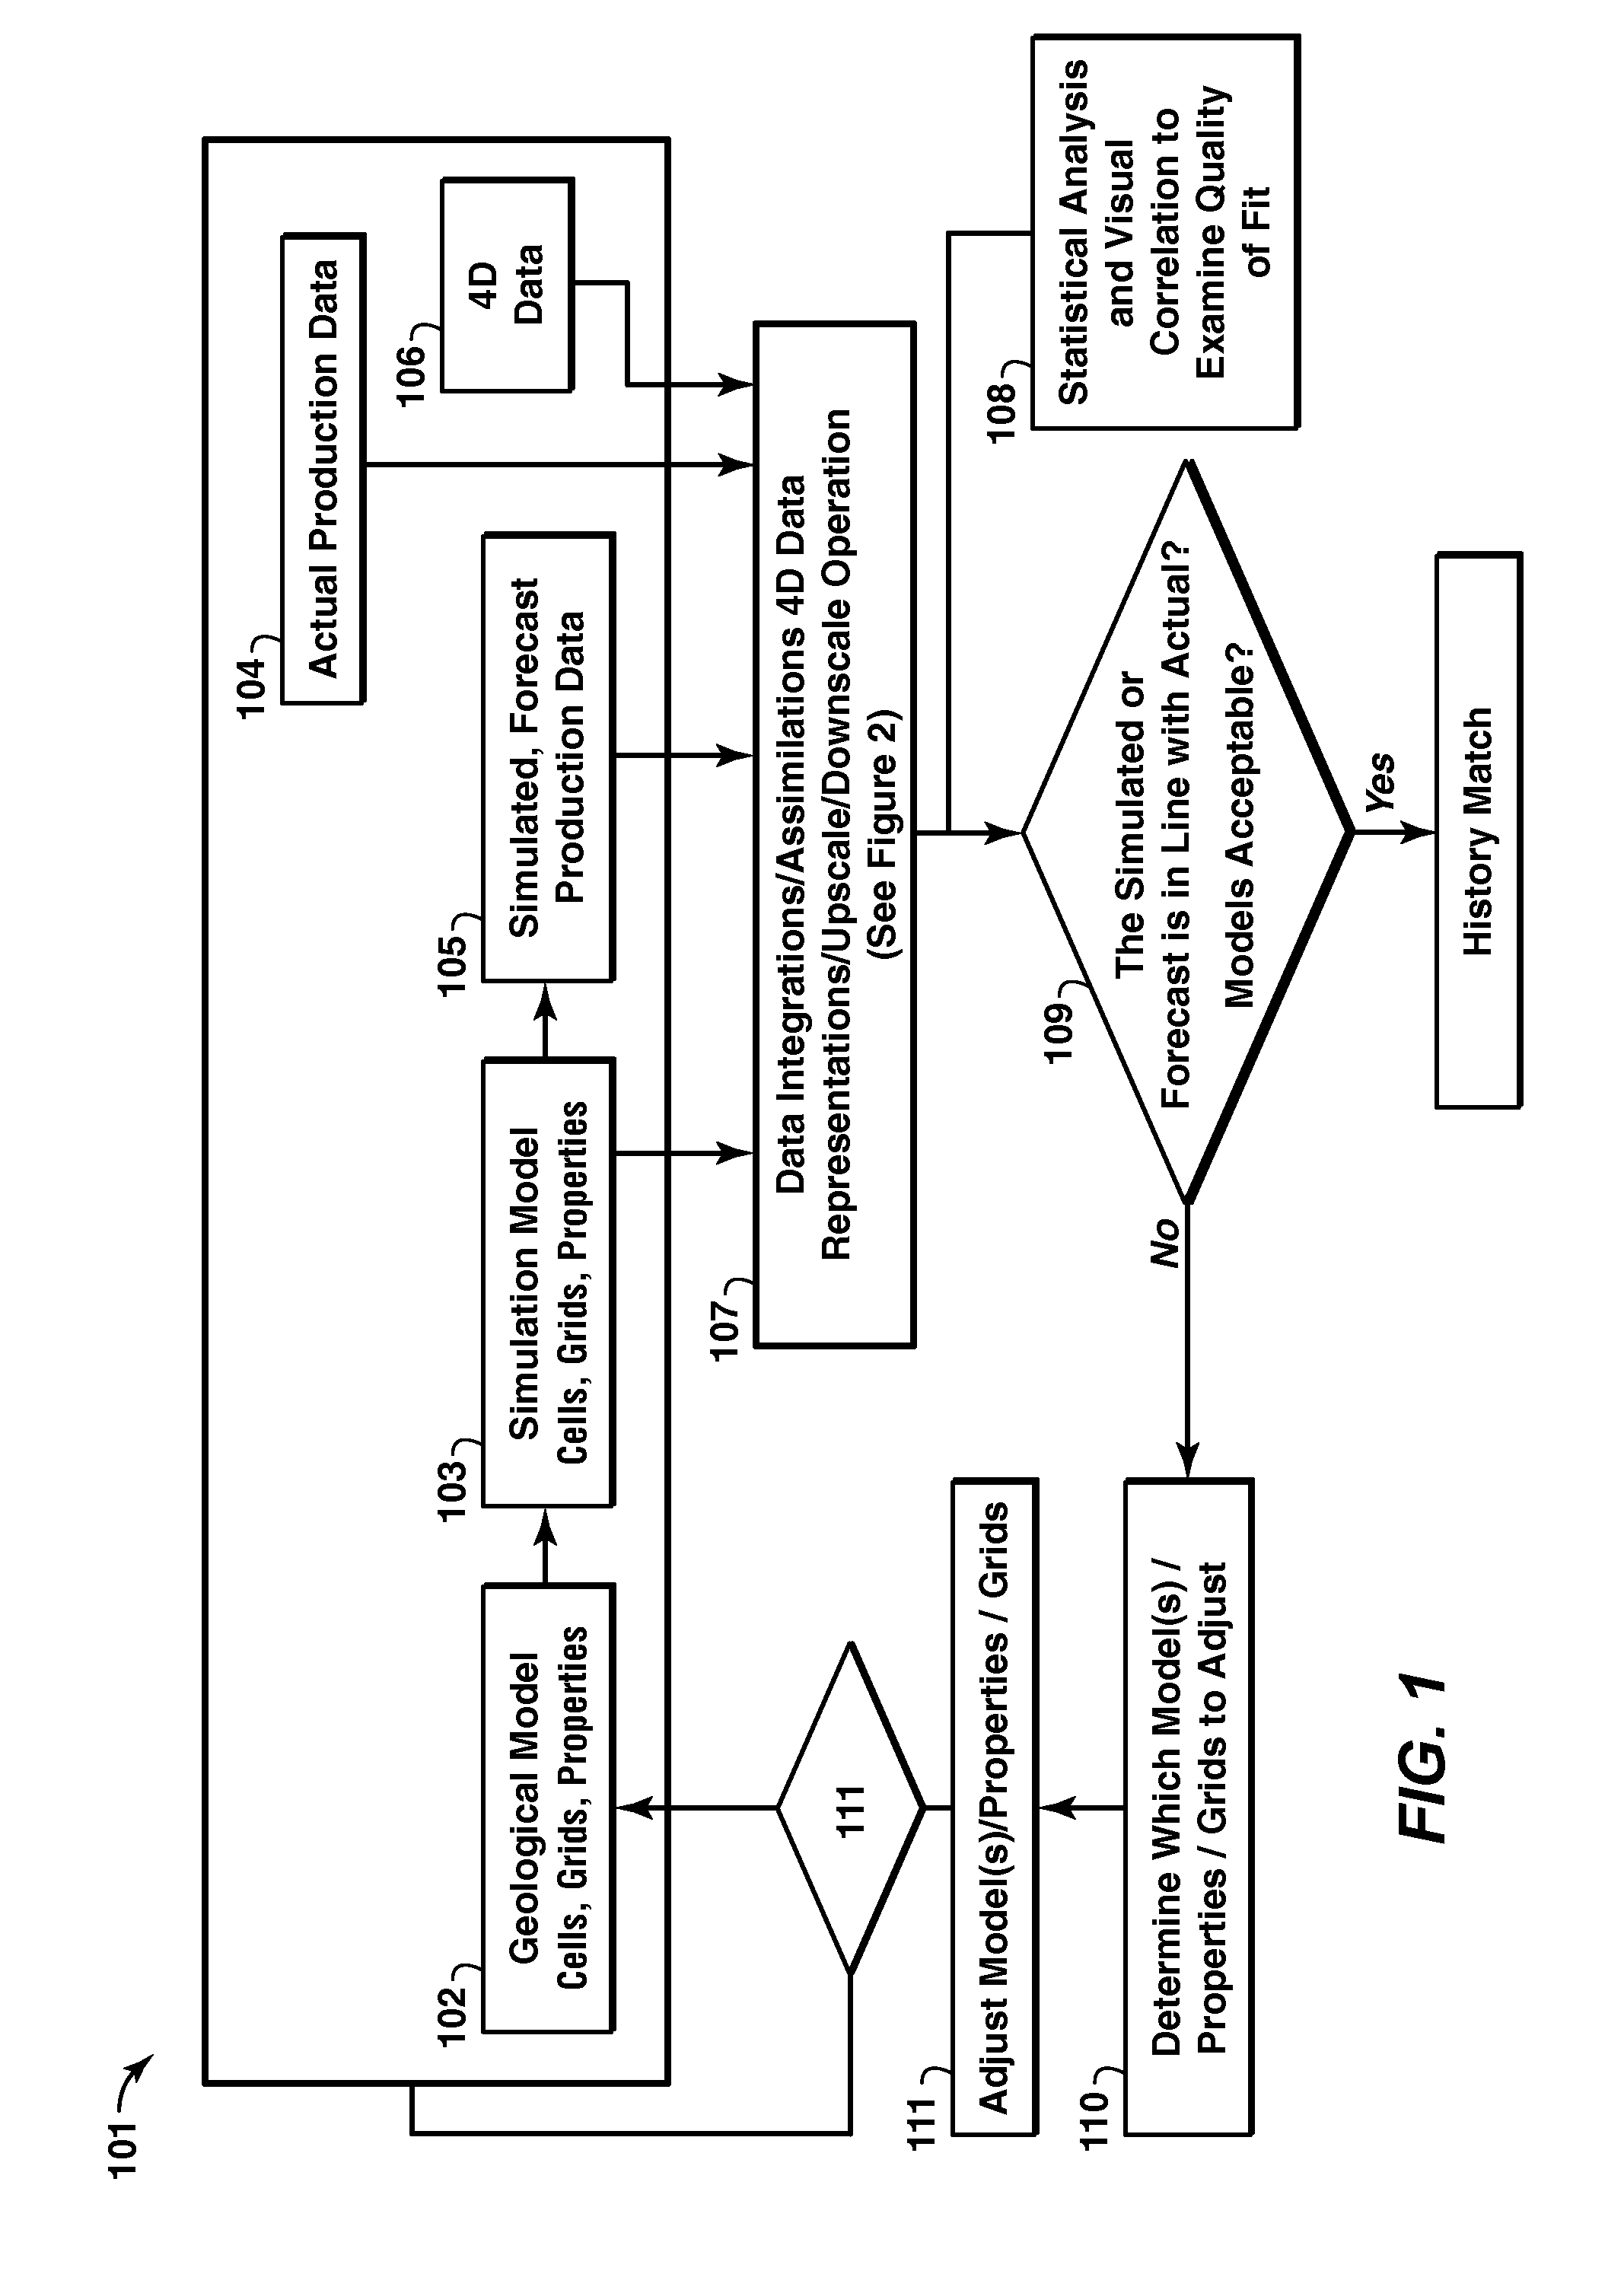
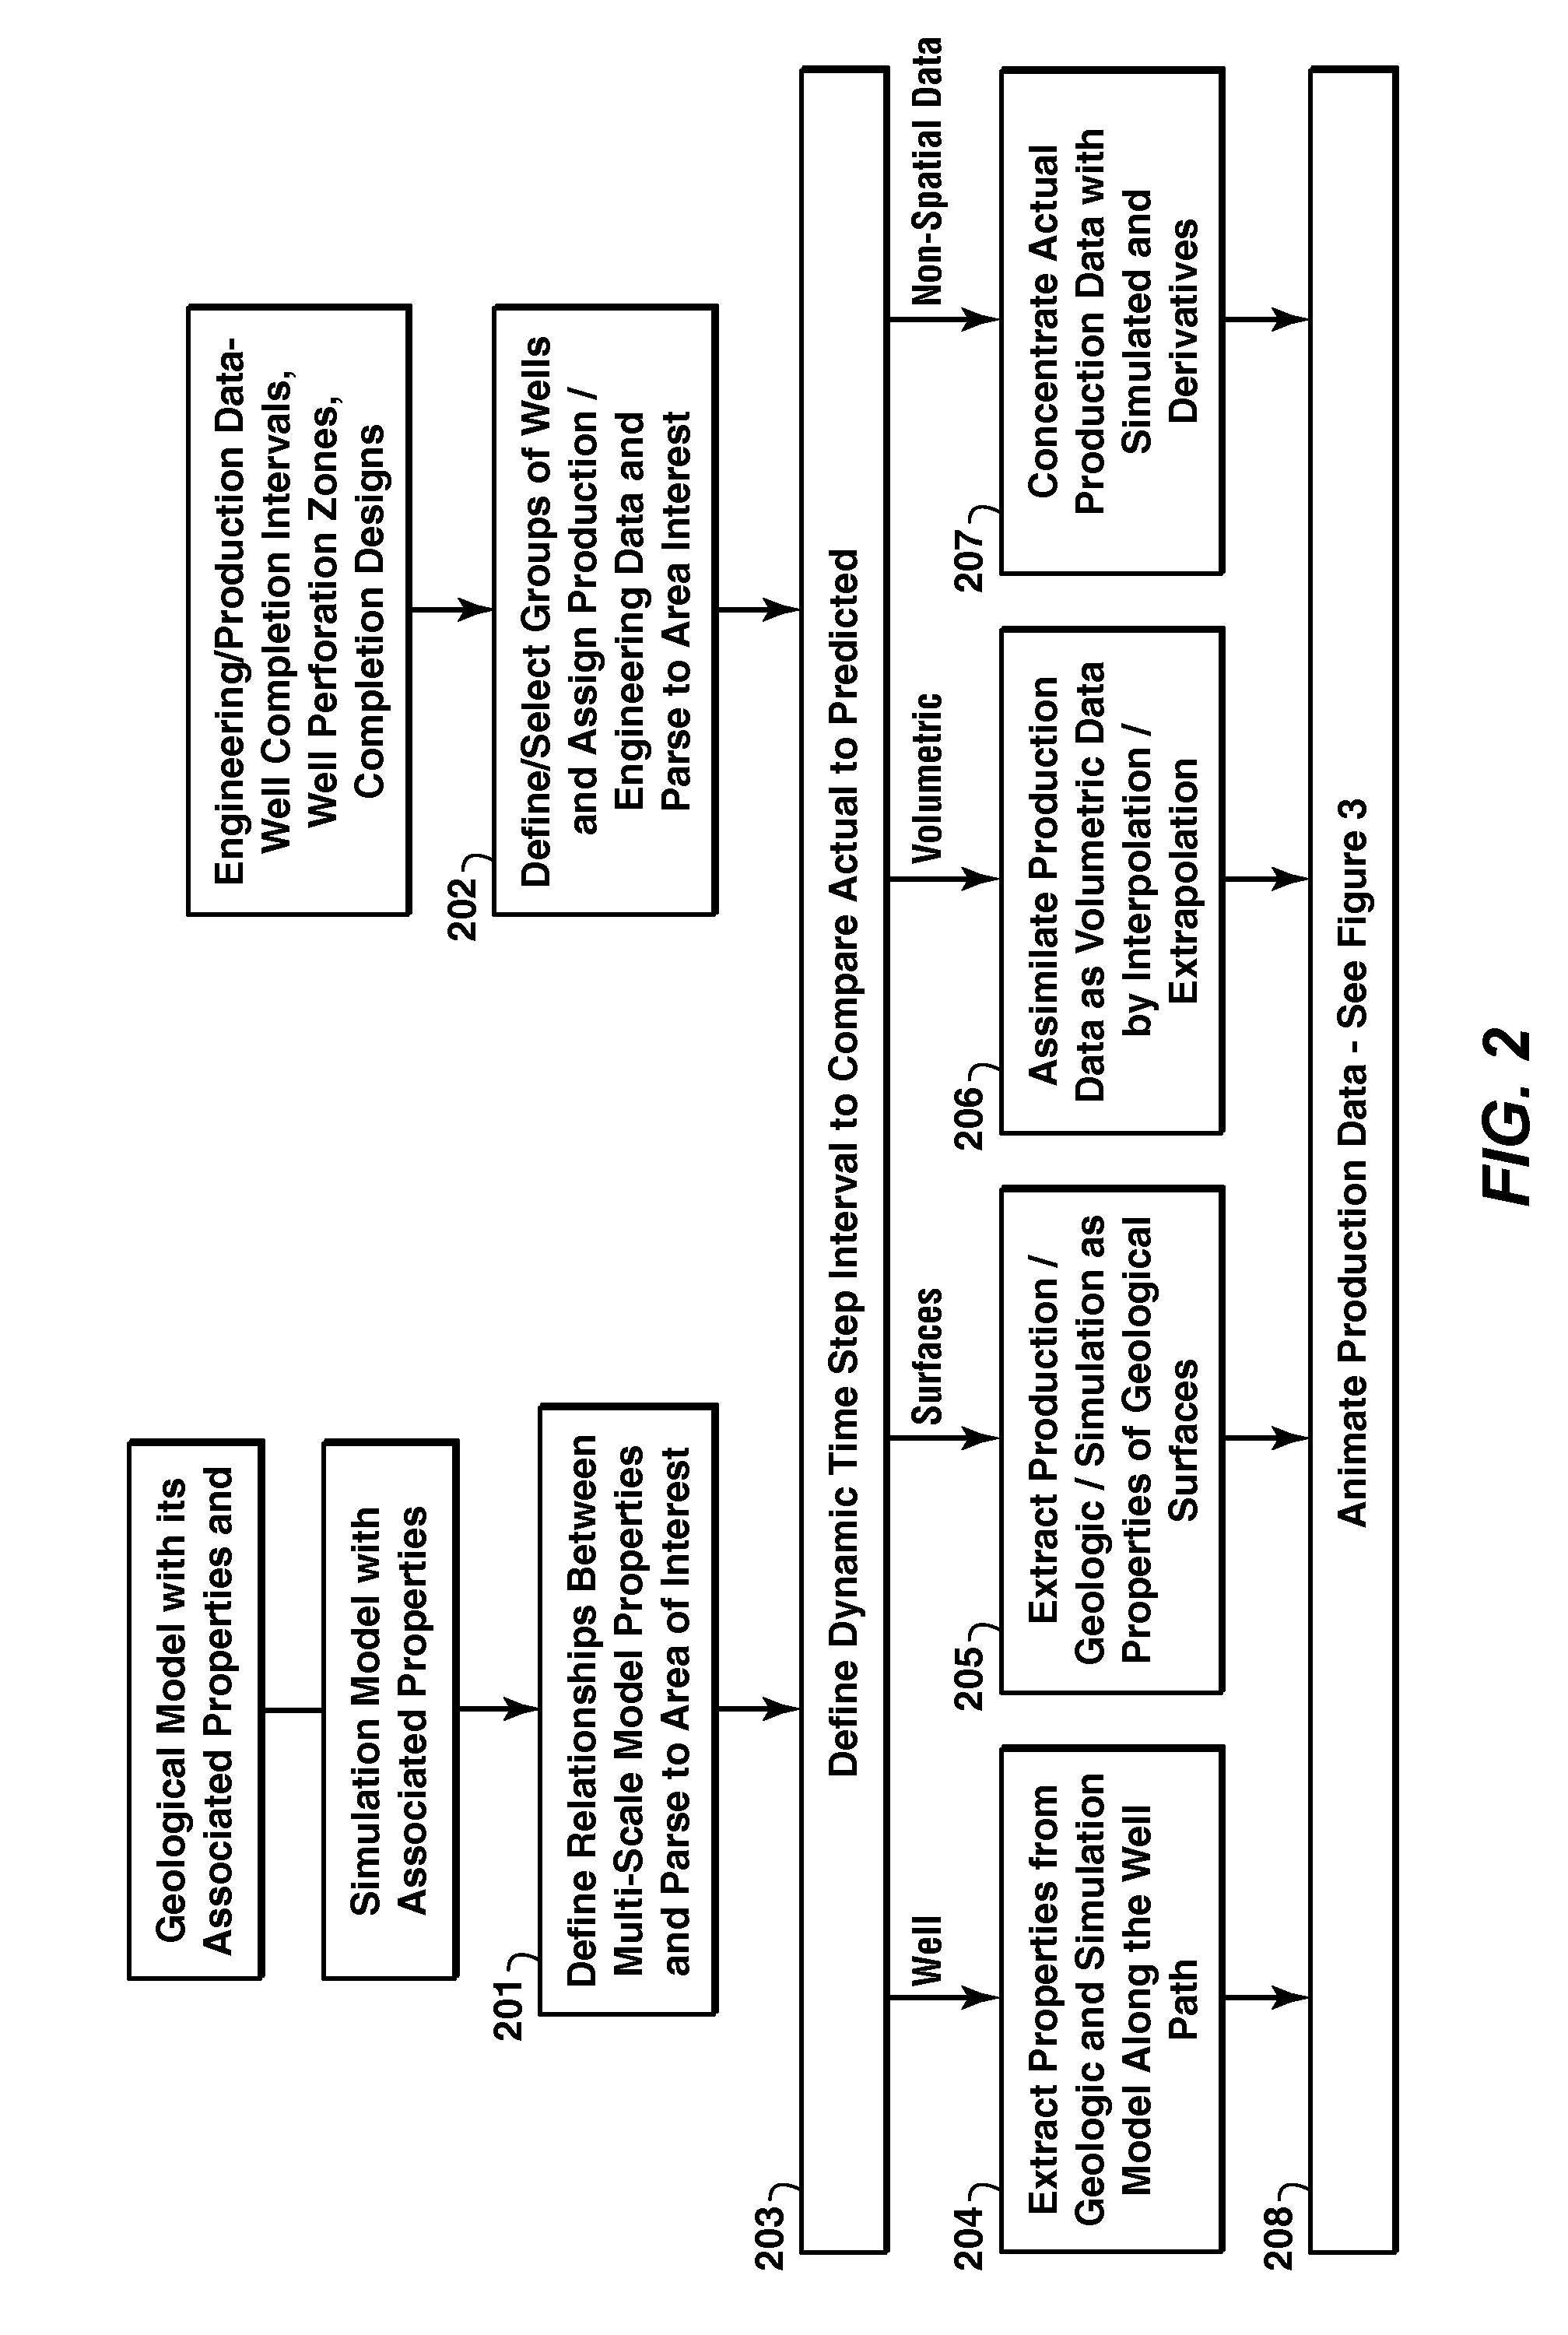
[0072]The following is an example of how the invention may be implemented, with some types of data displays shown. A three-dimensional representation of the subsurface is constructed, the 3D Earth Model, which represents the field of interest and surrounding area. Preferably, the 3D Earth Model is the most comprehensive sub-surface understanding of the field of interest and includes all data, at multiple scales of investigation that contributed to this understanding. The 3D Earth Model is designed to be the frame and context in which temporal data is to be displayed, animated and analyzed. As discussed above, FIG. 1 is a flow chart of a preferred embodiment of the Iterative Reservoir Surveillance process, i.e., the present inventive method; however the steps enumerated below in the description of the example refer to the more detailed 26-step embodiment of the invention discussed above. The 3D Earth Model representation could include one or more potential reservoirs and their associ...


PUM


Abstract

Method for reservoir surveillance using a three-dimensional Earth Model (101) to improve and expedite the surveillance at all scales of investigation (field, reservoir, fault compartment, and individual well) and at all time steps (minutes, hours, days, months, years). The new method allows users to rapidly identify anomalous field and well performance (109) and provides capability to investigate root causes of the performance deviation from predicted (110). Animated co-rendered displays (107) of the earth model and actual (104) and simulated (105) production data enable the user to interactively determine model adjustments back at the basic level of the Earth Model, which are then propagated to a geologic model (102) and then to the reservoir simulator (103) to update it (111) in a physically constrained way.

Description

CROSS-REFERENCE TO RELATED APPLICATION[0001]This application claims the benefit of U.S. Provisional Patent Application 61 / 007,554 filed Dec. 13, 2007 entitled ITERATIVE RESERVOIR SERVEILLANCE, the entirety of which is incorporated by reference herein.FIELD OF THE INVENTION[0002]The invention relates generally to the field of oil and gas production, and more particularly to reservoir management and surveillance. Specifically, the invention is a method for improving the ability of geoscientists and engineers to analyze and monitor the performance of a producing field or a planned producing field.BACKGROUND OF THE INVENTION[0003]Reservoir surveillance, as part of the reservoir management process, involves the continuous monitoring of production data across a spectrum of possible levels of investigation, ranging from full field to individual well. It entails the collection, integration and comprehensive analysis of geologic and engineering reservoir and well performance data to maximize...

Claims


Application Information

Patent Timeline
Patent Type & Authority Applications(United States)
IPC IPC(8): E21B43/12G06G7/48
CPCG01V99/00E21B41/00
Inventor SEQUEIRA, JR., JOSE JCHENG, YAO-CHOU
Owner EXXONMOBIL UPSTREAM RES CO
Why Eureka
Eureka Blog
Learn More