Quantification of analytes using accelerator mass spectrometry
a mass spectrometry and accelerator technology, applied in the direction of material analysis using wave/particle radiation, tube calibration apparatus, nuclear engineering, etc., can solve the problems of incomplete plasma, complicated quantification, and unknown amount being left unextracted
- Summary
- Abstract
- Description
- Claims
- Application Information
AI Technical Summary
Benefits of technology
Problems solved by technology
Method used
Image
Examples
example 1
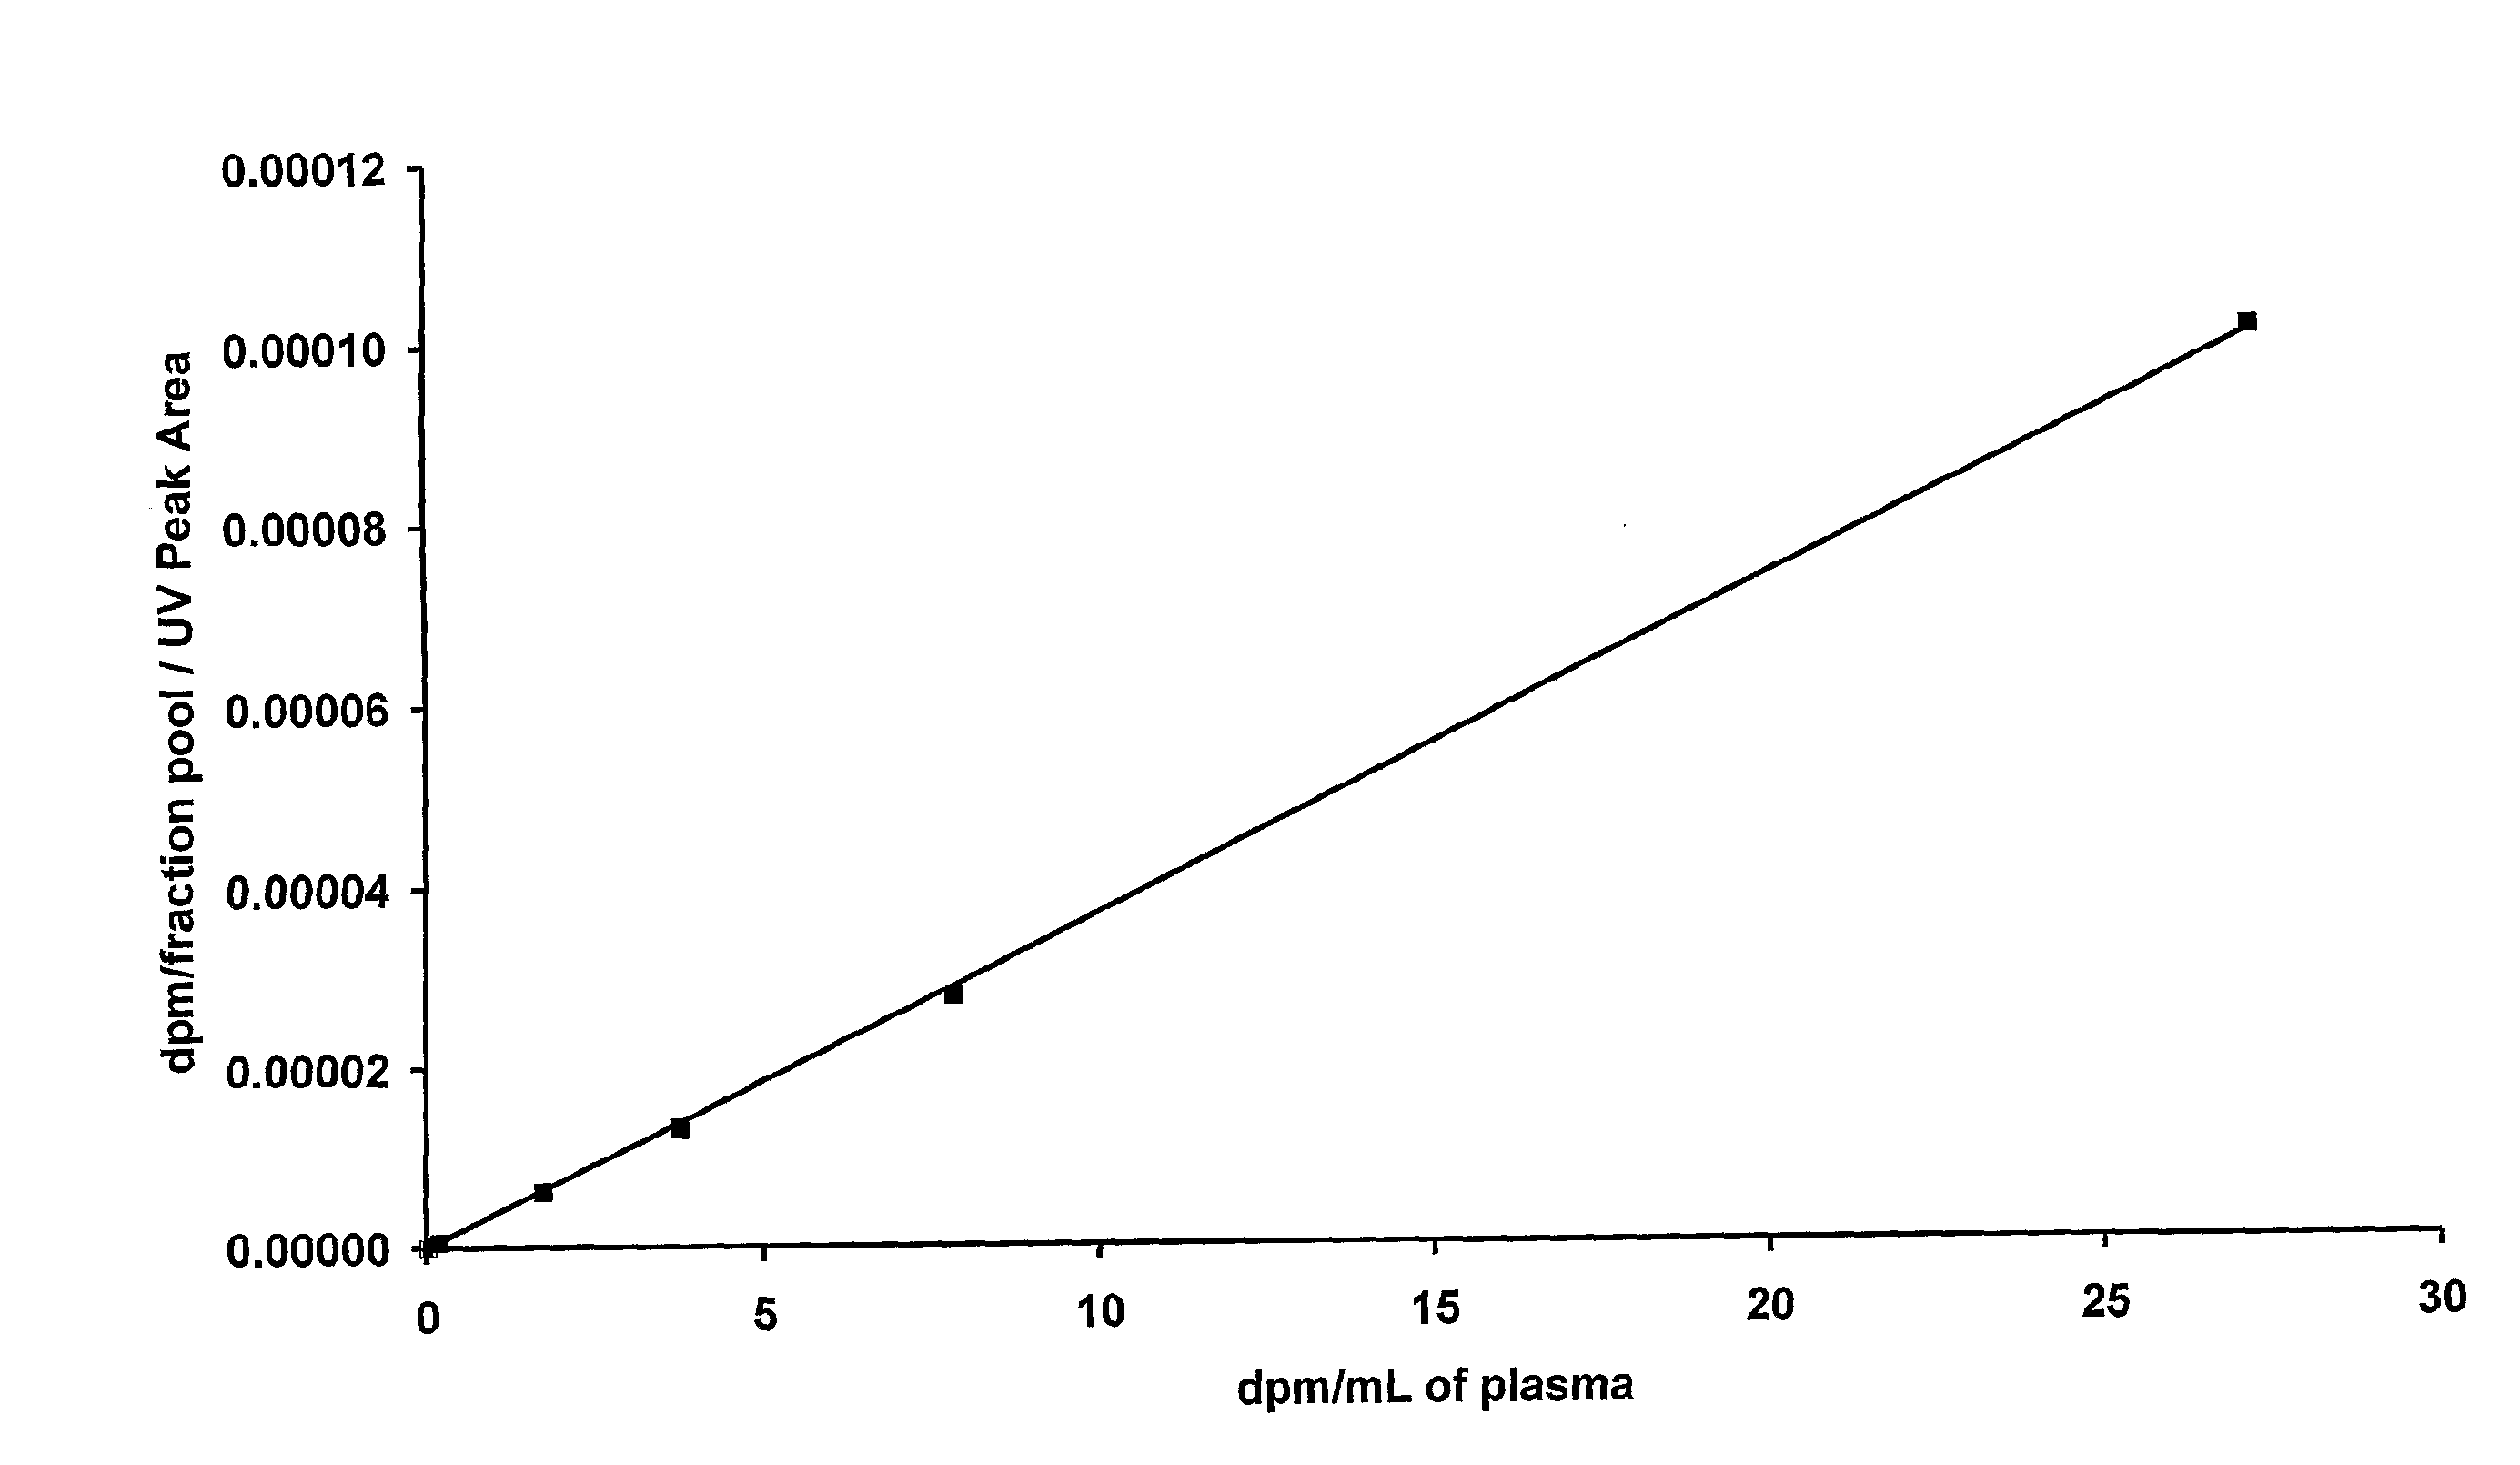
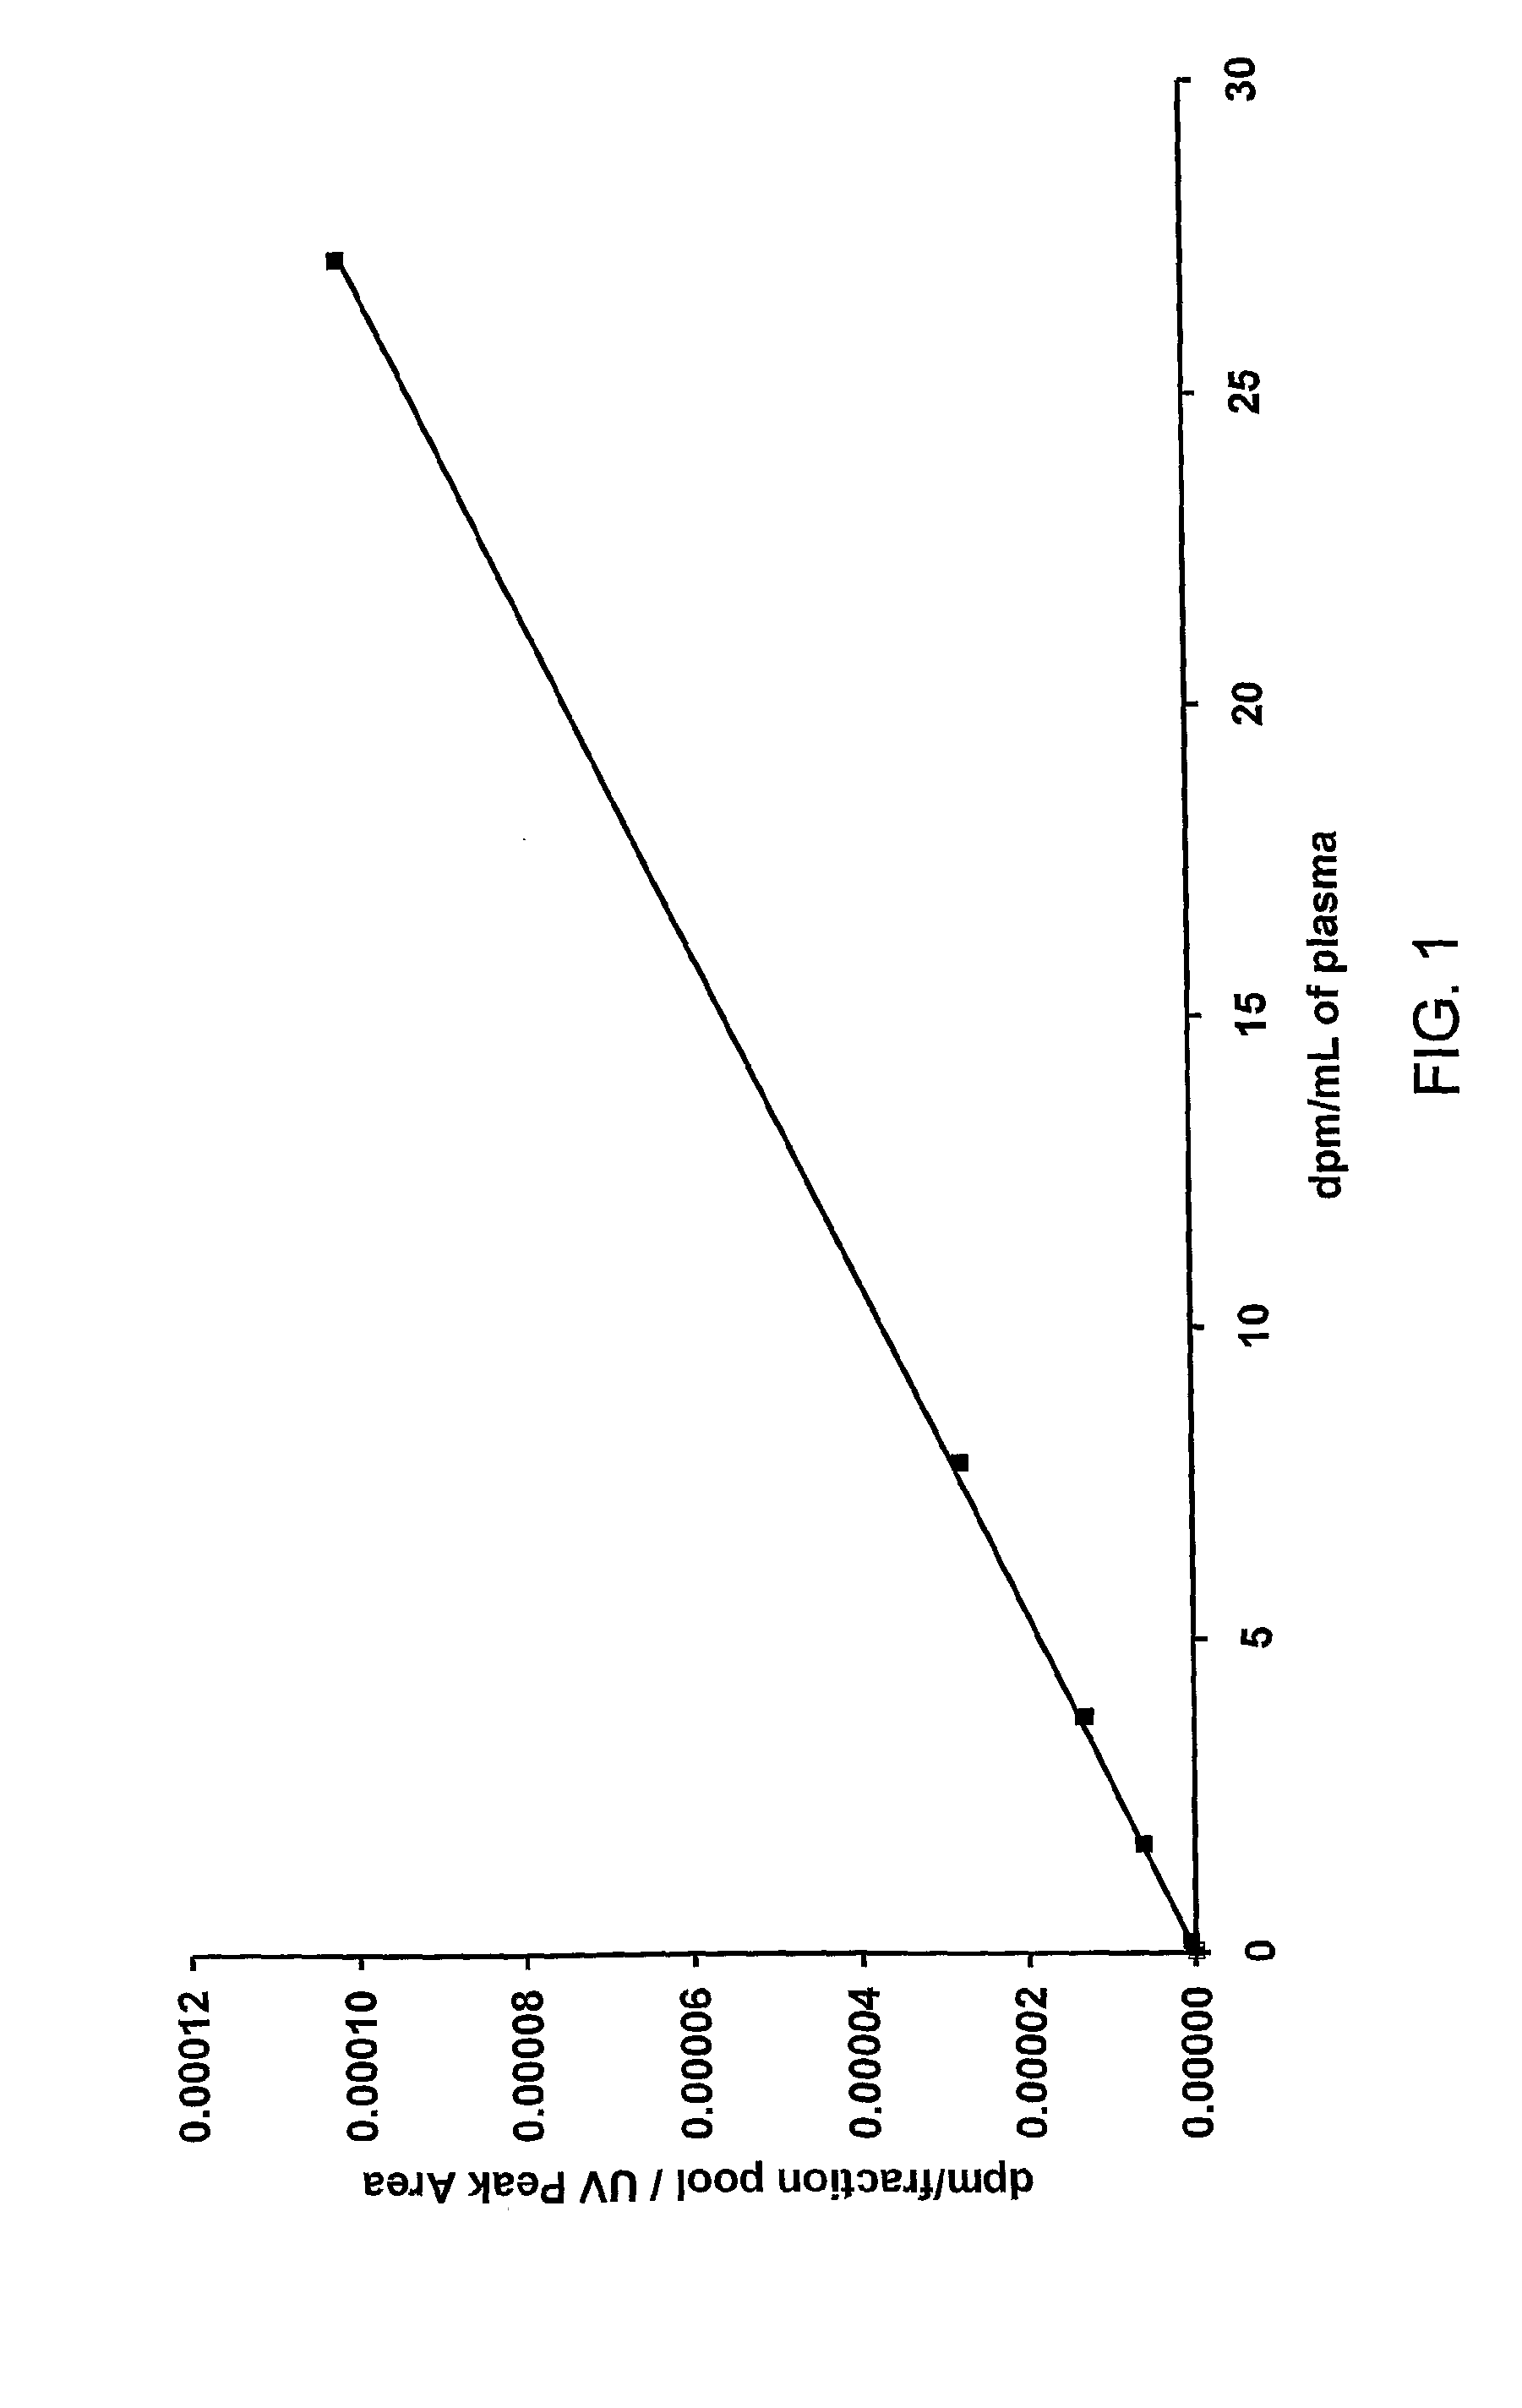
Construction of a Calibration Curve
[0134]Six 1 mL samples of control plasma (human plasma from donors that have never been exposed to the drug being analysed) were taken in separate tubes. Into each tube an amount of 14C-drug was added to achieve the target concentrations shown in Table 1.
[0135]Aliquots were taken from each tube and analysed directly using AMS as described below. The AMS results determined the actual concentrations achieved for each tube as shown in Table 1.
TABLE 1Radioactive concentrations for the calibration curve.TargetAchievedconcentrationconcentrationTube(dpm / mL)(dpm / mL)13027.2010287.8429343.7710411.731050.10.17310
[0136]The six plasma samples (200 μL aliquots from each) were then extracted using an exact amount of organic solvent which contained 40 μg / mL non-labelled drug. The extracts were taken to dryness over a stream of nitrogen and reconstituted in 200 μL of solvent.
[0137]Aliquots (50 μL) of each of the reconstituted samples were injected onto a HPLC and t...
example 2
Test Sample Measurement
[0150]A plasma sample was prepared so that it contained 6.9498 dpm / mL of drug. The sample was extracted (200 μL) using extraction solvent containing 40 μg / mL non-labelled drug. The extract was taken to dryness and reconstituted in 200 μL solvent and 50 μL was injected onto the HPLC. The peak area for the drug was recorded by UV absorbance. The eluate was collected as a series of fractions and the fraction corresponding to the drug was analysed for 14C by AMS. The analysis was conducted twice. Results of the analysis of this sample are shown in Table 6.
TABLE 6results of the analysis of a test sampledpm / mL plasmaRatio dpm / mLdpm / mL fromdpm / (conventionalUV peakplasma tocalibrationDuplicatefractionmethod)*areapeak areacurve10.22464.4928165.820.00002850497.4320.20094.128156.610.00002463036.65Mean0.212754.3068161.220.0000265677.04*50 μL from a 200 μL extract was injected onto HPLC, therefore the concentration in the plasma is 20 times that measured in the HPLC fracti...
PUM
| Property | Measurement | Unit |
|---|---|---|
| concentration | aaaaa | aaaaa |
| concentration | aaaaa | aaaaa |
| concentration | aaaaa | aaaaa |
Abstract
Description
Claims
Application Information
 - R&D
- Intellectual Property
- Life Sciences
- Materials
- Tech Scout
- Unparalleled Data Quality
- Higher Quality Content
- 60% Fewer Hallucinations
Browse by: Latest US Patents, China's latest patents, Technical Efficacy Thesaurus, Application Domain, Technology Topic, Popular Technical Reports.
© 2025 PatSnap. All rights reserved.Legal|Privacy policy|Modern Slavery Act Transparency Statement|Sitemap|About US| Contact US: help@patsnap.com


