
Method, System and Computer Program Product for Evaluation of Blood Glucose Variability In Diabetes From Self-Monitoring Data

a self-monitoring and diabetes technology, applied in the field of glucose monitoring, can solve the problems of insensitivity to hypoglycemia, bias towards hyperglycemia, and inability to accurately estimate the constricted hypoglycemic range, and achieve the effect of evaluating the long-term risks of hypoglycemia and hyperglycemia

Active Publication Date: 2009-07-02
UNIV OF VIRGINIA ALUMNI PATENTS FOUND
View PDF74 Cites 86 Cited by
  • Summary
  • Abstract
  • Description
  • Claims
  • Application Information

AI Technical Summary

Benefits of technology

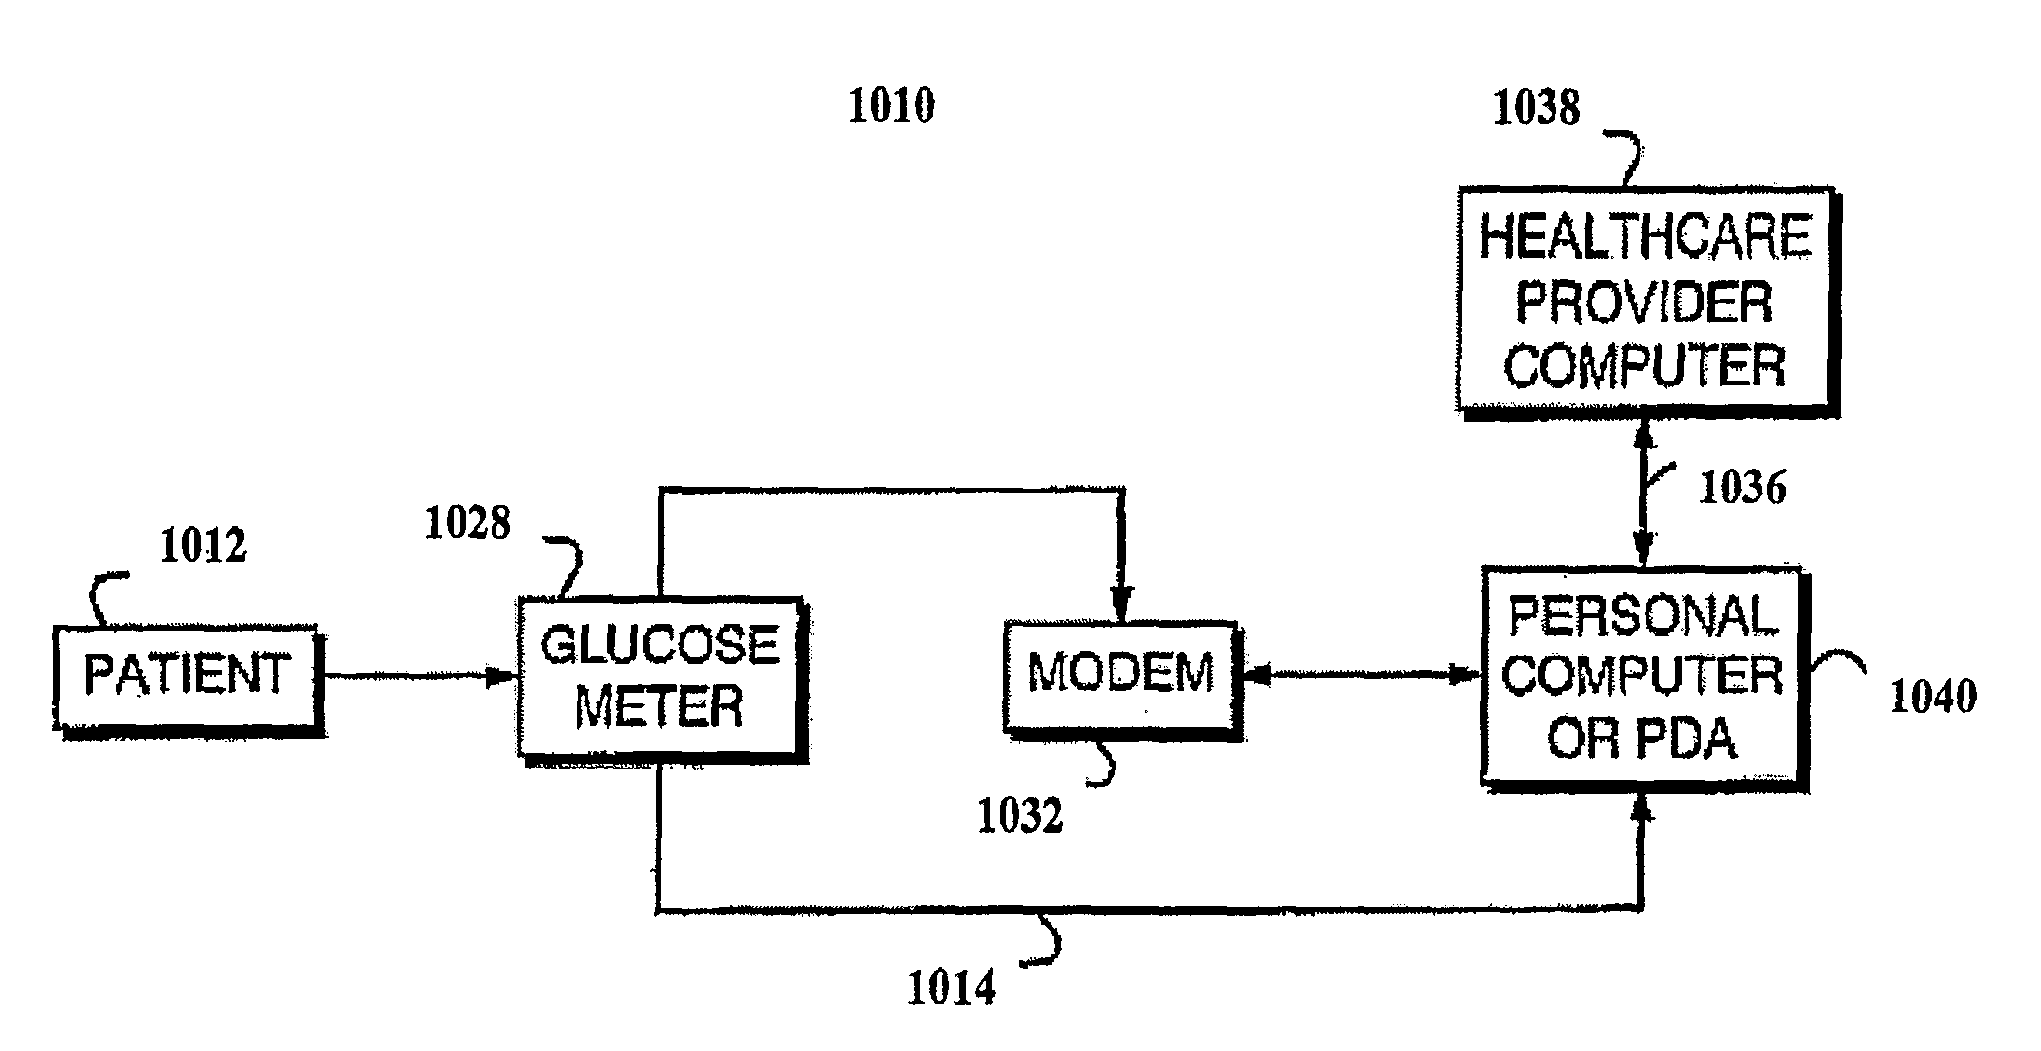
[0183]The potential implementations of the method, system, and computer program product of the various embodiments of the invention provide the following advantages, but are not limited thereto. First, the various embodiments of the invention enhance existing SMBG devices by introducing an intelligent data interpretation component capable of evaluating the extent, and predicting the risk of extreme BG fluctuations. They farther enable future SMBG devices by the same features.

Problems solved by technology

Such abnormal glucose patterns lead to profound acute and chronic negative consequences that are expressed at all levels of the living organism—from microvascular complications, through heart disease, to aberrations in human behavior.
A major problem common for these measures (except for LI) is their insensitivity to hypoglycemia and their inherent bias towards hyperglycemic readings, which is reflected by the historically poor prediction of hypoglycemic episodes (8 to 18% as reviewed in the previous section).
In other words, the “numerical center” of the data is substantially separated from its “clinical center.” Thus, clinical conclusions, based on numerical methods, will be less accurate for the constricted hypoglycemic range and will be biased towards hyperglycemia.
However, it is still substantially less accurate that our risk-based methods (introduced in this disclosure) in prediction of hypoglycemic episodes.

Method used


Image

  • Method, System and Computer Program Product for Evaluation of Blood Glucose Variability In Diabetes From Self-Monitoring Data
  • Method, System and Computer Program Product for Evaluation of Blood Glucose Variability In Diabetes From Self-Monitoring Data
  • Method, System and Computer Program Product for Evaluation of Blood Glucose Variability In Diabetes From Self-Monitoring Data

Examples


example a

Relationship of Measures of Glucose Variability with Out of Control Glucose Results

[0288]Background: Evidence is accumulating that glucose excursions may be a significant contributor to the complications in diabetes. In addition, glucose excursions must be minimized to optimally reduce HbA1c. Therefore there is a need to determine measures of glucose variability that can be used to manage and reduce glucose excursions.

[0289]Methods: Using a sample of one month of longitudinal time stamped self-monitoring of blood glucose (SMBG) data from a large dataset of 335 patients, different variability measures used in clinical practice and described in the literature including Standard Deviation (SD), Range, Mean Amplitude of Glycemic Excursion (MAGE), M-Value and the Liability Index were computed and related to the frequency of out of control glucose results (Glucose180 mg / dl) in the subsequent 1 month of patient SMBG results. SD and mean groupings for various HbA1c cohorts were also devised...

example b

Algorithmic Design of an Intelligent Blood Glucose Meter Phase 4 Data File Description and Preliminary Results

Introduction:

[0292]The data collection of Phase 4 was a continuation of a large NIH-funded study NIDDK RO1 DK 51562, “Bio-Behavioral Monitoring and Control of IDDM” with Principal Investigator Boris Kovatchev, specifically of the data from its Hospital-laboratory study (HIC #10714), which investigates metabolic parameters of adults with T1DM during hyperinsulinemic euglycemic clamp and subsequent descent into hypoglycemia with a target level of 40 mg / dl. During this study, metabolic demand and counterregulation data were collected for 39 people with T1DM. The computation of each person's individual metabolic demand (IMD) used the classic DeFronzo's clamp equations, modified by BK to account for non-steady states, such as exercise and hypoglycemia. Counterregulatory response was assessed by a direct measurement of epinephrine levels at baseline and then every 10 minutes durin...

example c

Field Glucose Variability Index is Related to Laboratory Measures of Insulin Sensitivity and Hypoglycemia Counterregulation

[0304]Background and Aims: Contemporary studies increasingly support the idea that blood glucose (BG) variability is a major determinant of diabetes complications; therefore BG variability, along with HbA1c, becomes a major marker of glycemic control in Type 1 and Type 2 diabetes (T1DM, T2DM). However, quantifying glucose variability is not straightforward—traditional variability measures, such as standard deviation (SD), M-value, etc. appear to be mostly dependent on hyperglycemic excursions, ignoring hypoglycemic BG fluctuations and being insensitive to hypoglycemia-related characteristics of T1DM.

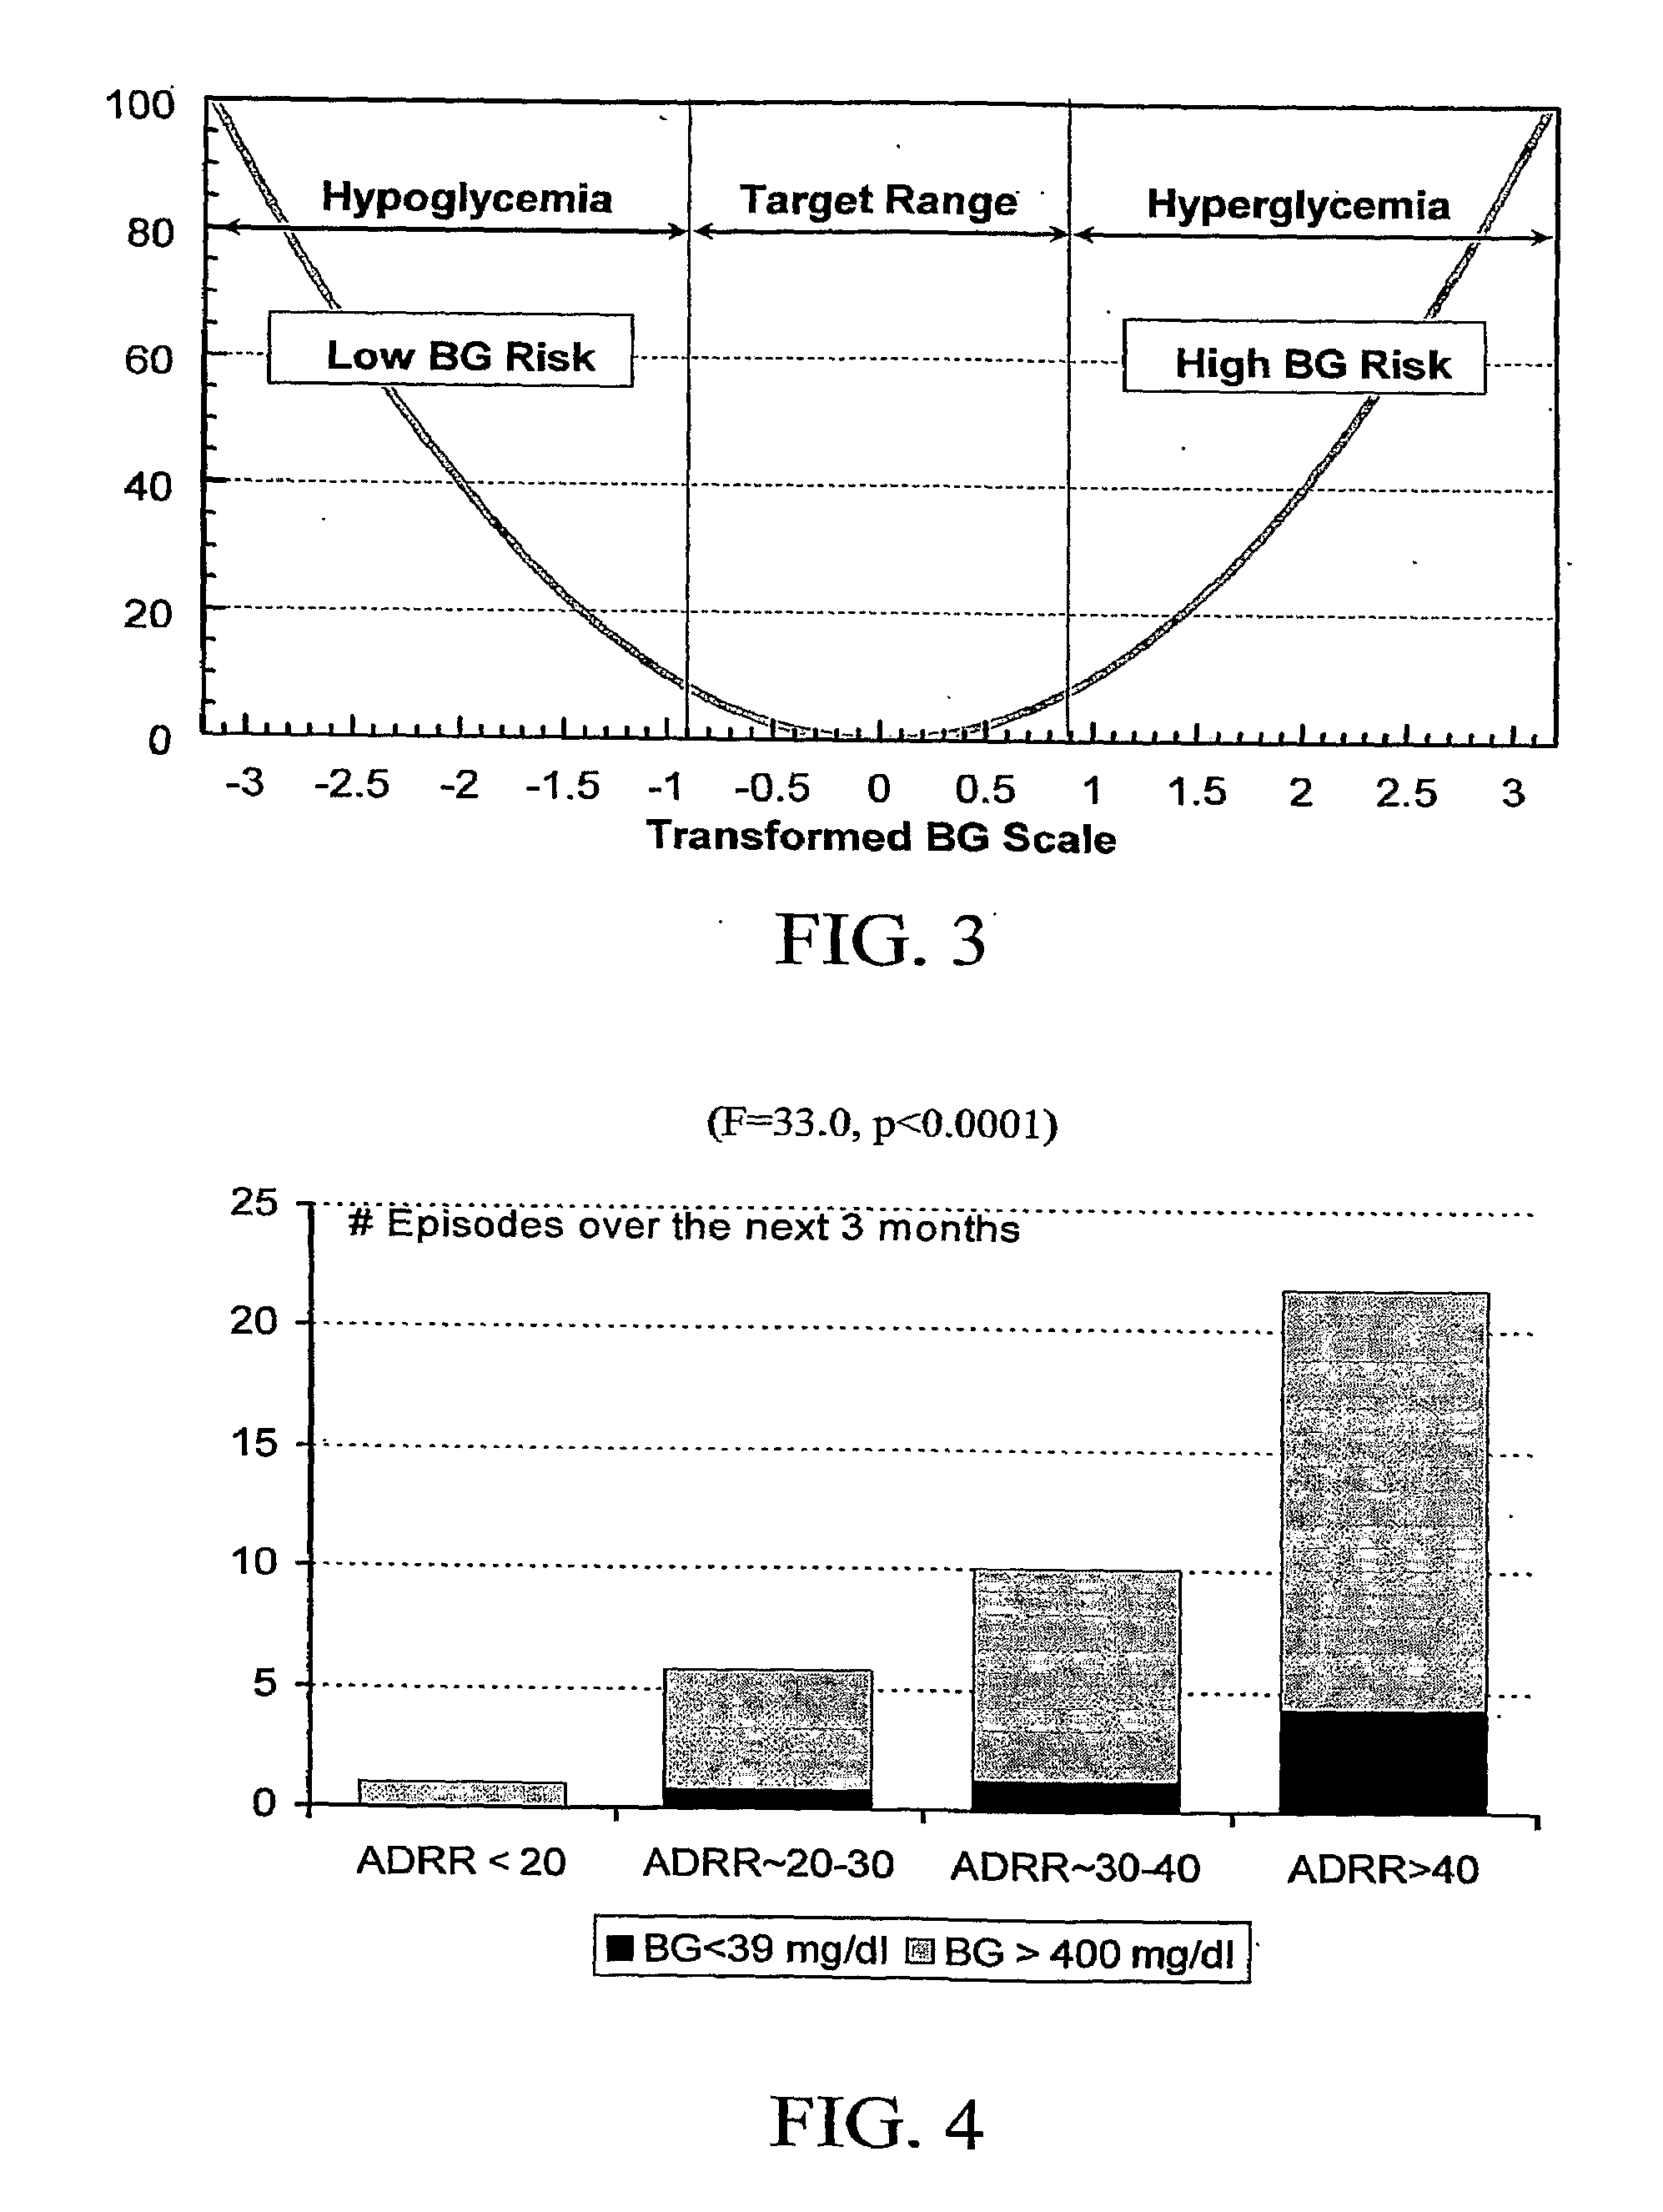
[0305]This study introduces a new variability measure computed from routine self-monitoring BG (SMBG) data, the Average Daily Risk Range (ADRR), which is equally sensitive to hypoglycemic and hyperglycemic excursions, and investigates its relationship with laboratory...


PUM


Abstract

A system, computer program product, method and algorithm for evaluation of blood glucose variability—one of the most important parameters of diabetes management. An embodiment of the method may use routine self-monitoring blood glucose (SMBG) data collected over a period of 2-6 weeks, for example, based on a theory of risk analysis of blood glucose data. One aspect may include a method, system and computer program product for computing the Average Daily Risk Range (ADRR)—a measure of overall glucose variability. Another aspect may include a method, system, and computer program product for estimating separately the glucose variability in the hypoglycemic range via a Low BG Index (LBGI) and the glucose variability in the high BG range via High BG Index (HBGI) followed by a combination of the two indices into a single variability display.

Description

RELATED APPLICATIONS[0001]The present patent application claims priority from U.S. Provisional Application Ser. No. 60 / 756,340, filed Jan. 5, 2006, entitled “Method, System and Computer Program Product for Evaluation of Blood Glucose Variability in Diabetes from Self-Monitoring Data,” and No. 60 / 786,944, filed Mar. 29, 2006, entitled “Method, System and Computer Program Product for Evaluation of Blood Glucose Variability in Diabetes from Self-Monitoring Data,” the entire disclosures of which are hereby incorporated by reference herein.GOVERNMENT SUPPORT[0002]Work described herein was supported by Federal Grant No. R01 DK51562, awarded by NIH. The Government has certain rights in the invention.TECHNICAL FIELD OF INVENTION[0003]The present system relates generally to the art of glucose monitoring, and more particularly to hypo- and hyper-glycemic risk assessment.BACKGROUND OF INVENTIONThe Importance of Controlling Blood Glucose Variability in Diabetes[0004]Diabetes is a complex of dis...

Claims


Application Information

Patent Timeline
IPC IPC(8): G06F19/00
CPCG06F19/345G16H50/20G16H50/30
Inventor KOVATCHEV, BORIS P.
Owner UNIV OF VIRGINIA ALUMNI PATENTS FOUND
Learn More