Method for verifying plotting results

Inactive Publication Date: 2009-02-26
AIRBUS DEFENCE & SPACE
View PDF2 Cites 0 Cited by
  • Summary
  • Abstract
  • Description
  • Claims
  • Application Information

AI Technical Summary

Benefits of technology

[0003]Modern plotters make it possible to reliably detect individual signals in the case of multiple-wave incidence. Many plotters currently perform such multiple-wave detection using a circular array of antennas. It is also possible to localize signals at the same frequencies coming from different directions. However, in such multiple-wave detection at the same frequency, it is not possible to differentiate whether there are two different transmitters or whether reflections from the same transmitter, e.g., from a high-rise building or mountain, are involved.
[0005]An object of this invention is to provide a method by which, in cases of multiple-wave incidence at the same frequency, on the basis of reflection from surroundings, a rapid and reliable determination may be made as to whether the same or different transmitters are involved.
[0021]By use of a method according to the invention, a rapid and reliable determination may be made as to whether a second transmitter, or only a reflection from the first transmitter, is involved. In this manner the positional image of a plot is more definitive, which is of great importance for problematic environmental influences (cities with numerous transmitters and reflections, mountains with numerous reflections, etc.). In many cases, this information may be obtained without identifying the type of modulation, or even demodulating the information.

Problems solved by technology

However, in such multiple-wave detection at the same frequency, it is not possible to differentiate whether there are two different transmitters or whether reflections from the same transmitter, e.g., from a high-rise building or mountain, are involved.
However, further investigation as to whether the same or different transmitters are involved is not made.

Method used


Image

  • Method for verifying plotting results
  • Method for verifying plotting results
  • Method for verifying plotting results

Examples


Embodiment Construction

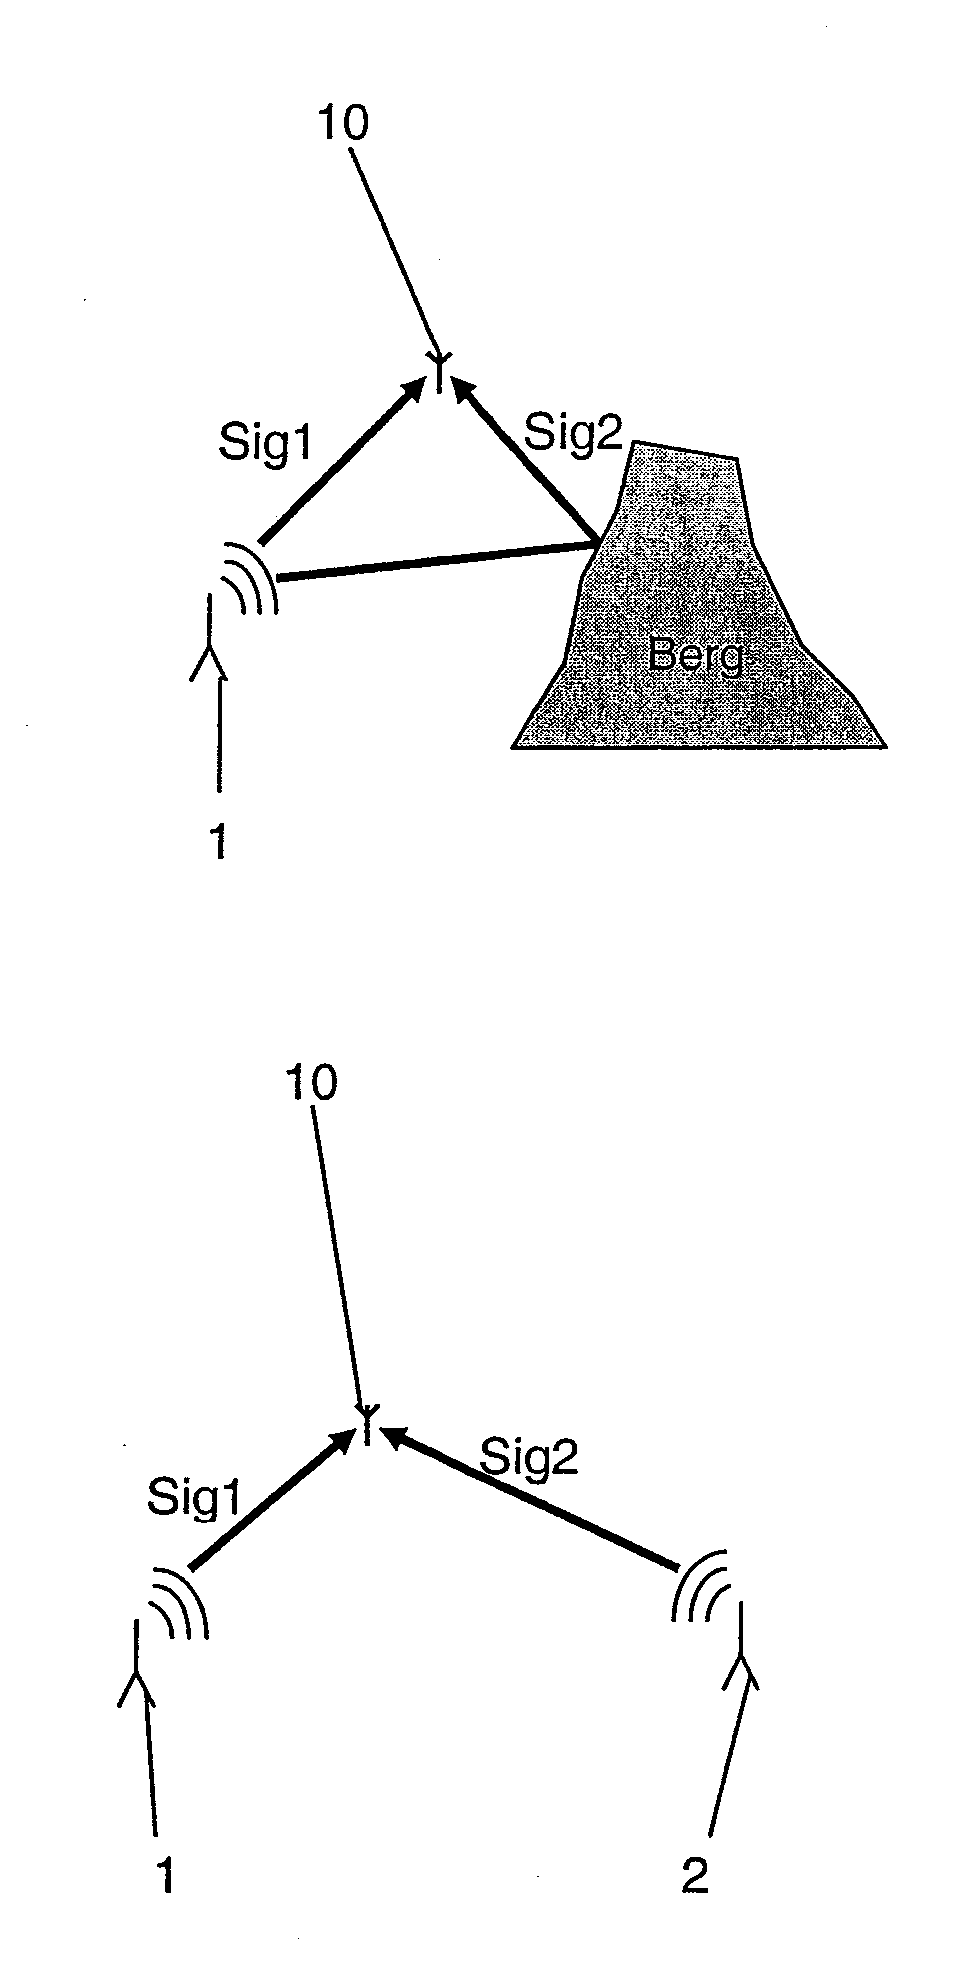
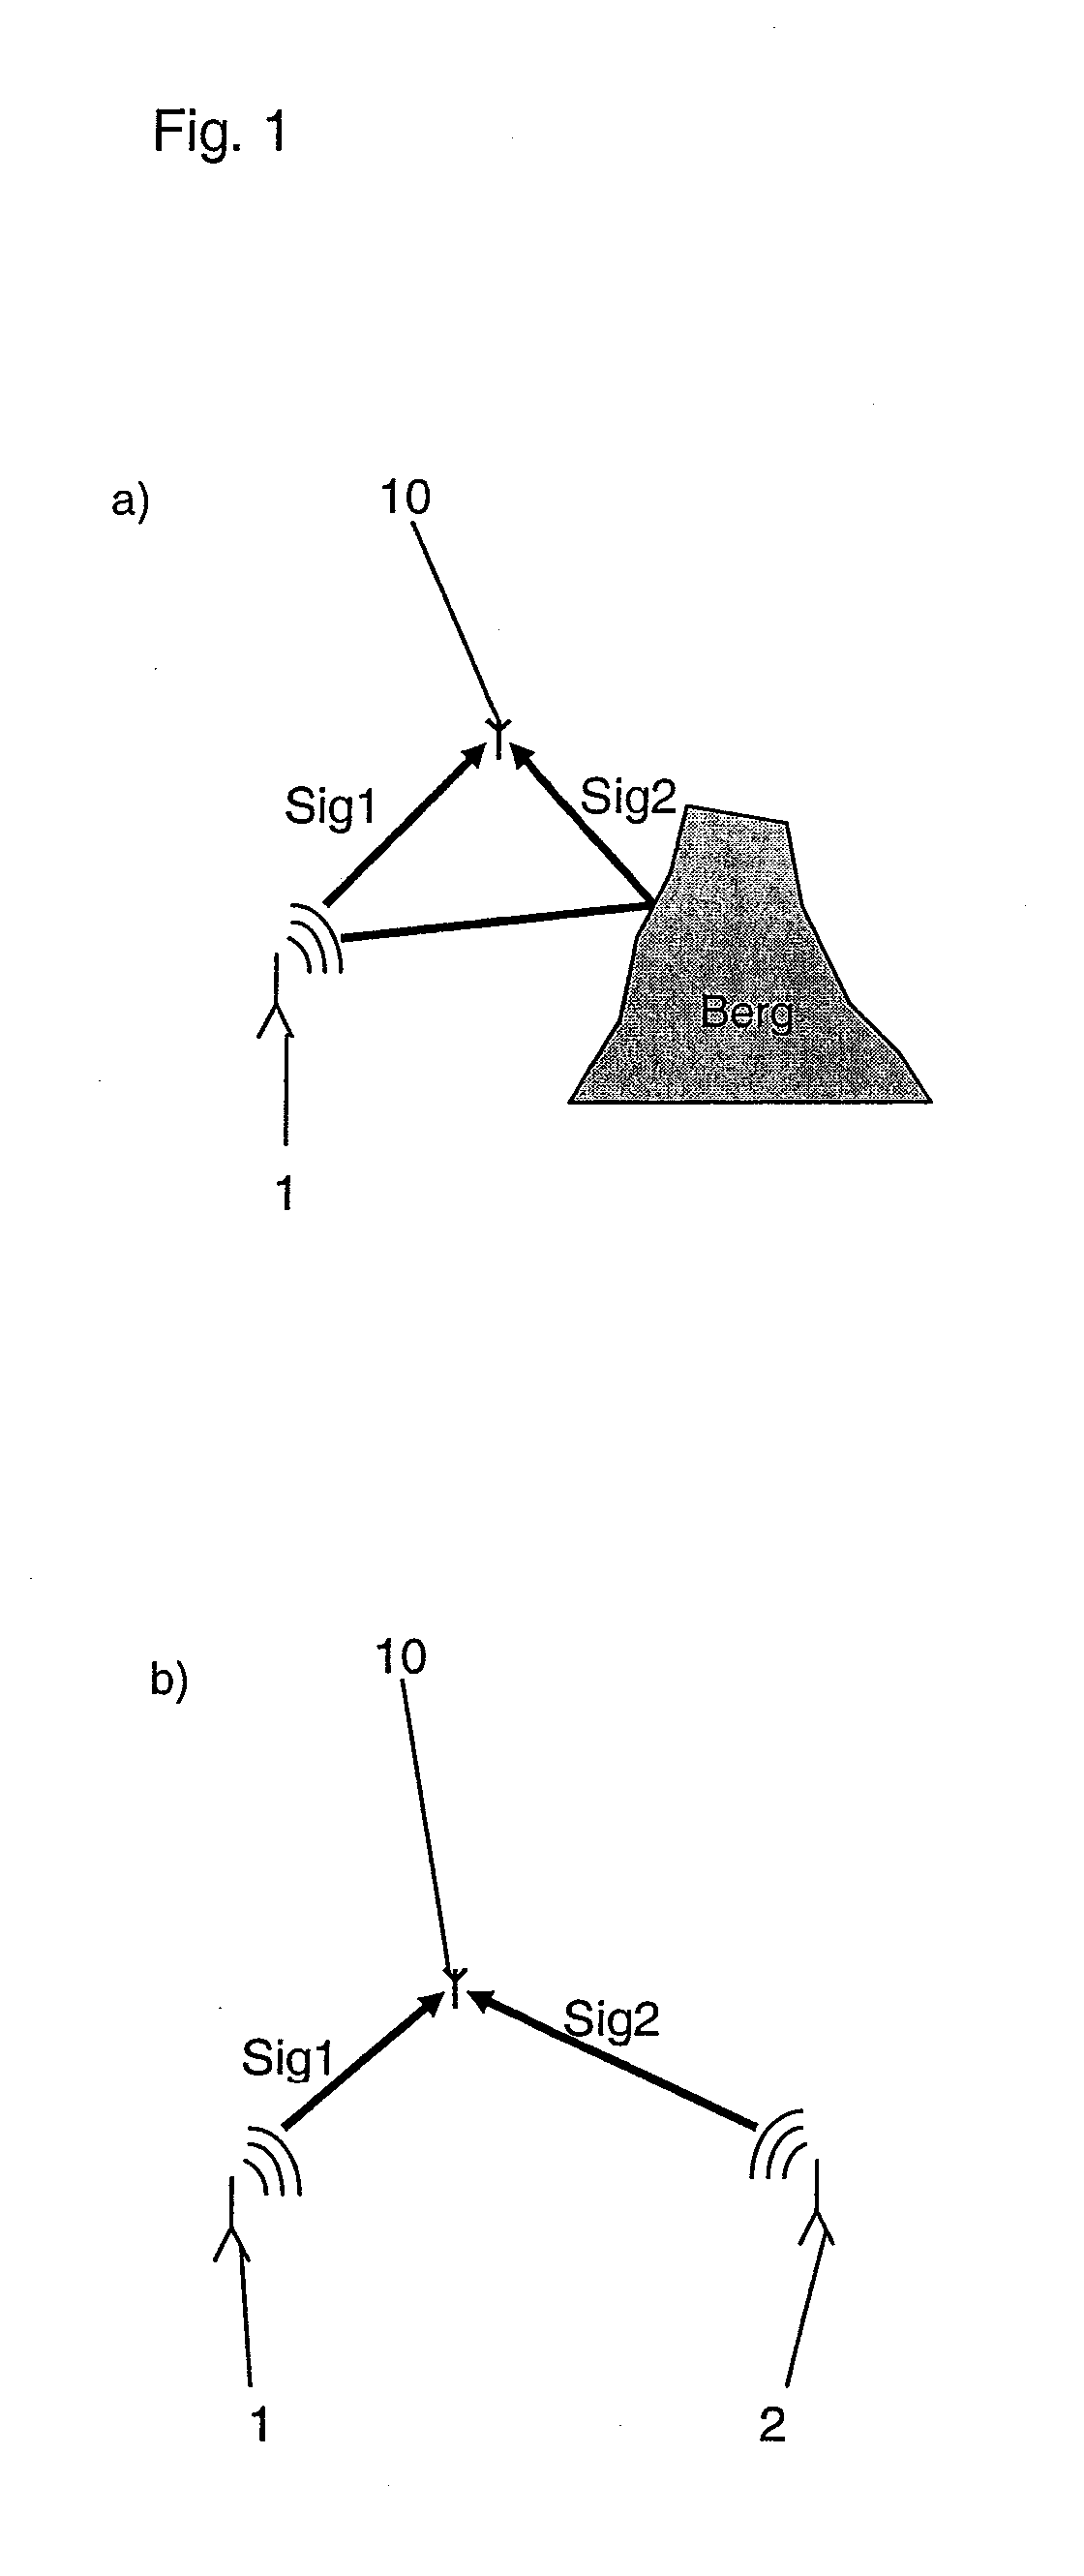
[0027]FIG. 1 shows, as previously explained, two cases which are to be differentiated by use of the method according to the invention. During plotting using a plotting antenna 10, when multiple signals Sig1, Sig2 of the same frequency are detected from different directions, plotting may involve either the same transmitter 1, whose signals have been reflected from a mountain, e.g., (FIG. 1a), or two different transmitters 1, 2 (FIG. 1b).

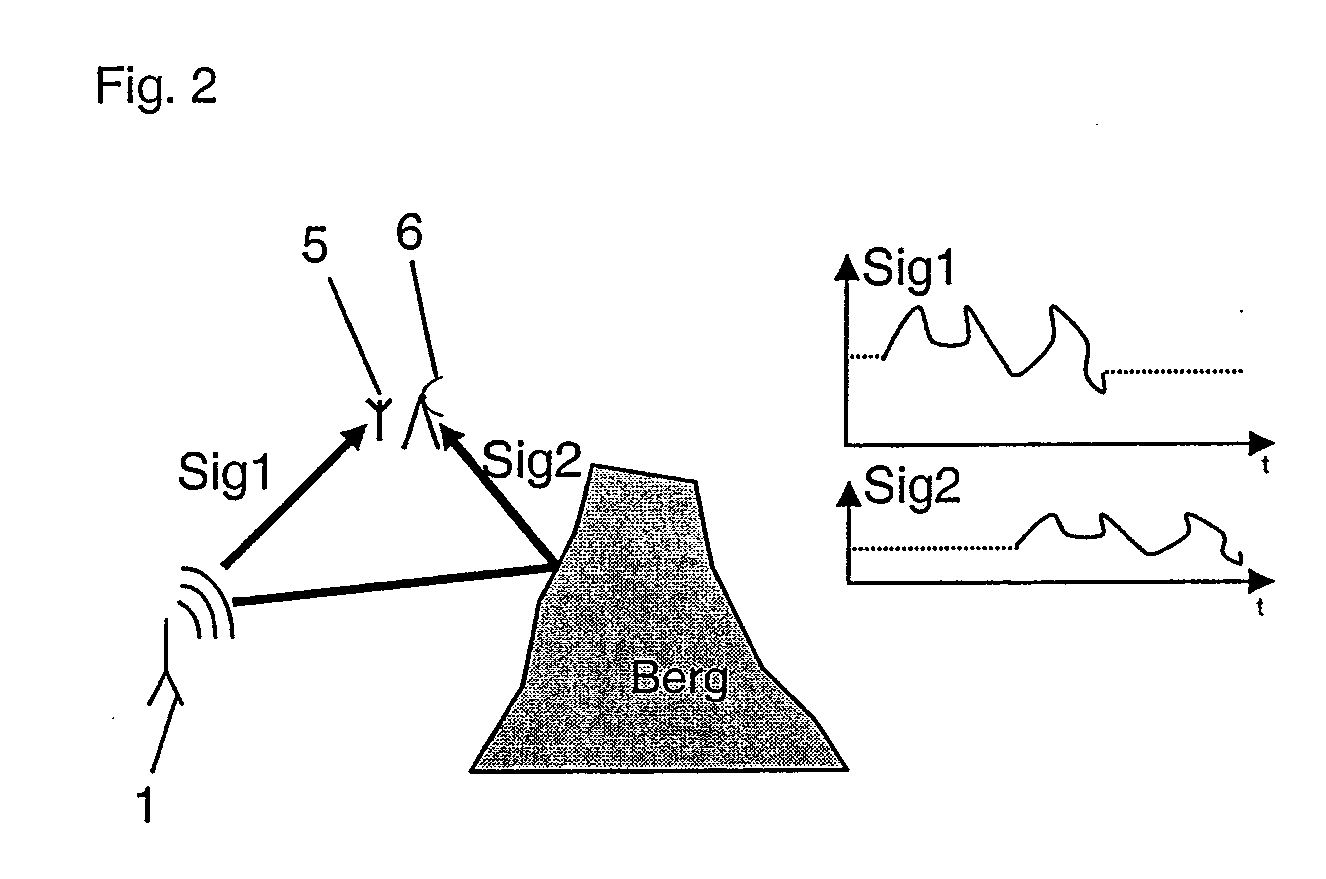
[0028]FIG. 2 shows a specific situation for use of the method according to the invention. The plotting process provided upstream from the plotting method according to the invention has determined as plotting results two signals Sig1, Sig2 from different directions, but having the same frequency. The signal levels were of different magnitudes. To verify these plotting results, by use of the method according to the invention, the stronger of the two signals, namely, signal Sig1, is received via a nondirectional antenna 5. The nondirectional antenna 5 ma...


PUM


Abstract

A method is provided for verifying plotting results when multiple signals of the same frequency have been detected from different directions. Signal characteristics of the signals detected from different directions are compared so that, on the basis of the signal comparison, a decision may be made as to whether a reflection from the same transmitter is occurring, or different transmitters are involved.

Description

[0001]This application is the U.S. national phase of international patent application PCT / DE2006 / 002183, filed Dec. 8, 2006, the entire disclosure of which is hereby incorporated by reference, and claims priority to German patent application 10 2005 061 391.8, filed Dec. 22, 2005.BACKGROUND AND SUMMARY OF THE INVENTION[0002]This invention relates to a method for verifying plotting results.[0003]Modern plotters make it possible to reliably detect individual signals in the case of multiple-wave incidence. Many plotters currently perform such multiple-wave detection using a circular array of antennas. It is also possible to localize signals at the same frequencies coming from different directions. However, in such multiple-wave detection at the same frequency, it is not possible to differentiate whether there are two different transmitters or whether reflections from the same transmitter, e.g., from a high-rise building or mountain, are involved.[0004]In mobile wireless communication, ...

Claims


Application Information

Patent Timeline
IPC IPC(8): H04W24/00
CPCG01S3/10G01S3/023
Inventor KOTTKE, THOMASJUNG, NORBERTKIENLE, SIEGFRIED
Owner AIRBUS DEFENCE & SPACE
Why Eureka
Try Eureka