Identification and use of biomarkers for non-invasive and early detection of liver injury
a biomarker and liver technology, applied in the field of liver injury identification and early detection of liver injury, can solve the problems of inadequate information
- Summary
- Abstract
- Description
- Claims
- Application Information
AI Technical Summary
Benefits of technology
Problems solved by technology
Method used
Image
Examples
example 1
Acetaminophen-Induced Liver Toxicity Study Design and Data Acquisition
[0090]An acetaminophen-induced liver toxicity study was performed as follows. Rats were administered a single dose of acetaminophen (APAP) at 0, 50, 150, 1500 or 2000 mg / kg p.o. (6 rats per group). The 150 mg / kg dose is equivalent to a low overdose level in humans (˜10 g) and 1500 mg / kg is a low toxic dose in rats. The rats were sacrificed at 6, 18, 24, and 48 hr post dosing. Livers of the rats were processed for biochemical profiling, histopathology and gene expression analysis. For the 0, 50 and 1500 mg / kg dose groups, rat urine was collected at −24-0, 0-6, 6-24, and 24-48 hr relative to dosing. Similarly, rat serum was collected at 48 hr for the 0, 50 and 1500 mg / kg groups.
[0091]Rat tissue was prepared for LC-MS analysis as follows. Rat liver tissue samples were frozen upon collection. A slice of each frozen sample was placed into a mortar, covered with liquid nitrogen, and ground with a pestl...
example 2
Data Analysis Methods
Locating a Subset of Most Interest that Corresponds to an Observed Trend
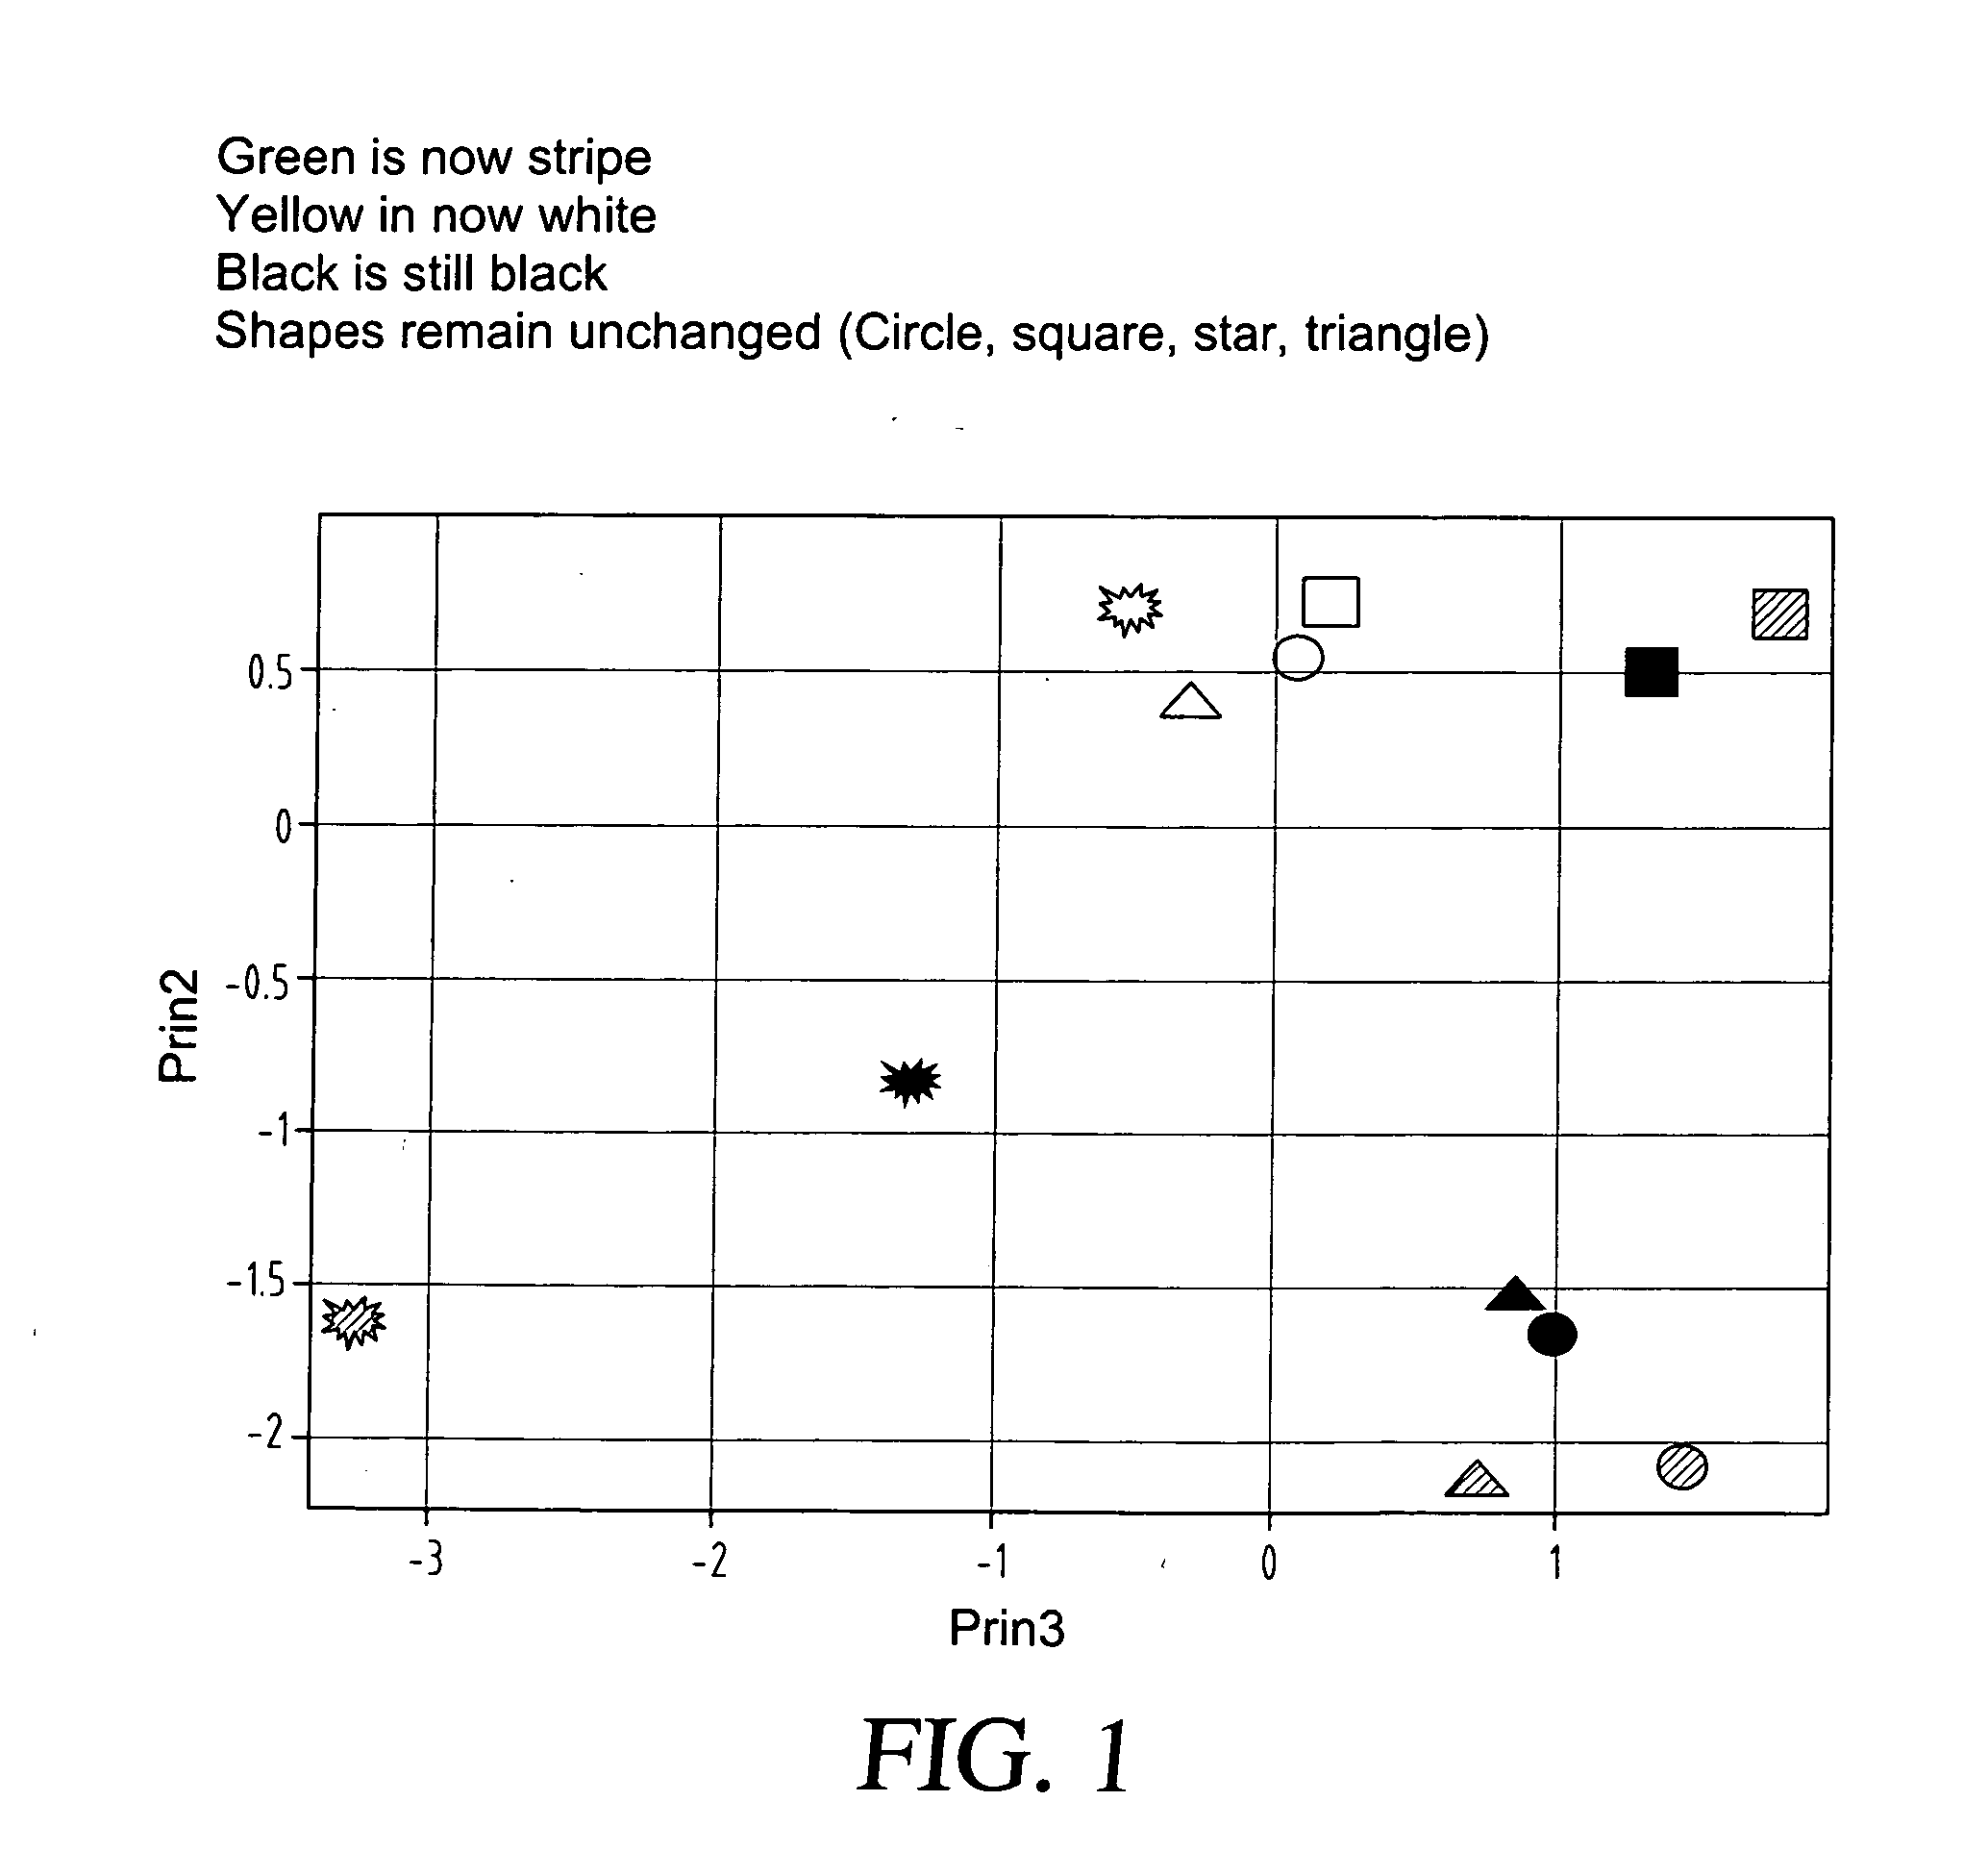
[0096]A targeted list of relative responses for peaks and peaks annotated as known compounds was produced from the LC / MS data for the rat liver samples described in Example 1. The resulting biochemical profiling data was subjected to Principal Component Analysis (PCA), showing trends over both dose and time (see FIG. 1). The third principal component (x-axis) is plotted against the second principal component (y-axis) for each of the 6, 18, 24 and 48 hr time points for acetaminophen does 150 mg / kg (shapes with white fill), 1500 mg / kg (shapes with black fill), and 2000 mg / kg (shapes with striped fill). Each data point represents the average for six animals.
[0097]Mathematical models of the trends observed in the PCA plot were developed. Two trends were observed in the PCA plot. Trend 1 is a trend of increasing distance from control as the dose increases at any given time point. Trend 2 is a tre...
example 3
Data Analysis Methods
Locating a Subset of Most Interest that Corresponds to a Predicted Trend that is not Evident in a Dataset as a Whole
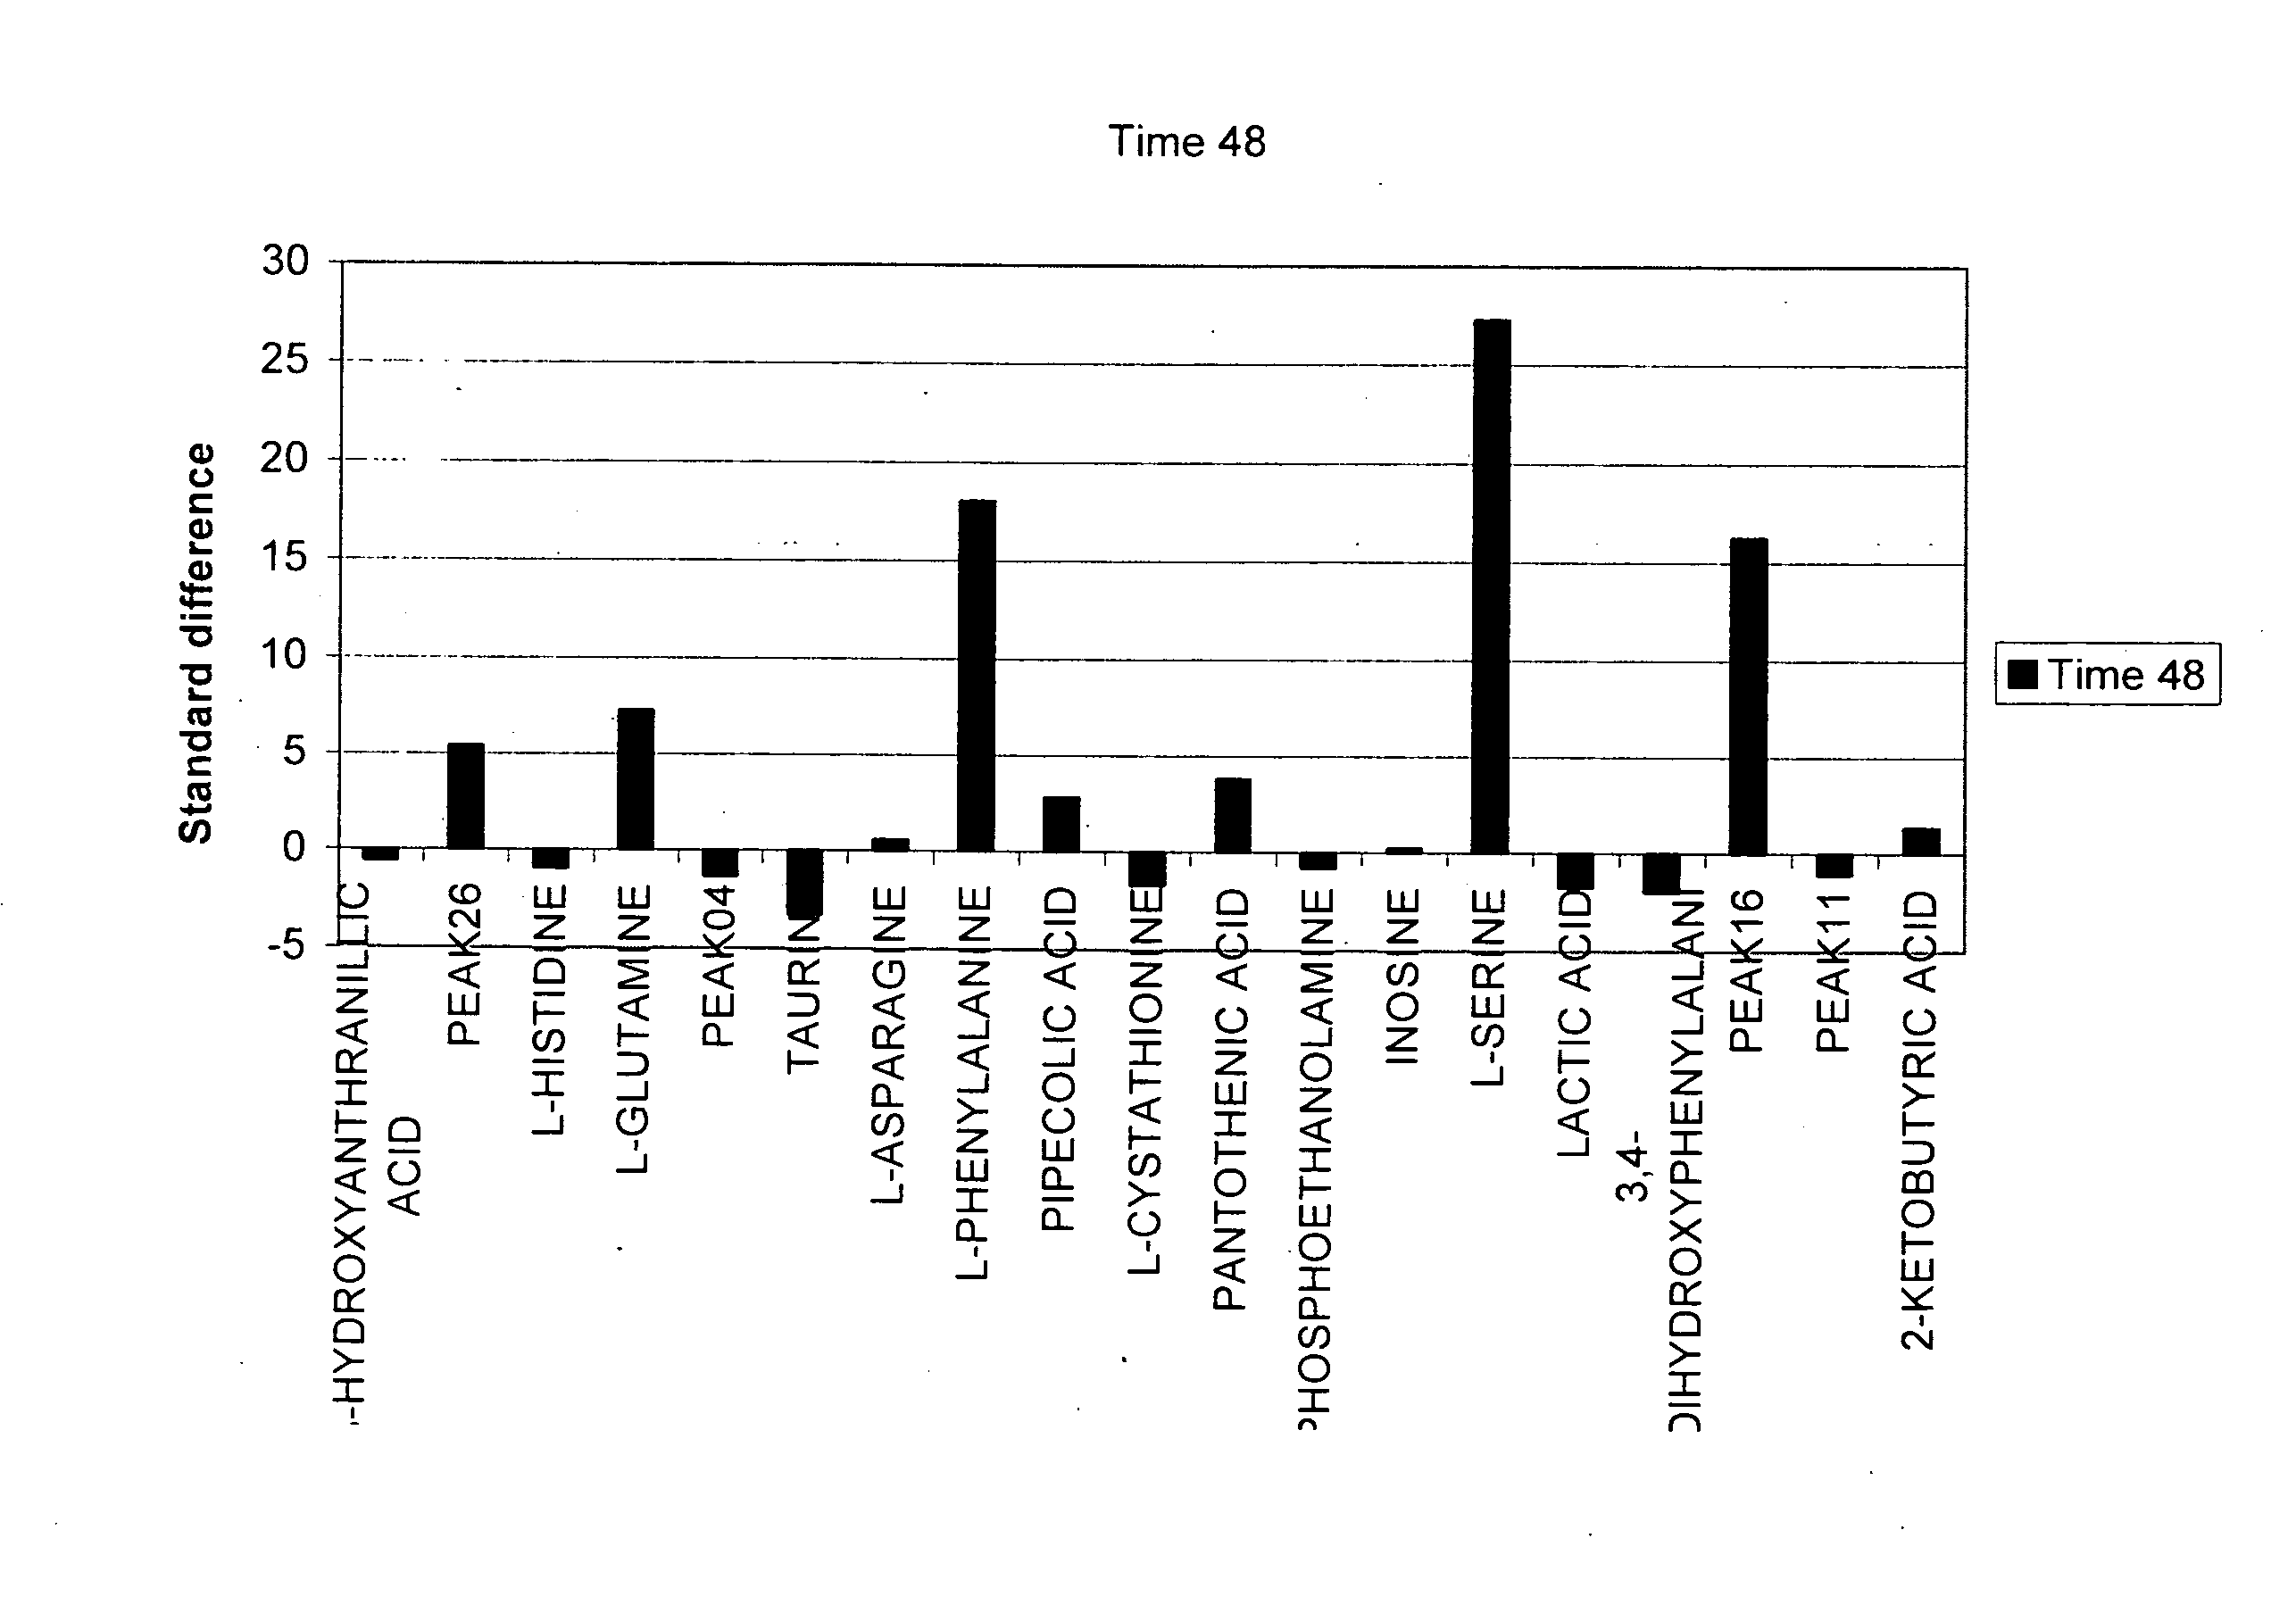
[0098]In this application of the invention, the targeted list of relative responses for peaks and peaks annotated as known compounds from Example 2 was analyzed to identify a subset that adhered to a predicted trend not evident in the dataset as a whole. The predicted trend of interest was a linear response across dose and a linear or quadratic response across time. Mathematical models representing the trend of interest were developed and each of the relative response peaks in the targeted list dataset was tested for adherence to the model. The subset of peaks that adhered to the designated trend is presented in Table II. Each of the compounds corresponding to the peaks in Table II is potentially implicated as having a role or being affected in acetaminophen induced liver toxicity.
TABLE IICompounds associated with the mode of action of acetaminophe...
PUM
| Property | Measurement | Unit |
|---|---|---|
| time | aaaaa | aaaaa |
| time | aaaaa | aaaaa |
| time | aaaaa | aaaaa |
Abstract
Description
Claims
Application Information
 - R&D
- Intellectual Property
- Life Sciences
- Materials
- Tech Scout
- Unparalleled Data Quality
- Higher Quality Content
- 60% Fewer Hallucinations
Browse by: Latest US Patents, China's latest patents, Technical Efficacy Thesaurus, Application Domain, Technology Topic, Popular Technical Reports.
© 2025 PatSnap. All rights reserved.Legal|Privacy policy|Modern Slavery Act Transparency Statement|Sitemap|About US| Contact US: help@patsnap.com


