Entertainment venue data analysis system and method

Inactive Publication Date: 2006-08-31
NERENHAUSEN MARK +3
View PDF14 Cites 111 Cited by
  • Summary
  • Abstract
  • Description
  • Claims
  • Application Information

AI Technical Summary

Benefits of technology

[0016] The present invention provides a system and method for entertainment venues to harness their box office and patron data to maximize revenues and provide entertainment and other products that satisfy patron preferences and also meeting organizational objectives. The present invention comprises software applications that process box office ticket sales data for entertainment events to track and analyze the geographical distribution of event patrons, patron market penetration in the relevant population, buying patterns, purchase preferences, pricing tiers, ticket sales patterns, analysis of sales trends by 
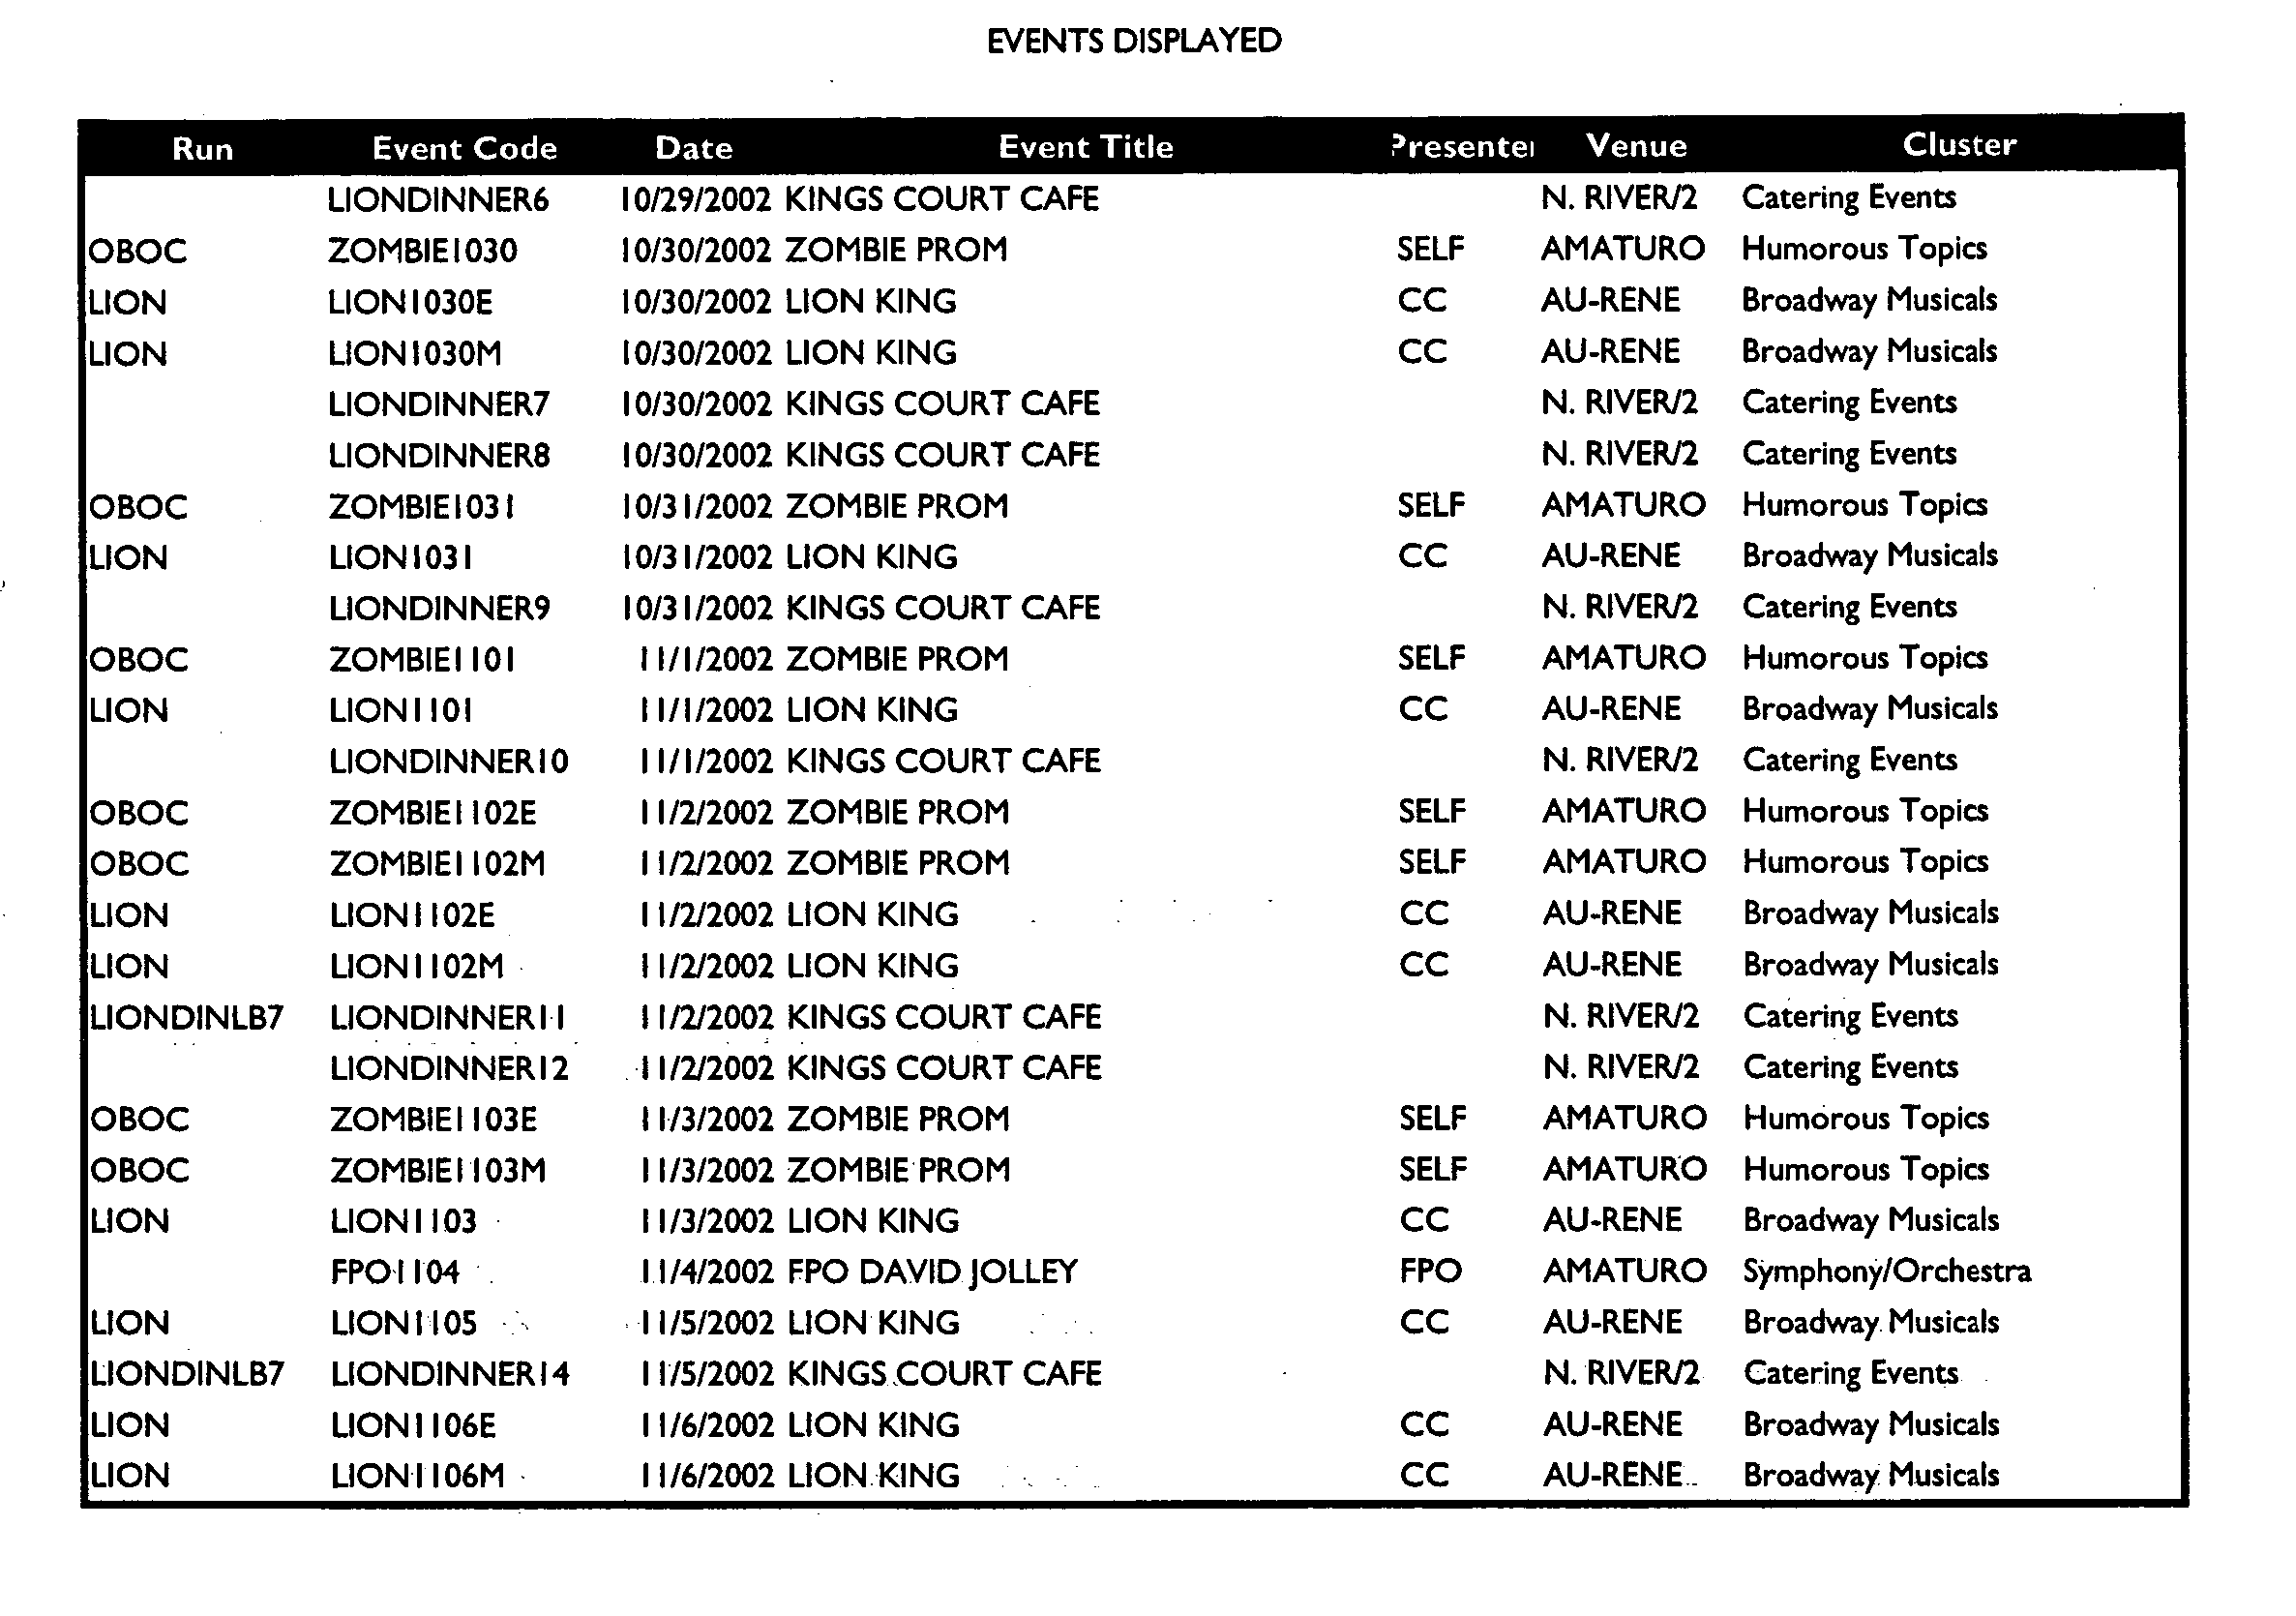
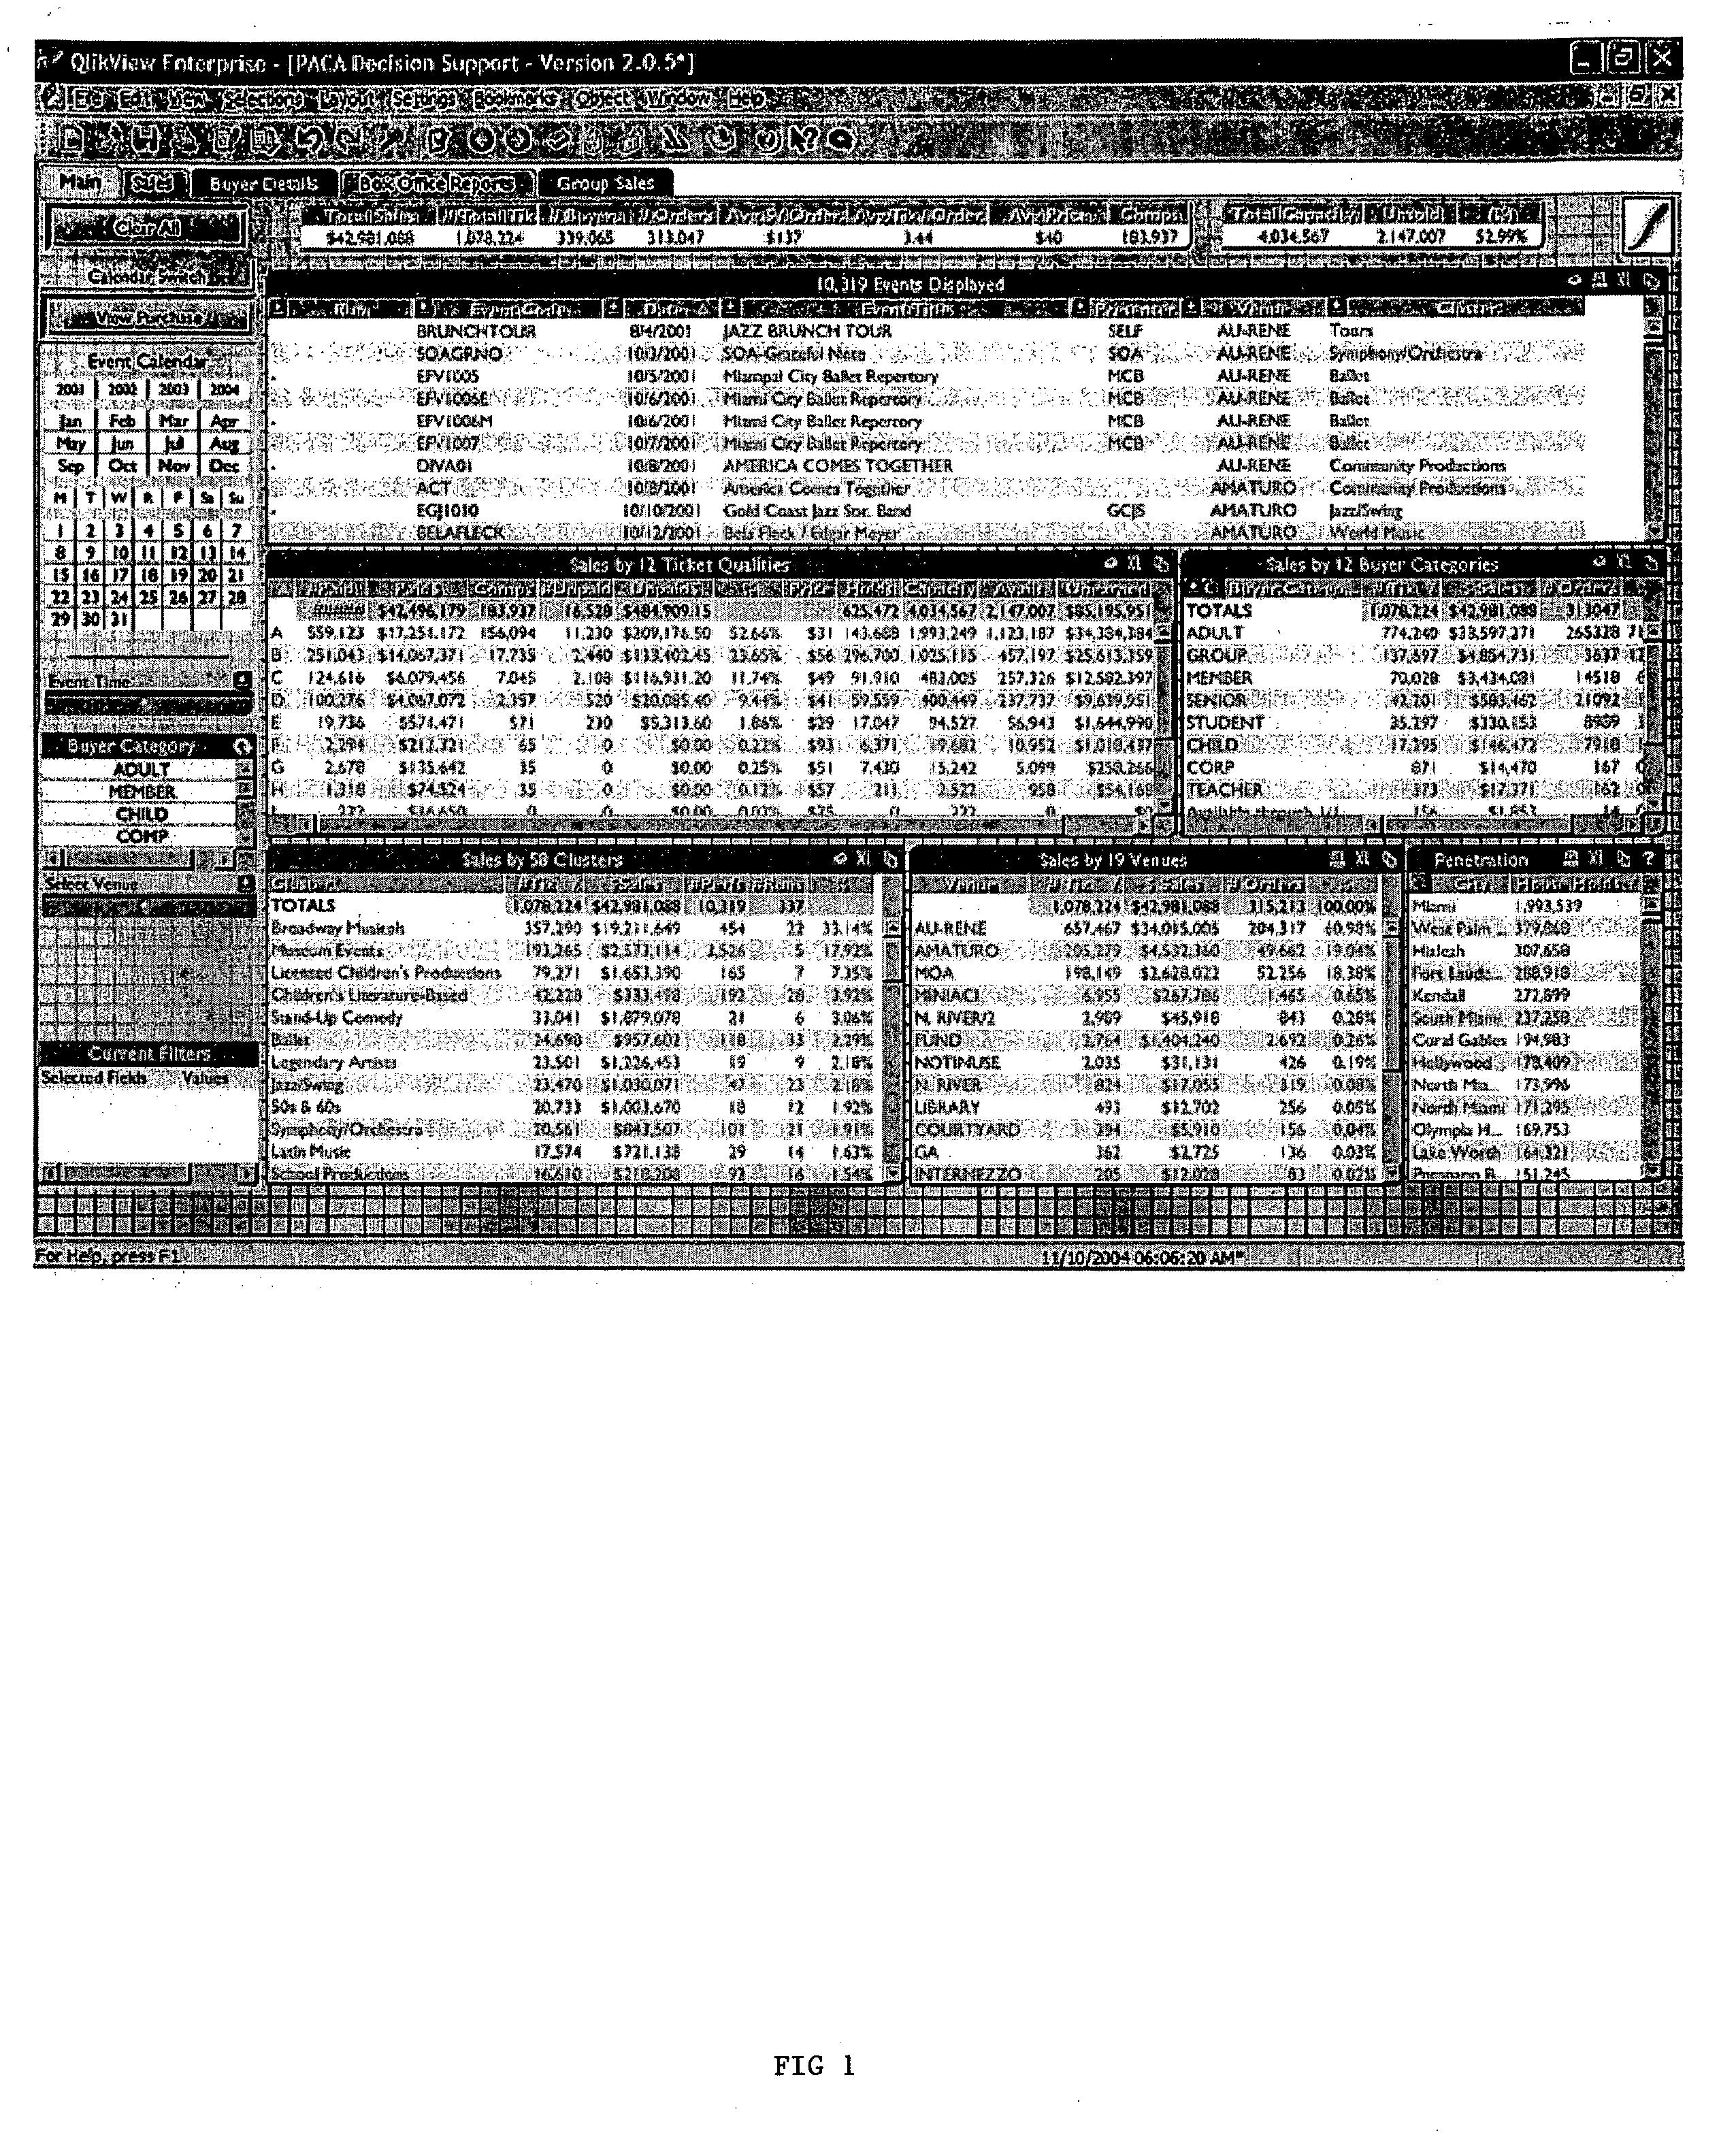
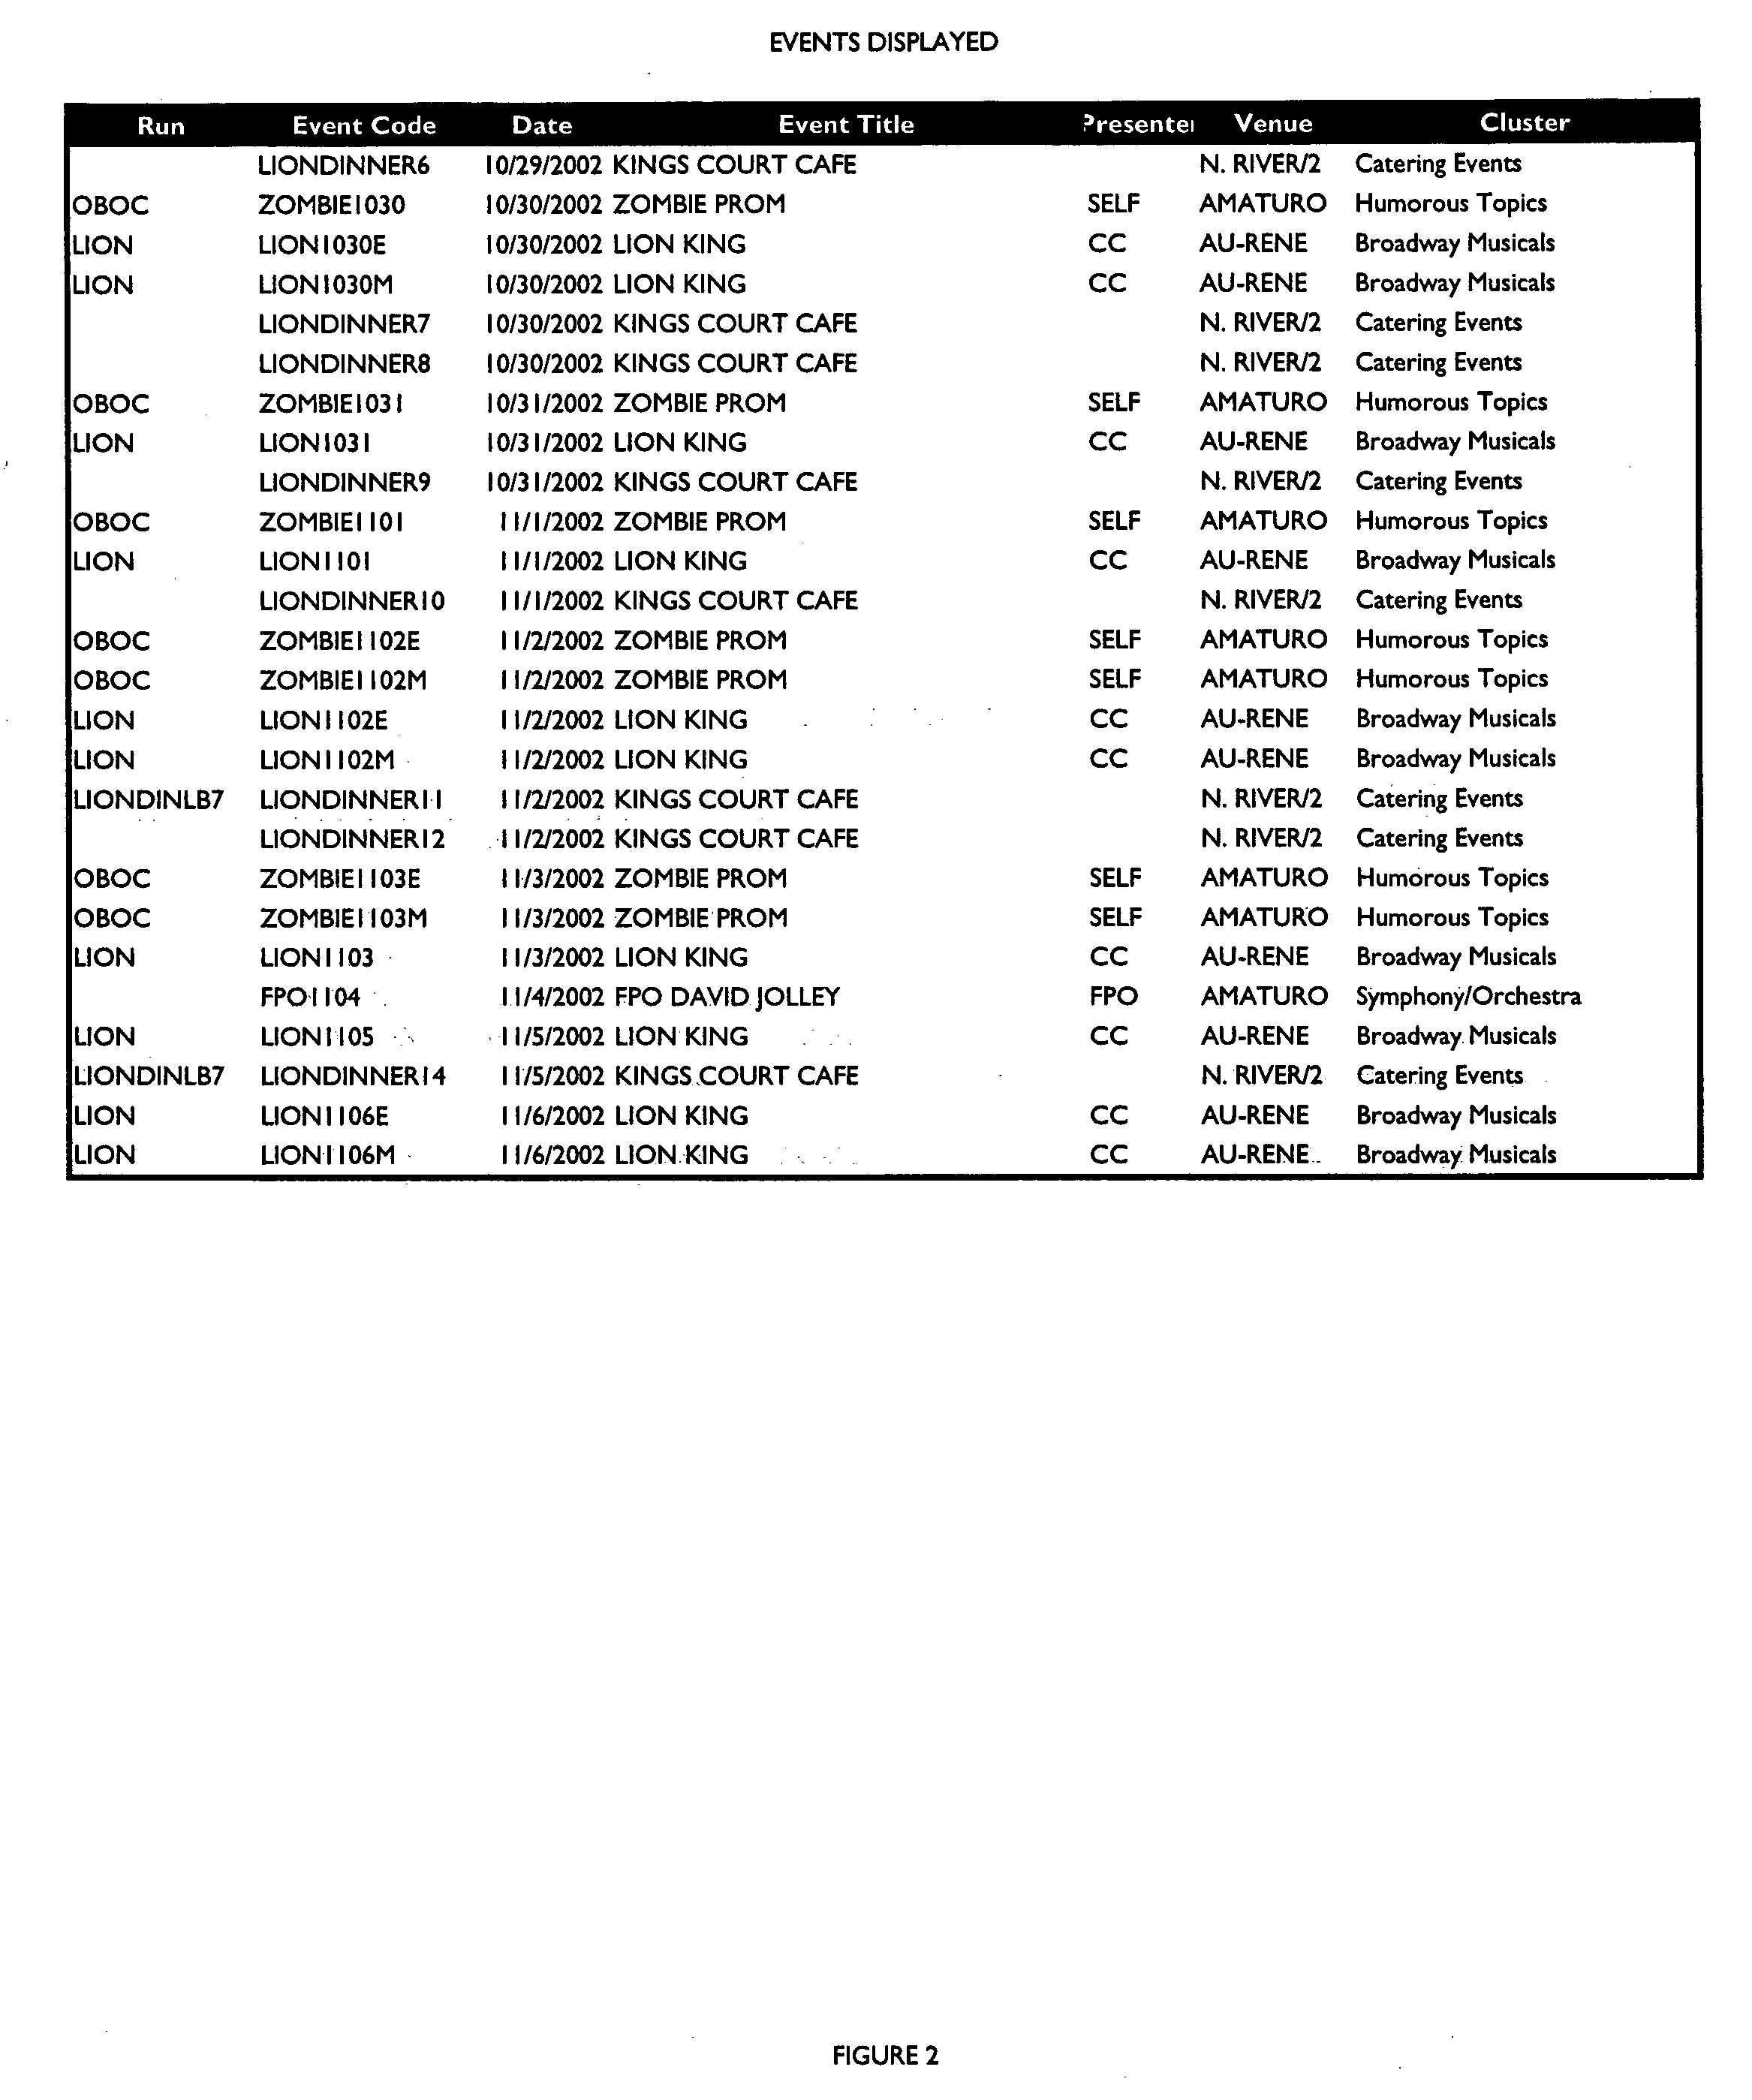
programming categories or “clusters,” and analysis of patron crossovers between clusters, among other analytics specifically applied to the actual entertainment venue. Users of the system, namely, entertainment venue management personnel, interact with the system via the system graphical user interfaces of which there are several forms, including: (i) an executive view customized for use by executive management providing overall financial summaries, mission critical analysis, productivity analytics and event portfolio analysis; (ii) a market view customized for marketing personnel providing marketing summaries by programming cluster, sales curves, market trigger analytics and performance analytics; and, (iii) a sales view customized for use by sales personnel providing financial summaries, mission critical analytics, sales channel analytics and sales forecasts. The graphical user interfaces, referred to as the “dashboard,” can present data in tabular form and preferably in the form of charts, graphs, and other graphical images and customized reports can be generated. The system enables more effective and efficient marketing and sales of entertainment events by providing tools to identify purchasing patterns as influenced by various factors and optimize marketing and sales efforts based on such patterns. In a preferred embodiment, the invention utilizes associative query logic database technology to provide more effective data harnessing, eliminating the need for online analytic processing (OLAP) cubes or the need for a data warehouse. A data cloud, as opposed to OLAP cubes, eliminates redundancy, hierarchies and aggregation. This permits users to analyze data based on user customized criteria more quickly and less expensively than traditional relational database technology, and data from disparate sources and systems is easily integrated.
[0017] The data cloud is a non-redundant, non-pre-aggregated associative database that resides in the computer's primary memory. Because the data is not pre-aggregated, it is also possible to analyze and interact with the “data cloud” from any piece of data, at any level, and move in any dimension from there. Reverse answers to queries are also producible. Because data can be pulled from any source, it is simple to combine and interact with business information from multiple sources, reducing the need to gather data from multiple voluminous reports.
[0019] In a relational database, records are broken apart to reduce redundancy and key fields are used to put the record back together at the same time they are used. Associative databases, by contrast, create a database as data is loaded from various data sources, requiring significantly less space and allowing the user maximum flexibility and information when working with the database. The system's database structure also supports variable group and drill down charting functions, whereby charting of data can be easily done for each variable group specified (such as by customer, time period, product or other variable groups). Drill down groups are sequential groups of data that can be displayed in a chart sequentially as chart specifications are narrowed or broadened. For example, a chart showing sales over a year may show bars for each month's sales. If a single month is selected the chart displays sales broken down for the four weeks in the selected month, or the individual customers that made purchases during such period, or other desired data criteria. The system allows any variables to be grouped together and variables within the groups can be changed easily without requiring modifications to the chart definition as is the case with defined hierarchy structured databases. Additionally, different system user access levels can be established. Users can make system data queries easily by clicking on data values or clicking within chart representation of data.

Problems solved by technology

Most systems for data management focus on simplifying data input and storage rather than ease of data interpretation.

Method used


Image

  • Entertainment venue data analysis system and method
  • Entertainment venue data analysis system and method
  • Entertainment venue data analysis system and method

Examples


Embodiment Construction

[0036] According to a preferred embodiment hereof, the present invention is a system and method for analyzing entertainment venue box office data for improved venue management. The system comprises conventional computer hardware, including a main processor, a display device, such as a monitor or printer, an input device such as a keyboard, and a data storage device, including compatible system software applications run for compiling and manipulating event box office consumer and sales data as well as third party sourced consumer demographic data, including classification of event data into a plurality of event-type clusters and correlation of consumer data and event cluster data, performing calculations and displaying graphically the results of such data manipulations and calculations. The invention is not limited to any particular form of computer hardware and can be adapted for use in various hardware embodiments without departing from the scope of the invention. In a preferred em...


PUM


Abstract

A system and method for analyzing entertainment venue data for improved venue management, comprising conventional computer hardware and including compatible software application for compiling and manipulating event consumer and sales data as well as third party consumer demographic data, including classification of event data into a plurality of event-type clusters, correlation of consumer data and event cluster data, and performing manipulations of said data in response to user queries and displaying query results. In a preferred embodiment, associative query logic database technology is used to create a data cloud of event venue consumer and sales data as well as third-party sourced demographic data.

Description

BACKGROUND OF THE INVENTION [0001] 1. Technical Field [0002] The field of this invention is business intelligence. The present invention relates generally to methods and systems for marketing and sales data analysis for commercial ventures. More specifically, the present invention is an entertainment venue data analysis system and method. [0003] 2. Background [0004] Effective use of business data is very important to the successful management of any business. This is no less true for management of entertainment venues such as indoor and outdoor sports arenas, musical and play theaters, performing arts centers, concert halls, stadiums and similar venues. Business data takes many forms, such as financial / sales data, product data, customer data and marketing efforts data, among others. These various types of data are usually stored in different ways, such as one or more databases, spreadsheets, word processing documents, web pages and other forms. [0005] Entertainment venues, such as i...

Claims


Application Information

Patent Timeline
IPC IPC(8): G06Q30/00
CPCG06Q30/02G06Q30/0202G06Q30/0241G06Q30/0252
Inventor NERENHAUSEN, MARKCARTER, CATHERINEGIBSON, TAMMYRICHMOND, JORDAN GROSS
Owner NERENHAUSEN MARK
Why Eureka
Try Eureka