
System and method of predicting future behavior of a battery of end-to-end probes to anticipate and prevent computer network performance degradation

a technology of end-to-end probes and prediction methods, applied in the direction of instruments, data switching networks, digital transmission, etc., can solve the problems of inability to predict the future behavior of end-to-end probes, inability to predict the reliability and availability of reported components, and inability to implement probing or predictive statistical modeling

Inactive Publication Date: 2005-05-05
IBM CORP
View PDF3 Cites 32 Cited by
  • Summary
  • Abstract
  • Description
  • Claims
  • Application Information

AI Technical Summary

Benefits of technology

[0025] A large number of predictive modeling techniques are available in the statistics literature. The present invention focuses on a specific technique called the Generalized Additive Models (GAM), as described by T. J. Hastie and R. J. Tibshirani in Generalized Additive Models (Chapman and Hall, 1990), hereafter “H&T1990”. This technique enables one to discover and describe the functional dependency of the expected value of the response (e.g. the values returned by EPP probes) in terms of predictor variables (e.g. other EPP probe values and network node data). Additive models are not new, but have been developed over the last ten or fifteen years. They provide a methodology—a largely automated methodology—for analysis of data, in this case the dependence of the expected value of a probe response on available predictor variables. The notion of an additive model—that is, the analysis is limited to the linear sum of variables—is made more powerful by allowing variables to be replaced in the linear sum by transformations of the variables, where the most useful transformation of a particular variable is determined automatically by operation of the additive model technique itself. What the present invention has discovered is that by restricting analysis to additive models—which place a reduced computational burden on the system, in contrast to more accurate but more complex analytical techniques—useful results can be obtained, i.e. a workable prediction horizon coupled with a low rate of false alarms. It is this which the inventors claim is new and non-obvious.
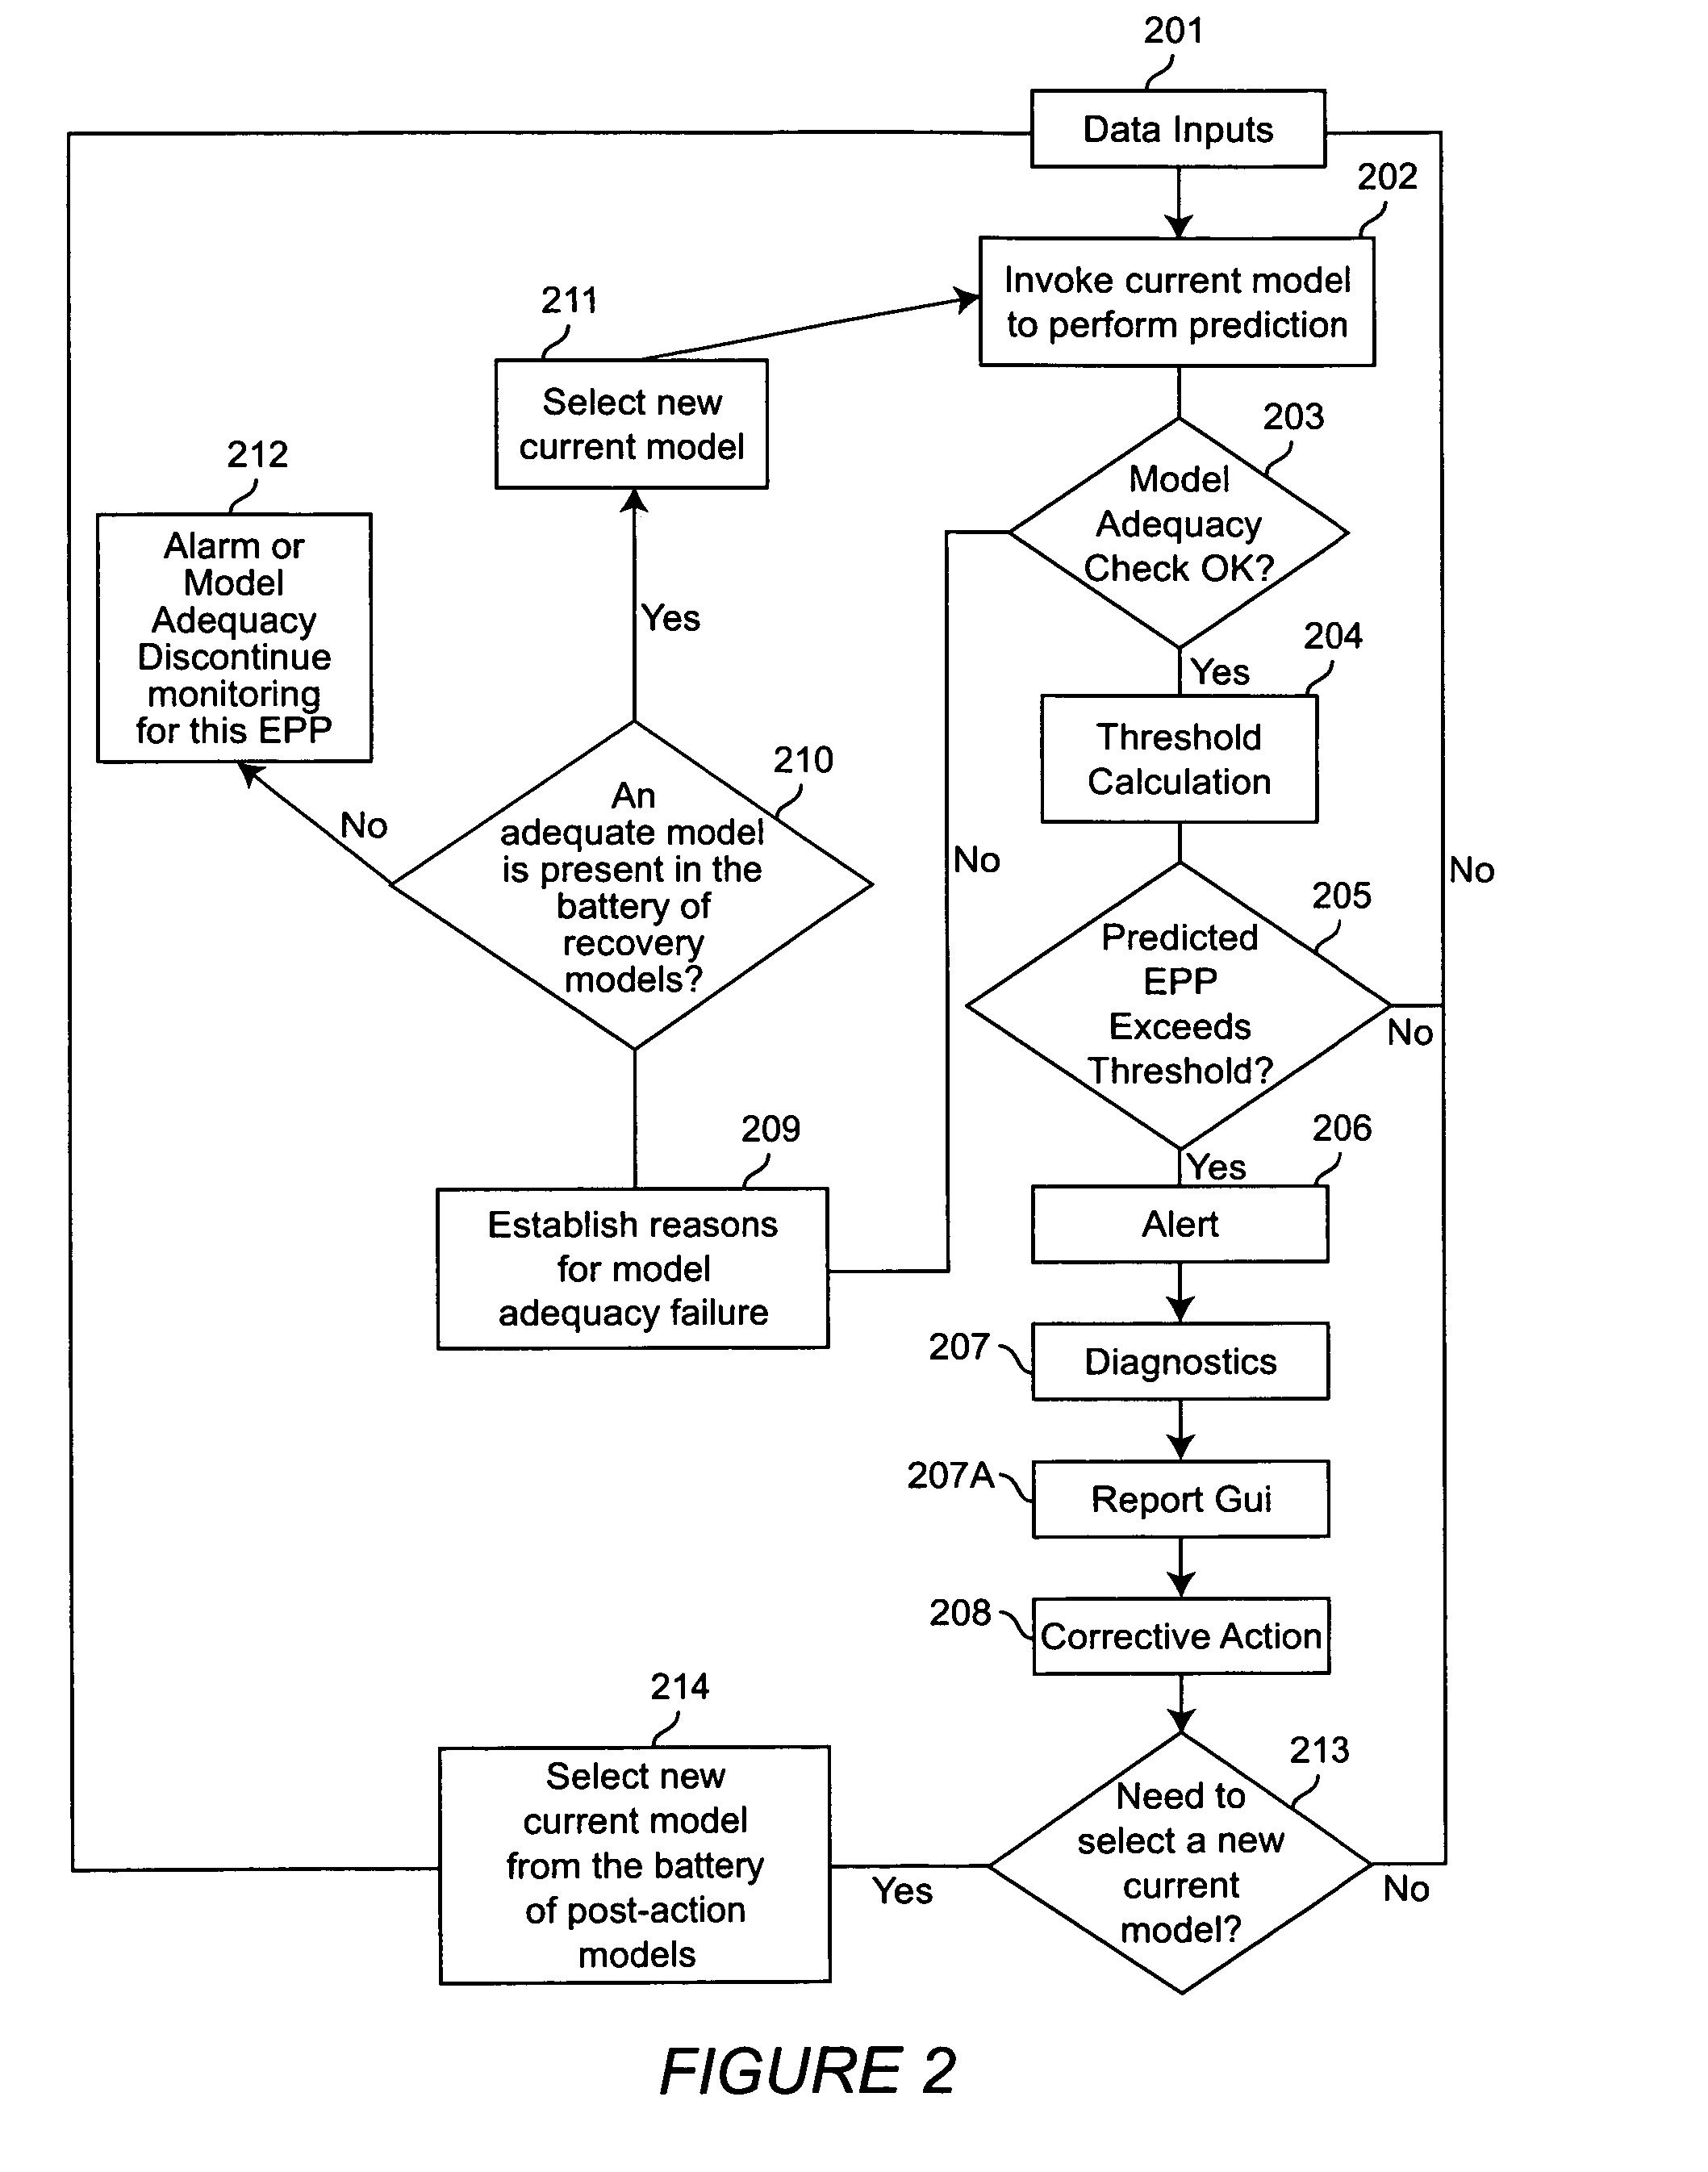
[0035] The method for selecting alarm thresholds according to the invention assures a predictably low rate of false alarms. The thresholds will generally depend on factors such as time of day and day of the week, and on the standard deviation of the probe response time forecast. Data is collected in real time, using a pre-computed forecasting model to produce forecasts of future probe response times. Alarms are triggered based on thresholds that are mostly pre-computed, with adjustments based on standard deviation of forecasts made in real time. Following an alarm, the invention produces a graphical summary that enables the user to identify the cause of a problem. In some cases, the system could respond automatically to an alarm, e.g., by allocating more resources to a weak spot in the network. The invention also provides an automated diagnosis in terms of the components of the underlying predictive model. Furthermore, the invention is capable of maintaining a low rate of false alarms, below a level that would otherwise cause a substantial disturbance in network operation.
[0037] The subject invention differs from the prior art in its use of advanced statistical methodology to build a predictive model based on a combination of data normally generated by network nodes, results of a battery of probes and profile curves reflecting expected (e.g., based on recent history) response times corresponding to this battery of various times of day, days of the week, month or year. Thus, the invention is capable of detecting an upcoming network problem even though there are no visible problems at the current point in time. The invention enables one to see, for example, an upcoming problem on a given server from the data recorded at a different node, such as a local area network (LAN) router. It also enables one to detect the presence of longer term trends in the data.

Problems solved by technology

Managing the delivery of information services in distributed computing environments continues to be a tremendous challenge, even after more than a decade of experience.
However, user experience can be at variance with reported component reliability and availability.
Complexity arises from many sources: rapidly changing technologies; new software applications; changes in business models; and geographically dispersed employees.
No probing or predictive statistical modeling is implemented.
The system does not implement active probing and the alerts it issues are not based on predicted behavior of probes that reflect user experience.
No probing or predictive modeling is implemented.
There is no predictive modeling or automated signal triggering mechanism.
No probing or predictive statistical modeling is implemented.
However, none of these prior art approaches produces a predictive model using routinely provided network data responsive to a battery of probes, the battery being designed to reflect user experience, where the object is to predict the future behavior of this battery of probes, with thresholds set in such a manner that false alarms can be limited to a predictably low rate, to anticipate upcoming degradation in the network as measured by future performance of the battery of probes.

Method used


Image

  • System and method of predicting future behavior of a battery of end-to-end probes to anticipate and prevent computer network performance degradation
  • System and method of predicting future behavior of a battery of end-to-end probes to anticipate and prevent computer network performance degradation
  • System and method of predicting future behavior of a battery of end-to-end probes to anticipate and prevent computer network performance degradation

Examples


Embodiment Construction

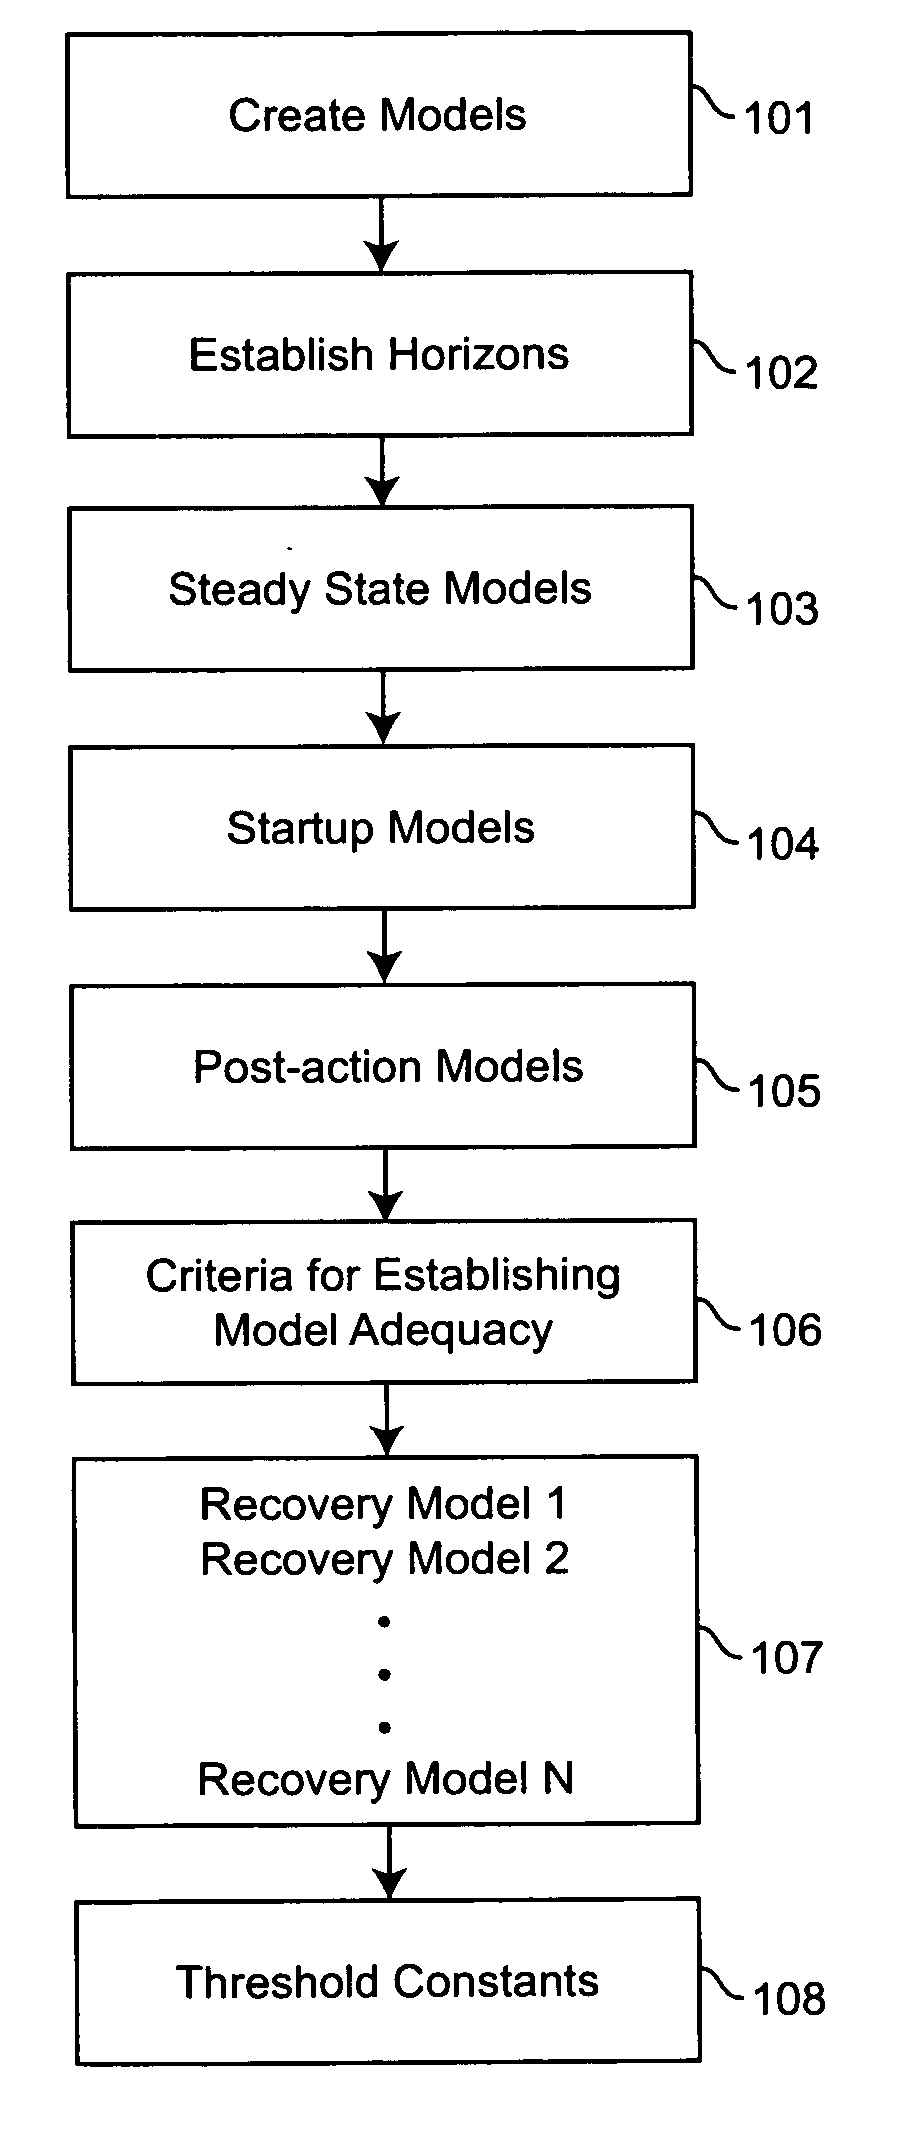
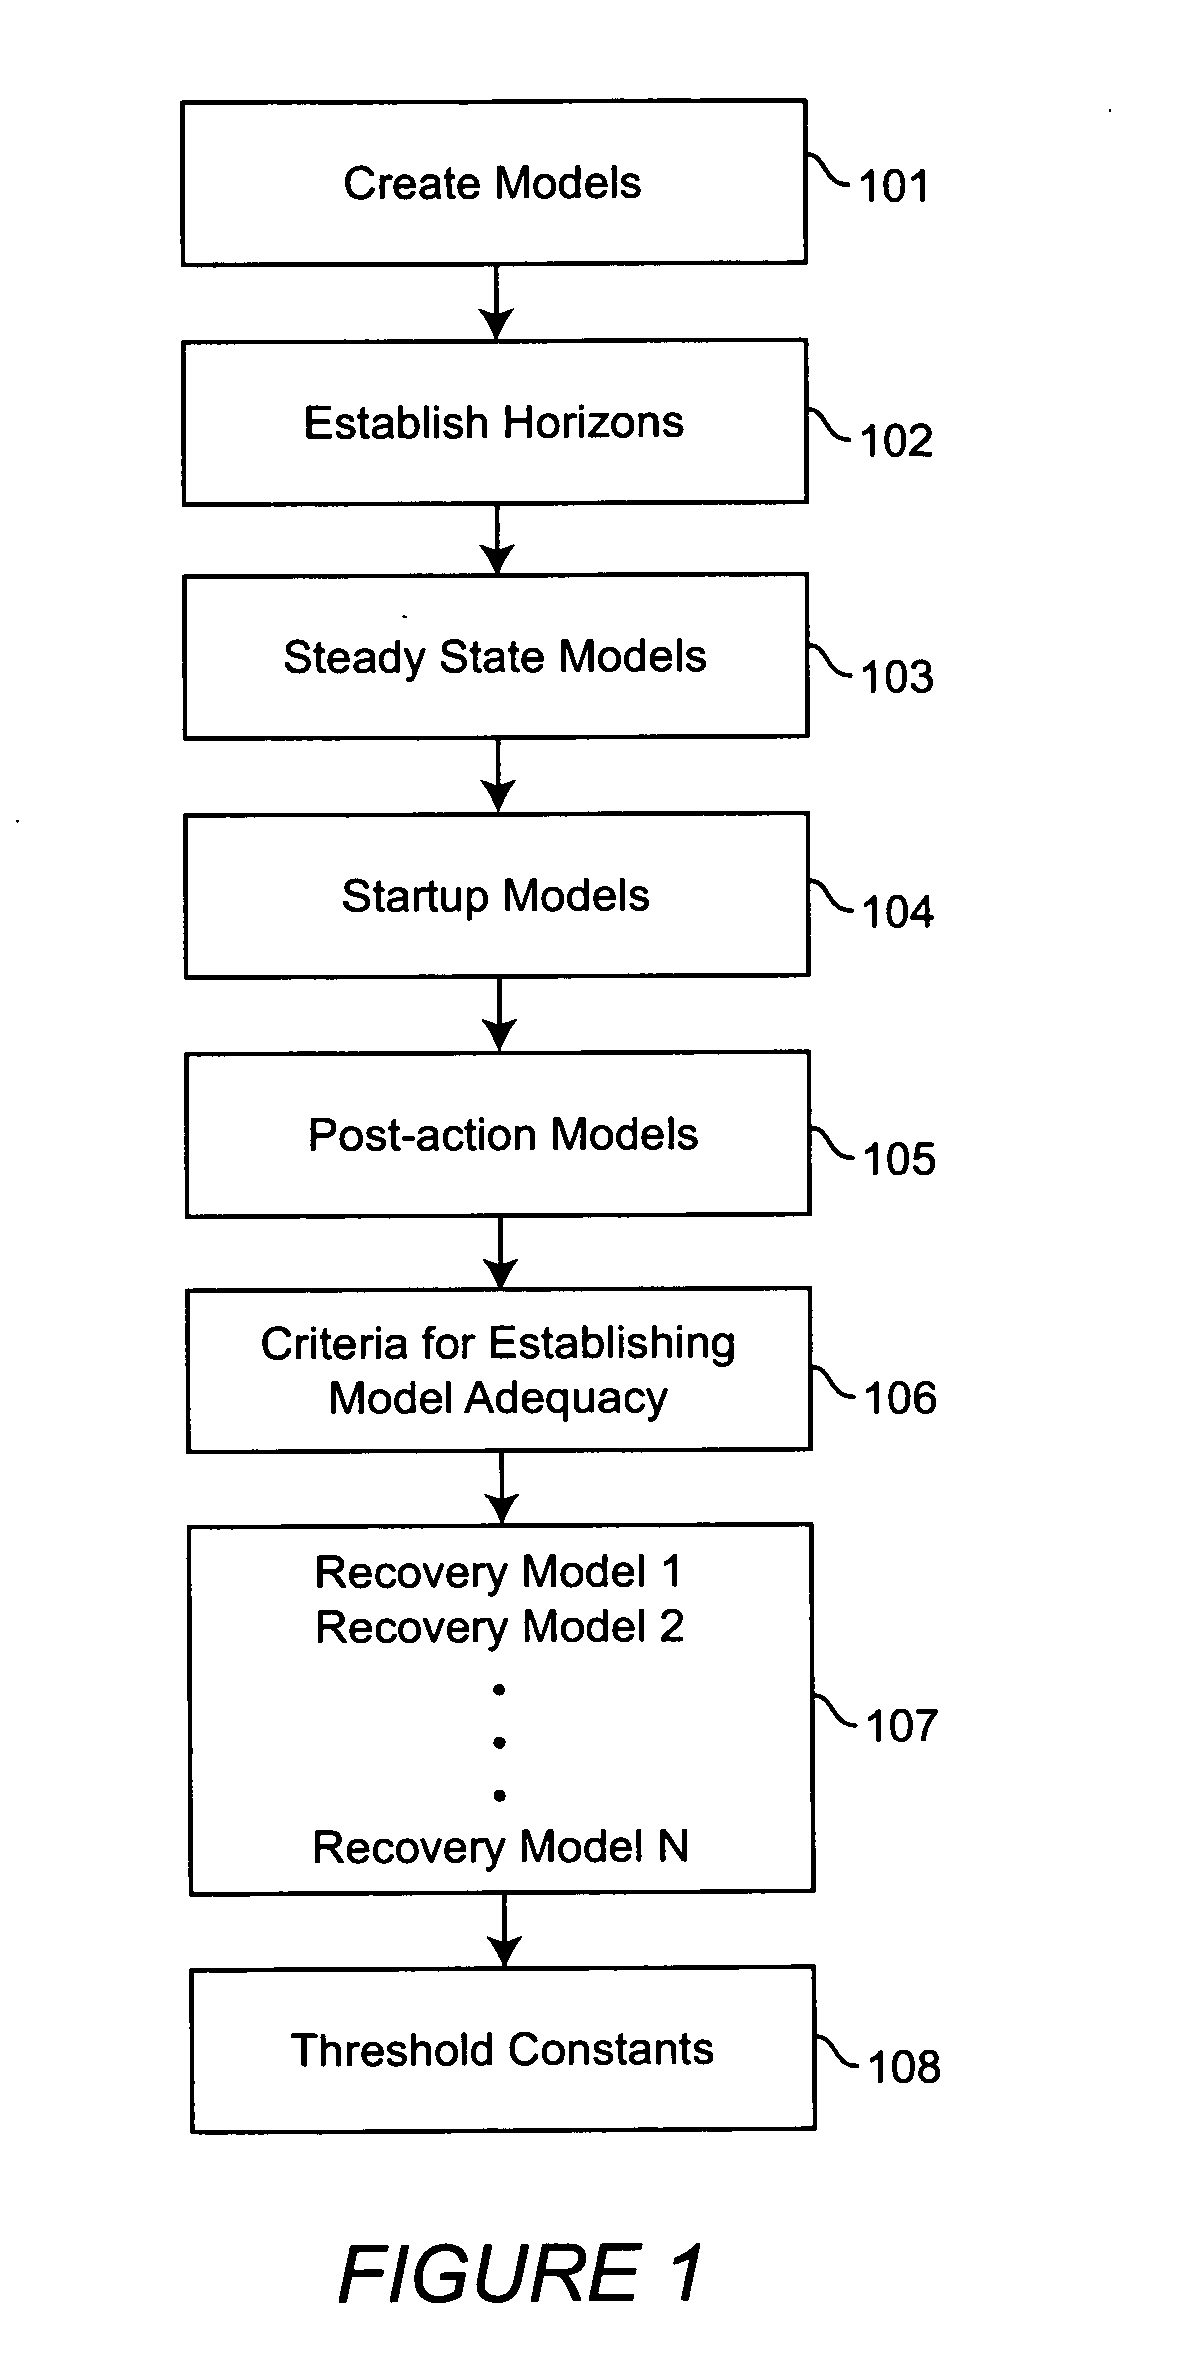
[0042] Referring now to the drawings, and more particularly to FIG. 1, there is shown a flow chart for design of a predictive model. In module 101 there are created the statistical models (derived by using GAM's) that connect the EPP characteristics and the predictors. Module 102 establishes the prediction horizons for various EPP probes. This requires coordination with module 101, so as to make sure that the horizons are realistic (i.e., the model is capable of predicting for this horizon). In module 103 the Steady State models are derived: these are full scale models that use historic data so as to maximize predictive capability; it is assumed that the relevant data could be obtained from any depth in history. Module 104 deals with the derivation of Startup models: these are used when the amount of historic information is limited. For example, because of a server re-start 0.5 hours ago, the historic server data that is more than 0.5 hours old is considered irrelevant and is not pe...


PUM


Abstract

A diagnostic system in which, at every point in time, a forecast is made of the future response times of each EPP (End-to-end Probe Platform) probe in a battery of probes. Thresholds are established in terms of the distribution of future EPP values. The theory of Generalized Additive Models is used to build a predictive model based on a combination of a) data normally generated by network nodes, b) results of a battery of probes and c) profile curves reflecting expected response times (i.e. based on recent history) corresponding to this battery for various times of day, days of week, month of year, etc. The model is pre-computed, and does not have to be dynamically adjusted. The model produces, at regular intervals, forecasts for outcomes of various EPP probes for various horizons of interest; also, it produces thresholds for the respective forecasts based on a number of factors, including acceptable rate of false alarms, forecast variance and EPP values that are expected based on the recorded history. The system is capable of maintaining a pre-specified low rate of false alarms that could otherwise cause a substantial disturbance in network operation.

Description

BACKGROUND OF THE INVENTION [0001] 1. Field of the Invention [0002] The present invention generally relates to diagnostic tools for distributed computer networks and, more particularly, to a diagnostic system that uses advanced statistical methodology to build a predictive model of future behavior of a battery of probes that aids in detecting an upcoming network problem and in detecting the presence of longer term trends in the data. [0003] 2. Background Description [0004] In the course of normal operation, a distributed computer network produces a large amount of data related to various nodes, such as servers and routers. In addition, a series of probes are deployed to submit pre-assigned tasks to various nodes of the network, and the response times of these tasks are recorded. [0005] Managing the delivery of information services in distributed computing environments continues to be a tremendous challenge, even after more than a decade of experience. [0006] Nevertheless, understand...

Claims


Application Information

Patent Timeline
IPC IPC(8): G06F15/173H04L12/24H04L12/26
CPCH04L41/0681H04L41/142H04L43/12H04L41/5025H04L41/147H04L41/149
Inventor GLUHOVSKY, ILYAHOFFMAN, ALAN J.LEE, HERBERT M.YASHCHIN, EMMANUEL
Owner IBM CORP
Learn More