
Water body monitoring point optimization method based on hypothesis testing method

A technology of hypothesis testing and optimization methods, applied in material inspection products, testing water, etc., can solve the problems of high optimization and evaluation cost, poor accuracy, long evaluation cycle, etc., to solve the problem of high calculation cost, convenient operation and fast processing speed. Effect

Active Publication Date: 2022-07-15
SHENZHEN ACAD OF ENVIRONMENTAL SCI +1
View PDF10 Cites 0 Cited by
  • Summary
  • Abstract
  • Description
  • Claims
  • Application Information

AI Technical Summary

Problems solved by technology

[0004] The present invention overcomes certain limitations, long evaluation period, poor accuracy, high cost of optimization and evaluation in the evaluation method of monitoring points based on the evaluation model in the prior art The shortcomings of the water body monitoring point optimization method based on the hypothesis testing method are provided.

Method used


Image

  • Water body monitoring point optimization method based on hypothesis testing method
  • Water body monitoring point optimization method based on hypothesis testing method
  • Water body monitoring point optimization method based on hypothesis testing method

Examples


Embodiment 1

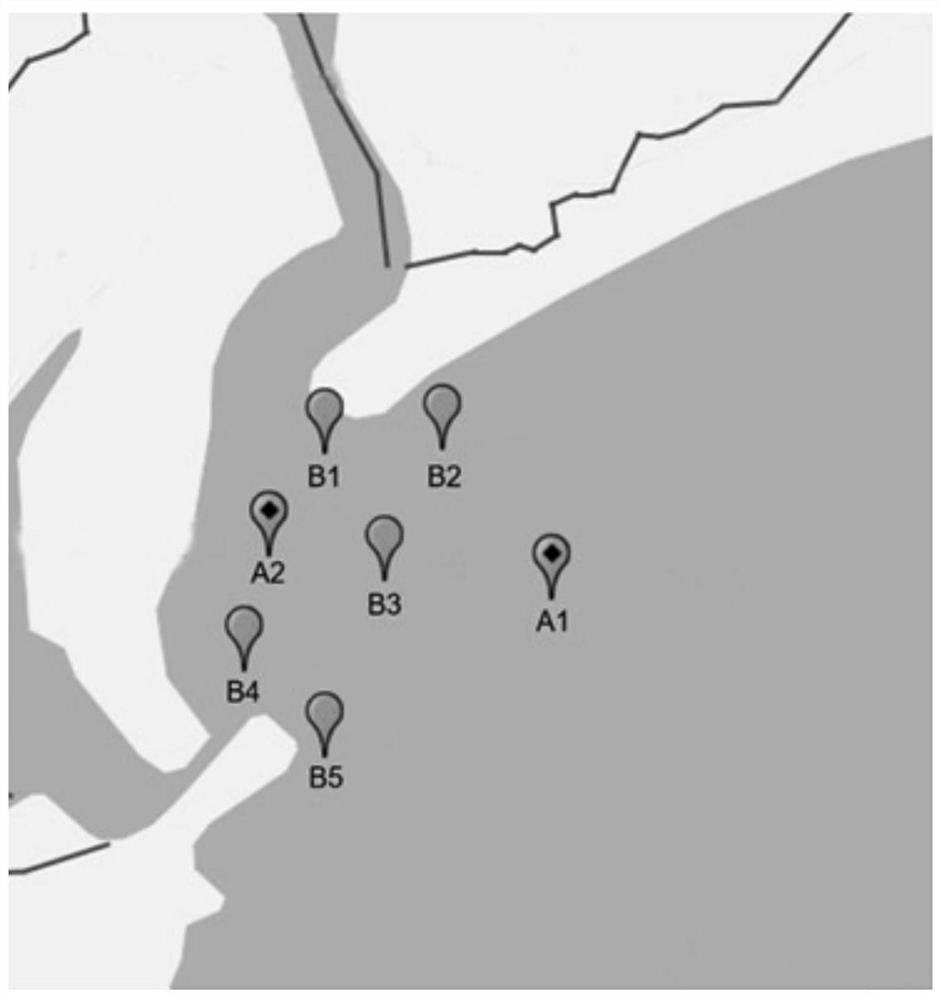
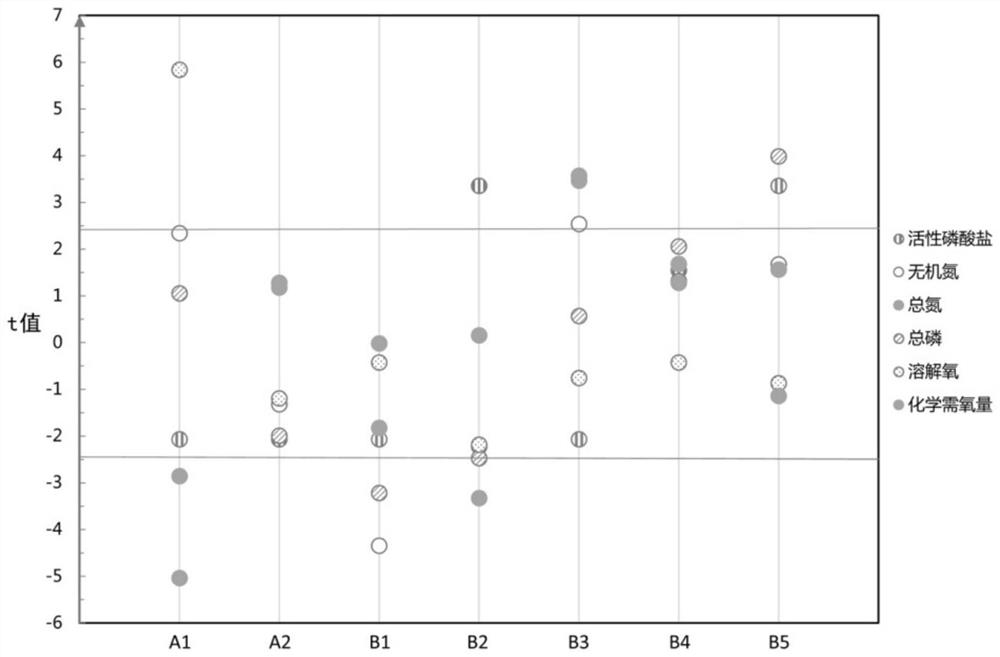
[0066] Inshore Sea Area A, with an area of ​​7.433km 2 , the water depth is 10-50m, and it is a semi-closed bay. Among them, A1 and A2 are the original monitoring points of A in the coastal waters, that is, the main monitoring points; B1, B2, B3, B4 and B5 are the auxiliary monitoring points (see figure 1 ). The monitoring data of a certain month is shown in Table 2: According to the decision-making model optimized for water monitoring points, the calculation results of various detection indicators of all monitoring points are shown in Table 3.

[0067] Table 2 The water quality test results of each monitoring point in the coastal sea area A

[0068]

[0069] Table 3 The t value table of the water quality test results of each monitoring point in the coastal sea area A

[0070]

[0071]

[0072] When the confidence level is 95%, according to Table 1, the critical value of the acceptance domain of the water quality test results of the coastal waters A is -2.447≤t≤2.4...

Embodiment 2

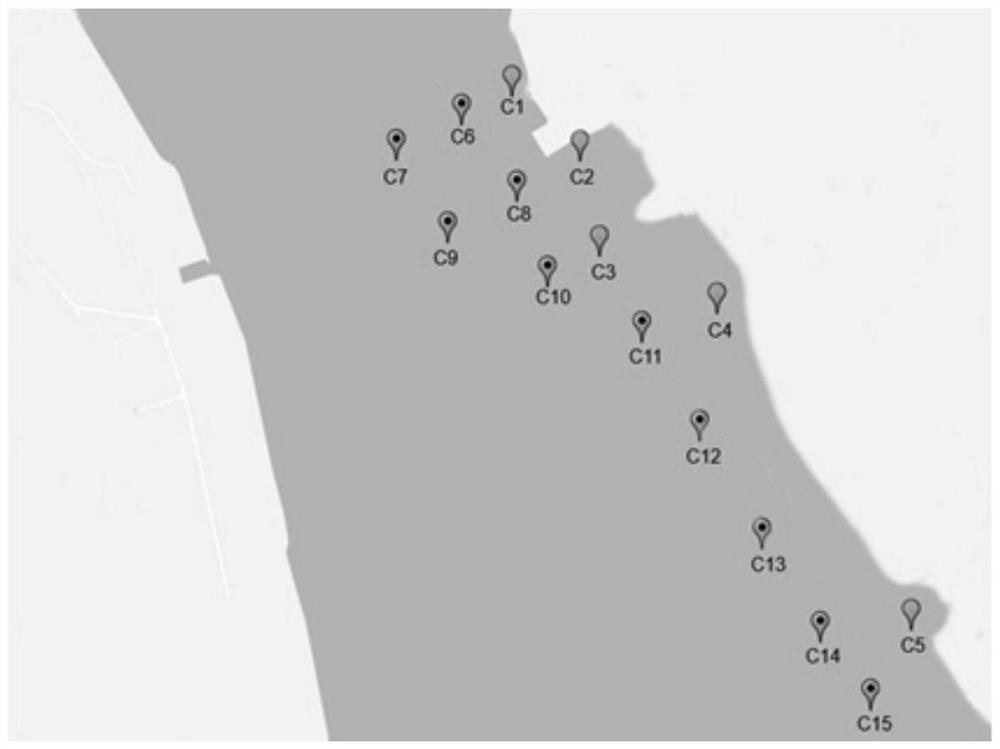
[0075] River B, with an area of ​​12.86km 2 , according to the direction of water flow and tributaries, set up 15 monitoring points, marked as C1-C15 (see image 3 ), among which: C1-C5 are the main monitoring points, and C6-C15 are auxiliary monitoring points. The monitoring data of a certain month is shown in Table 4. According to the decision-making model of water monitoring point optimization, the calculation results of various detection indicators of all main monitoring points and auxiliary monitoring points are shown in Table 5.

[0076] Table 4 The water quality test results of each monitoring point in River B

[0077]

[0078]

[0079] Table 5 The t value table of the water quality test results of each monitoring point in River B

[0080] point number total nitrogen total phosphorus dissolved oxygen Cod C1 -1.26162483 -0.076181338 -1.116630883 1.274804557 C2 -3.358202535 -0.6312168 -3.221754678 2.778787462 C3 -2.14439439 ...


PUM


Abstract

The invention discloses a water body monitoring point position optimization method based on a hypothesis testing method, and solves the problems of limitation, long period, poor accuracy, high cost and the like of an existing monitoring point position evaluation method. Comprising the following steps: selecting a water body area to be monitored; arranging a main monitoring point position and an auxiliary monitoring point position; taking the water body detection values of the main monitoring point position and the auxiliary monitoring point position as random samples, and performing hypothesis testing on the random samples one by one to determine whether the water quality condition of the main monitoring point position or the auxiliary monitoring point position can represent the water quality condition of the water body area to be monitored; the water quality condition of the main monitoring point position cannot be represented and is replaced by an auxiliary monitoring point position capable of representing the water quality condition of the water body; if the water quality conditions of the main monitoring point position and the auxiliary monitoring point positions cannot represent, new auxiliary monitoring point positions are arranged again, and the number of the required point positions is screened out. According to the invention, whether the water body monitoring points are representative can be rapidly judged; the method is fast in processing speed, high in accuracy, low in calculation cost and capable of processing a large number of samples.

Description

technical field [0001] The invention belongs to a water body monitoring point optimization method in the field of water ecological environment monitoring such as reservoirs, rivers, oceans, etc., in particular to a water body monitoring point optimization method based on a hypothesis testing method. Background technique [0002] The distribution of routine monitoring points for water bodies is an important task to ensure that the samples collected at the monitoring points are representative of the true values ​​of the water body area. Adjust the monitoring points and screen out representative monitoring points. The optimization of monitoring points can improve the representativeness of the real value of the water body area, and better reflect the quality status and pollution pressure of rivers, oceans and other water environments. [0003] For the setting and optimization of conventional monitoring points, first of all, it is necessary to set up monitoring points according ...

Claims


Application Information

Patent Timeline
Patent Type & Authority Applications(China)
IPC IPC(8): G01N33/18
CPCG01N33/1806Y02A20/152
Inventor 苑晨纪炘烨戴知广金兴良张华唐天均韦景明王蕊叶匡旻易绍庭陈美瑞陈鸿芳陈婷
Owner SHENZHEN ACAD OF ENVIRONMENTAL SCI
Learn More