Over-winter crop identification method and device
An identification method and crop technology, applied in the field of agricultural remote sensing, can solve problems such as high data quantity and quality requirements, human factor interference, and crop identification misclassification, and achieve the effect of improving accuracy, reducing misclassification and accurate extraction.
- Summary
- Abstract
- Description
- Claims
- Application Information
AI Technical Summary
Problems solved by technology
Method used
Image
Examples
Embodiment 1
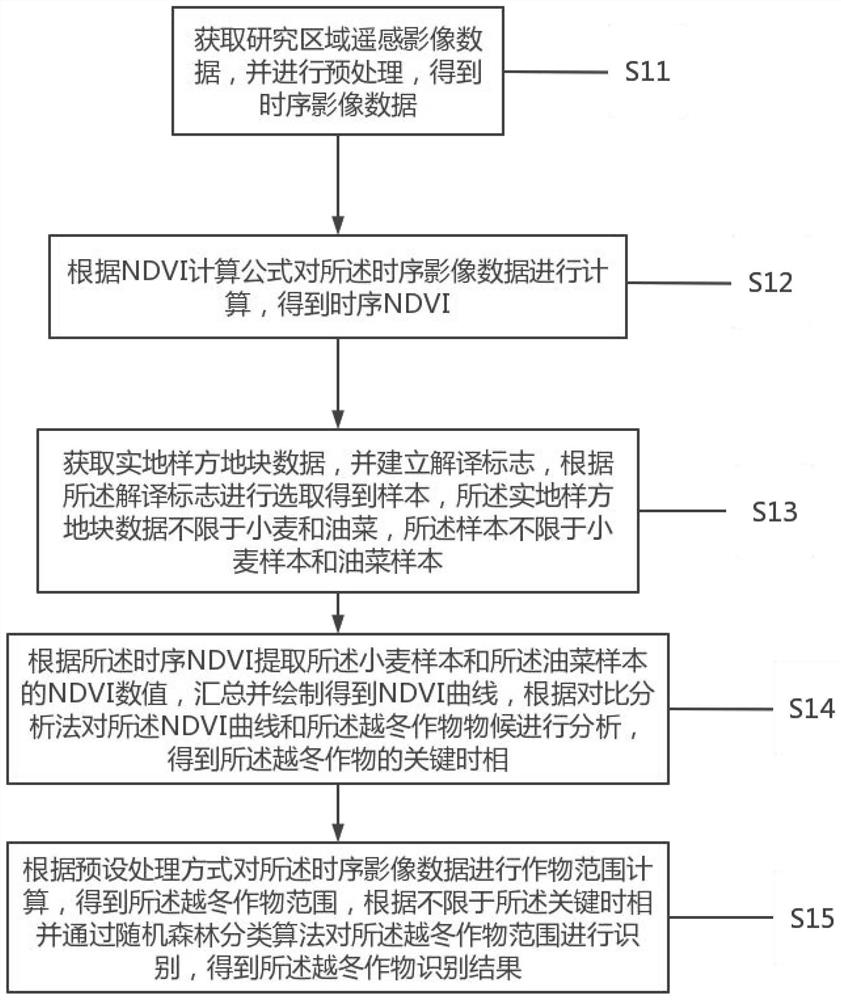
[0052] Such as figure 1 Shown, a kind of identification method of overwintering crops, comprises the following steps:
[0053] S11. Obtain remote sensing image data of the research area, and perform preprocessing to obtain time-series image data;
[0054] S12. Calculate the time-series image data according to the NDVI calculation formula to obtain the time-series NDVI;
[0055] S13. Obtain the data of the field quadrat plots, and establish an interpretation flag, and select samples according to the interpretation flags. The field quadrat plot data is not limited to wheat and rapeseed, and the samples are not limited to wheat samples and rapeseed sample;
[0056] S14. Extract the NDVI values of the wheat sample and the rape sample according to the time series NDVI, summarize and draw the NDVI curve, analyze the NDVI curve and the overwintering crop phenology according to the comparative analysis method, and obtain the overwintering crop phenology critical phases of the cro...
Embodiment 2
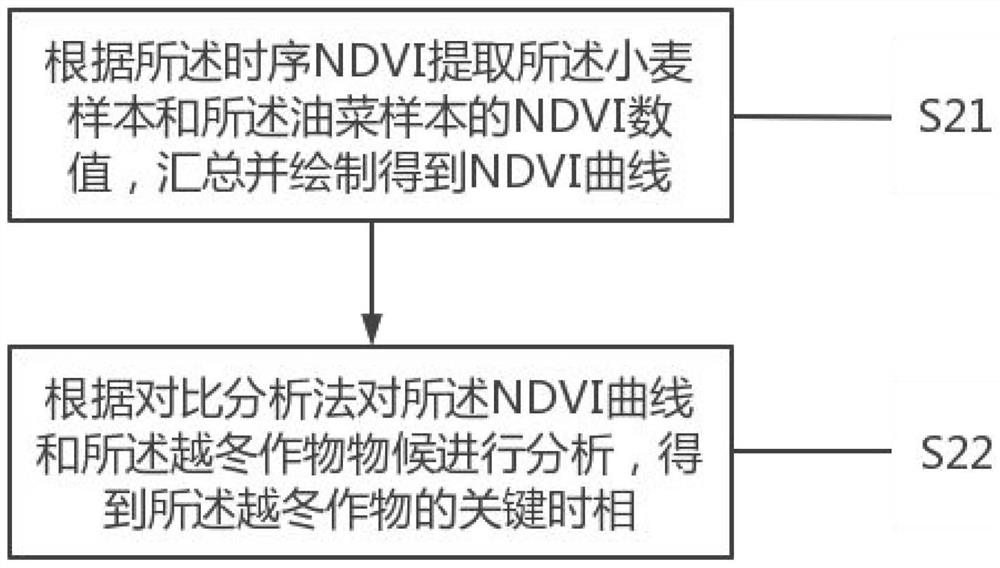
[0060] Such as figure 2 As shown, a method for determining the critical phase of overwintering crops includes the following steps:
[0061] S21. Extract the NDVI values of the wheat sample and the rape sample according to the time series NDVI, summarize and draw the NDVI curve;
[0062] S22, analyze described NDVI curve and described surviving crop phenology according to comparative analysis method, obtain the key phase of described surviving crop.
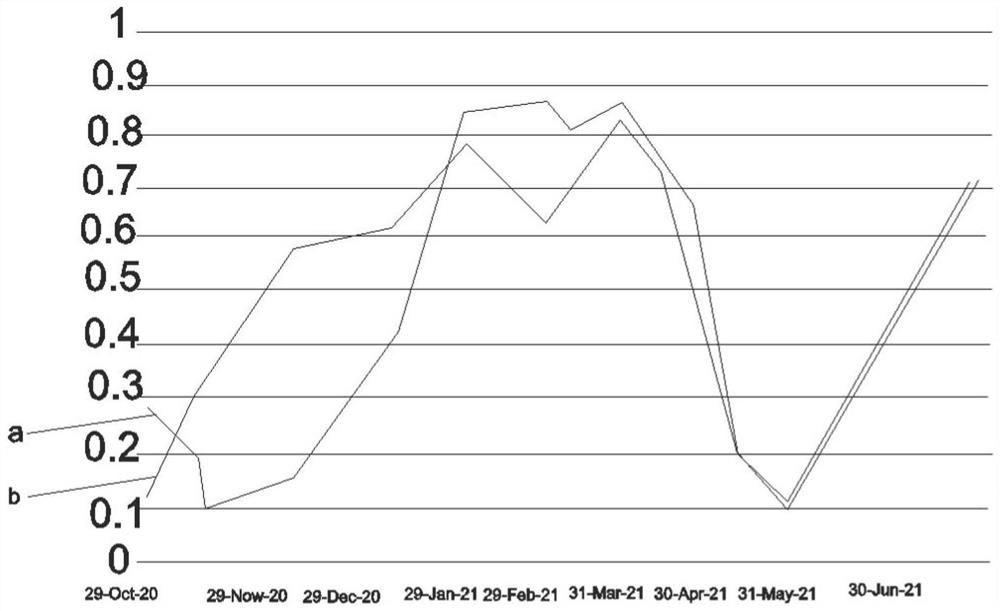
[0063] In this example, wheat crop samples and rapeseed crop samples from November 2018 to June 2019, November 2019 to June 2020, and November 2020 to June 2021 were extracted according to the time series NDVI of the time series image data The NDVI values in the three growth periods are combined and summarized within one year, and then the NDVI curves of wheat and rapeseed are drawn, and the two curves are drawn in the same drawing, as shown in image 3 As shown, a represents the NDVI of wheat, and b represents the NDVI ...
Embodiment 3
[0079] Such as Figure 5 As shown, a method of processing according to a preset method to obtain a final recognition result includes the following steps:
[0080] S31. Extract the cultivated land range of the research area through the global 10-meter resolution land cover dataset, and record it as the Cropland layer, perform statistical synthesis according to the time series NDVI, obtain the NDVI_max layer, and perform non-vegetation on the NDVI_max layer Remove the area, and superimpose it with the Cropland layer, take the intersection to get the range of cultivated land;
[0081] S32. According to the multi-temporal NDVI change, the range of the cultivated land is removed to obtain the range of the overwintering crops;
[0082] S33, combining not limited to one key phase and the NDVI curve to analyze, obtain NDVI rape / NDVI wheat>1 during the first period, and NDVI rape / NDVI wheat<1 during the second period;
[0083] S34. According to the characteristics of the first period a...
PUM
 Abstract
Description
Claims
Application Information
 - R&D
- Intellectual Property
- Life Sciences
- Materials
- Tech Scout
- Unparalleled Data Quality
- Higher Quality Content
- 60% Fewer Hallucinations
Browse by: Latest US Patents, China's latest patents, Technical Efficacy Thesaurus, Application Domain, Technology Topic, Popular Technical Reports.
© 2025 PatSnap. All rights reserved.Legal|Privacy policy|Modern Slavery Act Transparency Statement|Sitemap|About US| Contact US: help@patsnap.com


