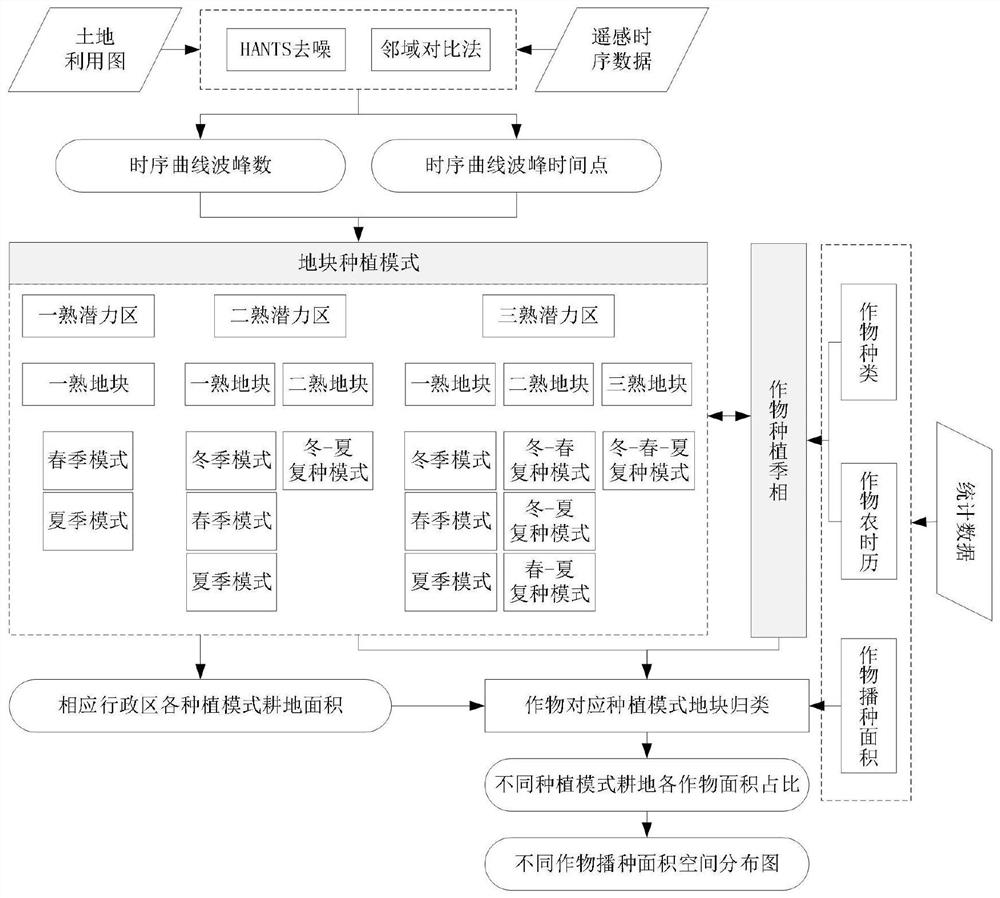
Crop distribution map
A technology of spatial distribution maps and crops, applied in the field of data analysis, can solve problems such as difficulty in reflecting the spatial differences of crops within a statistical unit, difficulty in obtaining spatial distribution information of the entire crop series at a large regional scale, and consuming a large amount of manpower, material and financial resources
- Summary
- Abstract
- Description
- Claims
- Application Information
AI Technical Summary
Problems solved by technology
Method used
Image
Examples
Embodiment Construction
[0034] The present invention will be further described below according to the embodiments and accompanying drawings, and the mode of the present invention includes but not limited to the following embodiments.
[0035] see figure 1 As shown, in this embodiment, winter wheat is taken as an example to carry out crop distribution mapping
[0036] Step 1: Use Harmonic Analysis of Time Series (HANTS) to denoise the data to obtain a smooth time series curve. For different multiple cropping potential areas, use different numbers of frequencies (Number off frequencies) for curve fitting, 3 is used for the second cropping area, and 4 is used for the third cropping area.
[0037] Step 2: After denoising the curve, extract multiple cropping information at the pixel scale. The specific process is as follows:
[0038] Let the pixel value of each time phase of pixel i be a 1 , a 2 …a 23 ,
[0039] ① Compare the size relationship of EVI between two adjacent pixels, and use Δa i Sequen...
PUM
 Abstract
Description
Claims
Application Information
 - Generate Ideas
- Intellectual Property
- Life Sciences
- Materials
- Tech Scout
- Unparalleled Data Quality
- Higher Quality Content
- 60% Fewer Hallucinations
Browse by: Latest US Patents, China's latest patents, Technical Efficacy Thesaurus, Application Domain, Technology Topic, Popular Technical Reports.
© 2025 PatSnap. All rights reserved.Legal|Privacy policy|Modern Slavery Act Transparency Statement|Sitemap|About US| Contact US: help@patsnap.com


