
A method of crop distribution mapping

A crop and sown area technology, applied in the field of data analysis, can solve the problems of interference, difficult to reflect the spatial differences of crops within the statistical unit, and difficult to obtain the spatial distribution information of the whole crop series on a large regional scale.

Active Publication Date: 2021-09-28
AEROSPACE INFORMATION RES INST CAS
View PDF7 Cites 0 Cited by
  • Summary
  • Abstract
  • Description
  • Claims
  • Application Information

AI Technical Summary

Problems solved by technology

Among them, the statistical method can only reflect the quantity change of crops in a certain administrative unit, and it is difficult to reflect the spatial difference of crops in the statistical unit; moreover, the acquisition of statistical data consumes a lot of manpower, material and financial resources, and is also interfered by human factors
Simple remote sensing technology is affected by factors such as atmospheric interference, scale conversion and mixed pixels, and it is difficult to obtain the spatial distribution information of the whole crop series on a large regional scale

Method used


Image

  • A method of crop distribution mapping
  • A method of crop distribution mapping
  • A method of crop distribution mapping

Examples


Embodiment Construction

[0034] The present invention will be further described below according to the embodiments and accompanying drawings, and the mode of the present invention includes but not limited to the following embodiments.

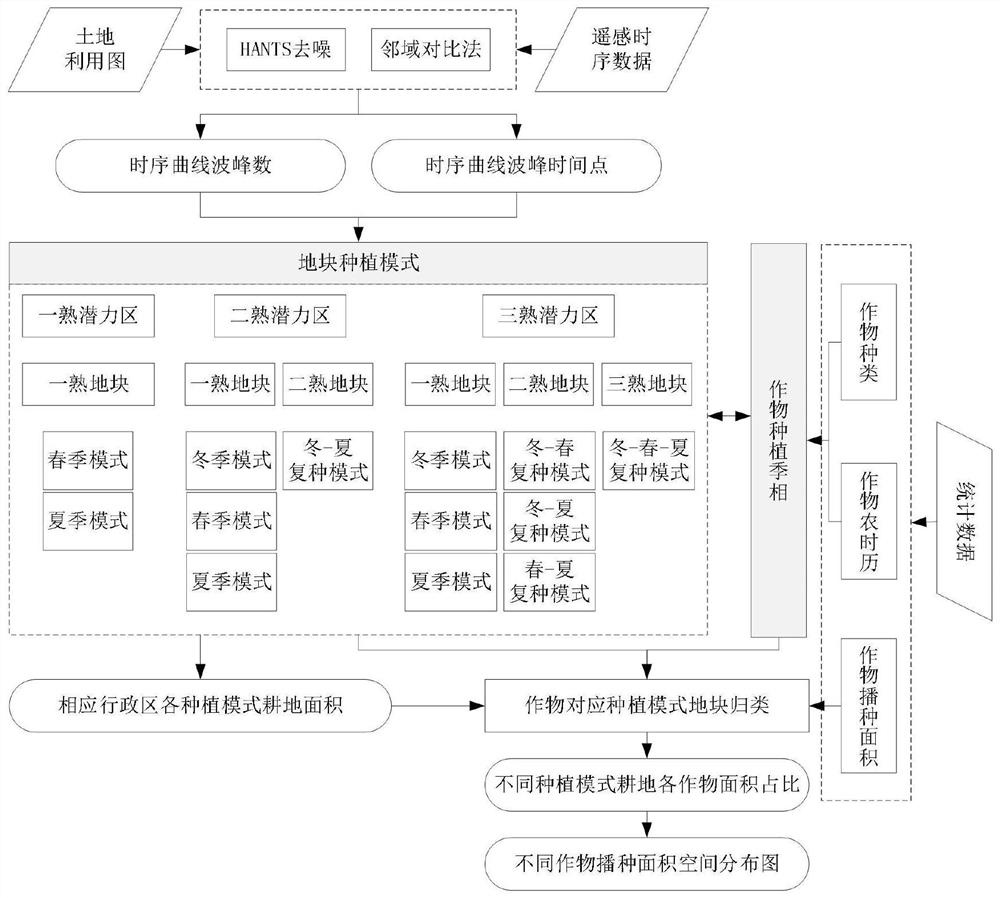
[0035] see figure 1 As shown, in this embodiment, winter wheat is taken as an example to carry out crop distribution mapping

[0036] Step 1: Use Harmonic Analysis of Time Series (HANTS) to denoise the data to obtain a smooth time series curve. For different multiple cropping potential areas, use different numbers of frequencies (Number off frequencies) for curve fitting, 3 is used for the second cropping area, and 4 is used for the third cropping area.

[0037] Step 2: After denoising the curve, extract multiple cropping information at the pixel scale. The specific process is as follows:

[0038] Let the pixel value of each time phase of pixel i be a 1 , a 2 …a 23 ,

[0039] ① Compare the size relationship of EVI between two adjacent pixels, and use Δa i Sequen...


PUM


Abstract

The invention discloses a crop distribution map, which calculates the area of ​​each type of crop on each grid based on grid-scale crop planting pattern information extracted from remote sensing data and the area ratios of various types of crops in the planting pattern in corresponding administrative units, thereby Make a crop spatial distribution map. The invention combines the crop phenology characteristics identified by remote sensing with the actual crop phenology to determine the spatial distribution of crops, and can achieve large-scale, multi-scale, and high spatial heterogeneity through remote sensing macroscopic, fast acquisition, and multi-scale features. Mapping the spatial distribution of crops.

Description

technical field [0001] The invention relates to the field of data analysis, in particular to a crop distribution mapping. Background technique [0002] The spatio-temporal distribution of crops reflects the situation of humans using land for agricultural production in different periods. It is an important basic data for research on the pattern and function of farmland ecosystems, the cycle of terrestrial ecosystems, and global changes. Understanding the temporal and spatial distribution of crops is of great significance to ensure national food security and sustainable development of resources and the environment. [0003] At present, the ways to obtain information on the temporal and spatial distribution of crops mainly include administrative statistics and remote sensing monitoring. Among them, the statistical method can only reflect the quantity change of crops in a certain administrative unit, and it is difficult to reflect the spatial difference of crops in the statisti...

Claims


Application Information

Patent Timeline
Patent Type & Authority Patents(China)
IPC IPC(8): G06F16/26G06F16/29G06T7/62G06T11/20
CPCG06T11/203G06T7/62G06F16/26G06F16/29
Inventor 左丽君
Owner AEROSPACE INFORMATION RES INST CAS
Learn More