Eureka AIR delivers breakthrough ideas for toughest innovation challenges, trusted by R&D personnel around the world.

Method and system for quickly identifying power utilization abnormal behaviors

A technology for abnormal electricity and abnormal electricity, which is applied in character and pattern recognition, data processing applications, special data processing applications, etc. Efficiency, reducing the scope of power outages, reducing the effect of blind verification

Pending Publication Date: 2020-12-25
EAST INNER MONGOLIA ELECTRIC POWER COMPANY +1
View PDF0 Cites 3 Cited by
  • Summary
  • Abstract
  • Description
  • Claims
  • Application Information

AI Technical Summary

Problems solved by technology

[0003] The power supply network is very complex, the basic data is very large, and with the rapid development of the economy, the scale of power consumption has increased rapidly. In some places, there are still missing and errors in power consumption information, faults in metering devices, man-made damage to metering devices, and harsh operating environments. , Three-phase load is seriously unbalanced, etc.
In addition, a very small number of power users often violate the contract for their own economic interests, such as deliberately changing the nature of electricity consumption, using electricity at a high electricity price, paying at a low electricity price, or privately connecting randomly, damaging the power grid Load balancing of equipment, even bypassing measuring instruments for power consumption, deliberately destroying measuring instruments, etc.
These phenomena not only bring direct economic losses to power supply companies, but also make it difficult for power supply companies to grasp the real power supply and consumption situation, make it difficult to formulate reasonable power consumption plans, and destroy the good order of power consumption.

Method used


Image

  • Method and system for quickly identifying power utilization abnormal behaviors
  • Method and system for quickly identifying power utilization abnormal behaviors

Examples


Embodiment Construction

[0039] The following will clearly and completely describe the technical solutions in the embodiments of the present invention with reference to the accompanying drawings in the embodiments of the present invention. Obviously, the described embodiments are only some, not all, embodiments of the present invention. Based on the embodiments of the present invention, all other embodiments obtained by persons of ordinary skill in the art without making creative efforts fall within the protection scope of the present invention.

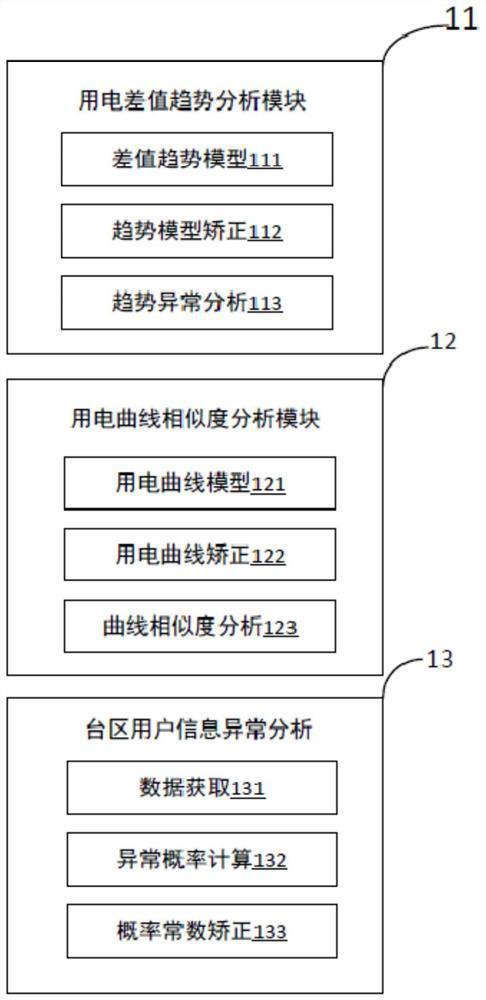
[0040] see figure 1 , which is a functional block diagram of the system for quickly identifying abnormal power consumption behaviors of the present invention. The system includes an electricity consumption difference trend analysis module 11 , an electricity consumption curve similarity analysis module 12 , and an abnormality analysis module 13 for user information in a station area. The power consumption difference trend analysis module 11 includes a diffe...


PUM


Abstract

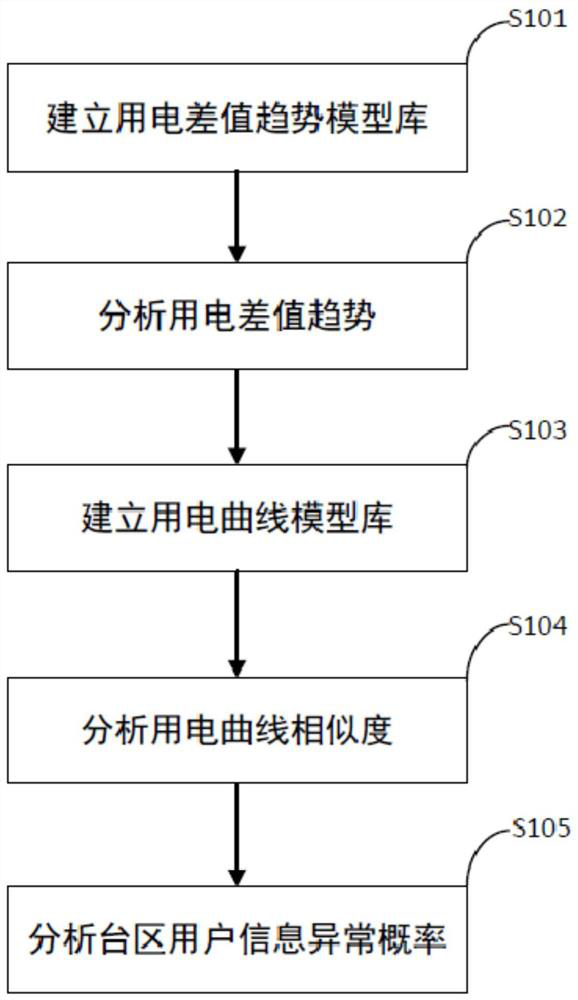
The invention provides a method and system for quickly identifying power consumption abnormal behaviors. The system comprises the following modules: a power consumption difference trend analysis module which calculates power consumption difference trends based on a power consumption information big data analysis method, compares the similarity of the power consumption difference trends between different users and different periods, and deduces the probability of power consumption anomaly; a power utilization curve similarity analysis module which is used for establishing a power consumption quantity curve and a line loss curve of lines, users and transformer areas, calculating the form similarity of the power consumption quantity curve and the line loss curve, and calculating the similarity of various curves by using a shortest distance method; and a transformer area user information anomaly analysis module which is used for analyzing a transformer area power supply quantity, a power selling quantity and transformer area line loss by utilizing a big data technology, and calculating the probability of transformer area user information anomaly on the basis of parameters such as the transformer area maximum power supply radius and the transformer area linear distance. With the method and system adopted, the quick recognition of the abnormal power consumption behaviors can be realized, the abnormal probability of the user information in the transformer areas can be calculated, and the troubleshooting workload is reduced as much as possible, and a power failure range can be narrowed as much as possible.

Description

technical field [0001] The invention is applicable to the field of power consumption management, and provides a method and system for quickly identifying abnormal power consumption behaviors. Background technique [0002] The power system includes five major links of power generation, transmission, transformation, power distribution, and power consumption. Among them, power consumption management is directly oriented to power users. Strengthening power consumption management can not only improve user satisfaction and corporate image, but also regulate power consumption behavior. Reduce the loss of electricity charges and improve the economic benefits of the enterprise. [0003] The power supply network is very complex, the basic data is very large, and with the rapid economic development, the scale of power consumption has increased rapidly. In some places, there are still missing and errors in power consumption information, failure of metering devices, man-made damage to me...

Claims


Application Information

Patent Timeline
IPC IPC(8): G06F16/903G06K9/62G06Q50/06
CPCG06F16/90335G06Q50/06G06F18/22Y02D10/00
Inventor 李淑峰李加张玉峰王强张力军相银初闫永昶鞠凤学侯丙哲王庆锁李昂泽王嵩为孙玥张学亮卢颖辉李源博孙仲阳
Owner EAST INNER MONGOLIA ELECTRIC POWER COMPANY
Why Eureka
Eureka Blog
Learn More