Method for generating and publishing tile map based on CAD data

A tile map and data generation technology, applied in the direction of 2D image generation, image data processing, extraction from basic elements, etc., can solve the problems of difficulty in slicing, difficulty in retaining symbolic information, and technical difficulty in vector data, etc. the effect of clarity

Pending Publication Date: 2020-11-10
CHINA RAILWAY SIYUAN SURVEY & DESIGN GRP
View PDF3 Cites 5 Cited by
  • Summary
  • Abstract
  • Description
  • Claims
  • Application Information

AI Technical Summary

Problems solved by technology

However, it is difficult to directly release vector data technology, d

Method used


Image

  • Method for generating and publishing tile map based on CAD data
  • Method for generating and publishing tile map based on CAD data
  • Method for generating and publishing tile map based on CAD data

Examples


Embodiment 1

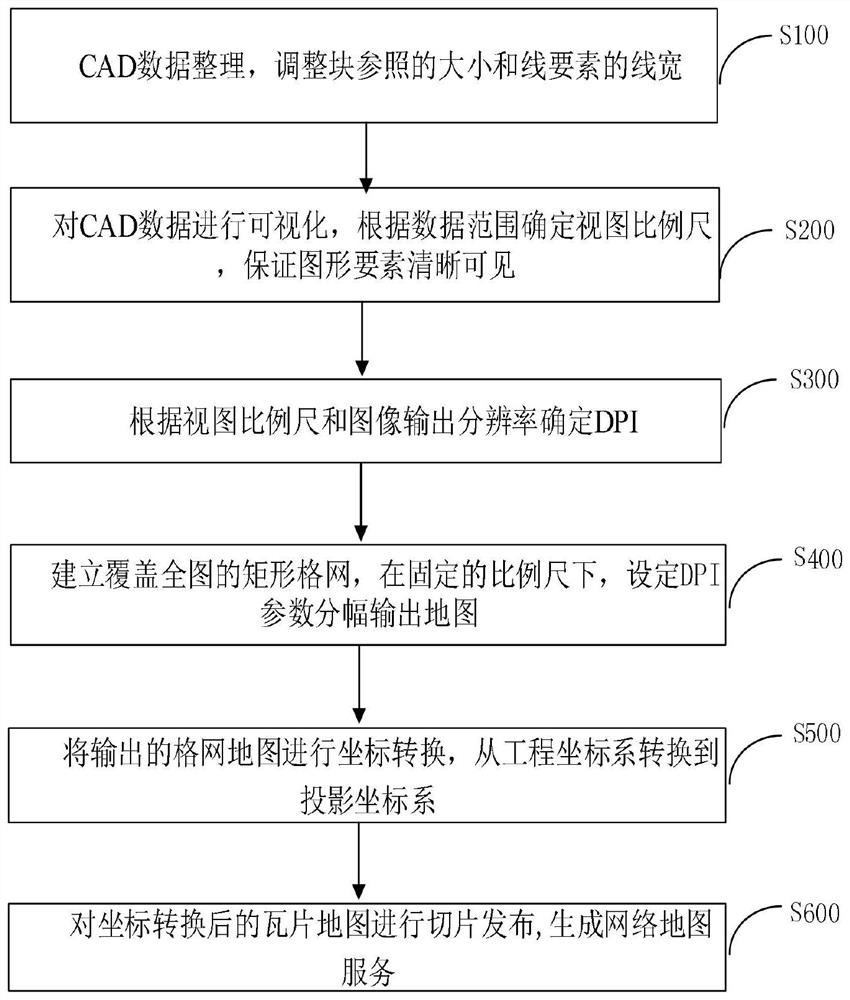
[0039] A method for generating and publishing a tile map based on CAD data, comprising:

[0040] S100. CAD data sorting, adjusting the size of the block reference and the line width of the line elements. Understandably, according to the resolution of the output image is 0.1m, the pixel width of the output element is 4pi, and the size of the block reference and the line width of the line element are adjusted to 0.4.

[0041] L=n×p

[0042] S200. Visualize the CAD data, and determine the view scale according to the data range to ensure that graphic elements are clearly visible; in some preferred embodiments, the data coverage area is 100 square kilometers, and the scale is set to 1:10000.

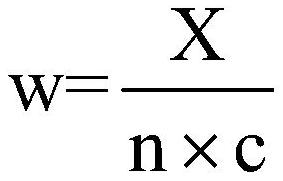
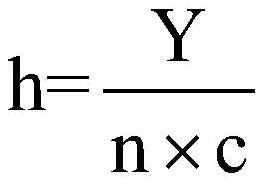
[0043] S300. Determine the DPI parameter according to the view scale and the image output resolution; the image resolution determines the fineness of the image details. Generally, the higher the resolution of an image, the more pixels it contains and the clearer the image. The unit to desc...


PUM


Abstract

The invention discloses a method for generating and publishing a tile map based on CAD (Computer-Aided Design) data. The method comprises the following steps: sorting the CAD data, and adjusting the reference size of a block and the line width of line elements; visualizing the CAD data, determining a view scale according to a data range, and ensuring that graphic elements are clear and visible; determining a DPI parameter according to the view scale and the image output resolution; establishing a rectangular grid covering the whole map, and setting a DPI parameter framing output map under a fixed scale; carrying out coordinate transformation on the output grid map, and transforming an engineering coordinate system into a Mercator projection coordinate system; and slicing and publishing thetile map after coordinate conversion to generate a network map service. CAD data in the vector format is converted into a raster picture a tile map is generated and published, the problem that a vector file publishing network service slicing scheme is complex is solved, meanwhile, the symbolization effect of cad data is kept in a lossless mode, and rapid publishing of the vector data is achieved.

Description

technical field [0001] The invention belongs to the technical field of geographic information processing, and specifically refers to a method for converting vector CAD data into grid images and publishing them as network map services. Background technique [0002] At present, the main storage format of topographic maps is CAD format, which can only be viewed on desktop software. At present, the networked collaborative design platform based on webGIS is developing rapidly. In order to facilitate users to browse topographic map data on the web page, we need to publish map services. However, it is difficult to directly release vector data technology, difficult to slice, and difficult to retain complex symbolic information. How to express the CAD topographic map data in a raster, and on the premise of ensuring that the spatial relationship between the elements remains unchanged, to increase the resolution of the map as much as possible and to publish the map has become a proble...

Claims


Application Information

Patent Timeline
IPC IPC(8): G06T11/20
CPCG06T11/206
Inventor 胡晓斌汤建凤曹成度李海亮
Owner CHINA RAILWAY SIYUAN SURVEY & DESIGN GRP
Why Eureka
Try Eureka