Driver physiological data-based driving suitability evaluation method and system
A technology of physiological data and evaluation methods, applied in data processing applications, vehicle testing, machine/structural component testing, etc., can solve the problems of objectivity and low reliability, reduce bad driving behaviors, and improve safety Effect
- Summary
- Abstract
- Description
- Claims
- Application Information
AI Technical Summary
Problems solved by technology
Method used
Image
Examples
specific Embodiment approach 1
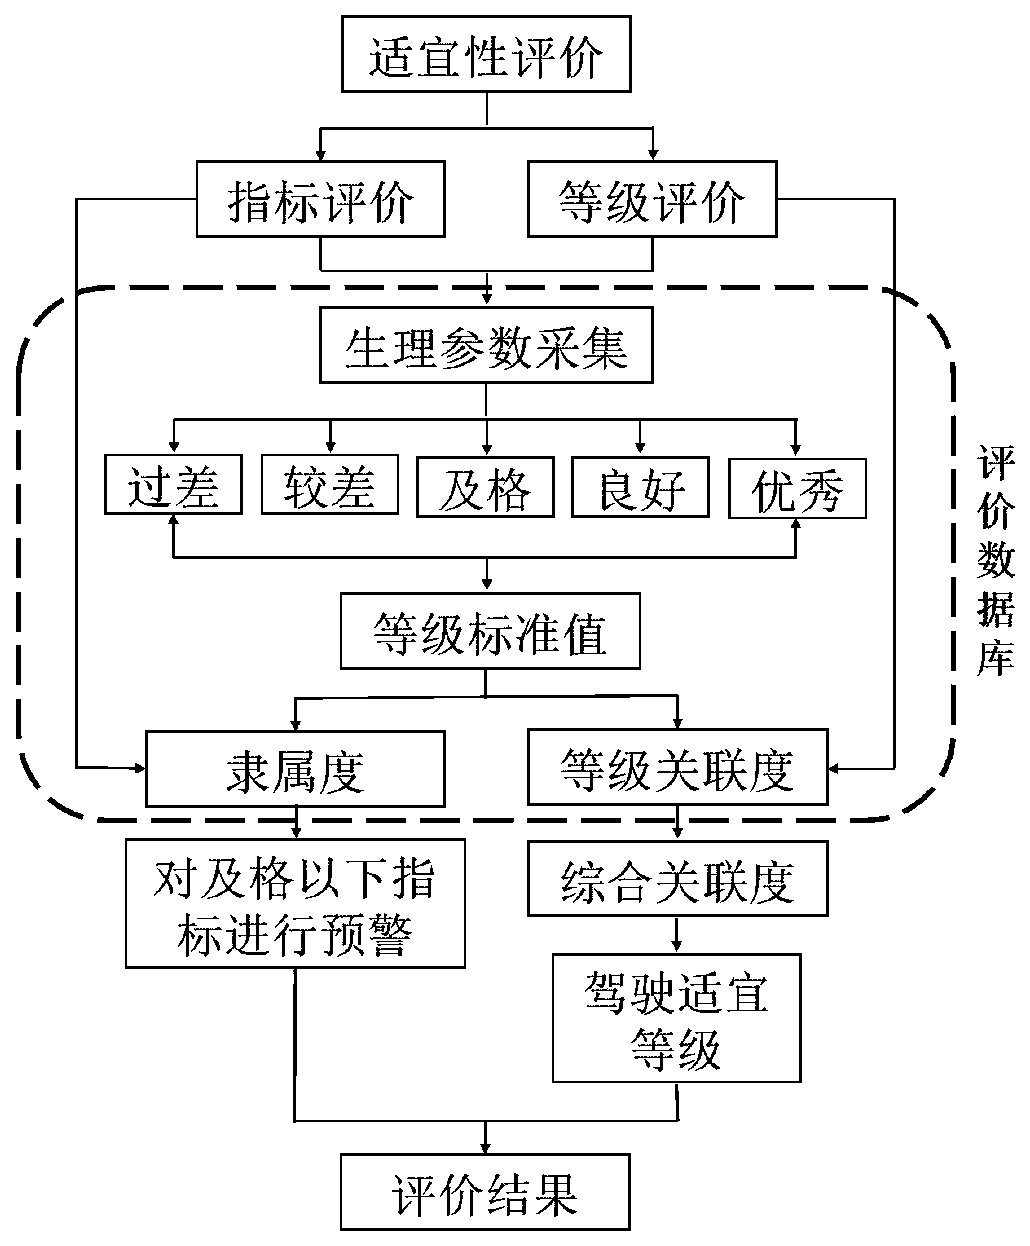
[0047] Specific implementation mode 1: The suitability of the driver to be evaluated is divided into five grades (D1=poor, D2=poor, D3=pass, D4=good, D5=excellent), which are determined by the professional test sample data in the early stage The grade level value corresponding to each evaluation grade, let a 1 , a 2 , a 3 , a 4 , a 5 are the grade level values corresponding to D1, D2, D3, D4, and D5 respectively, and a total of n groups of samples have been measured. The normal range of flexion and extension of the driver listed in Table 1 is based on the neutral position as each index corresponds to the poorness in the 5 grades (a 1 ) and excellent (a 5 ) level value, pass (a 3 ) takes the average value of the sample data, α 2 and a 4 Take the 20% and 80% sample levels respectively, that is, 20% and 80% of the sample values are below this data.
[0048] The evaluation of driving suitability level in the early stage includes 16 indicators related to pressure measu...
specific Embodiment approach 2
[0051] Specific implementation mode 2: This embodiment is to obtain the main index affecting the suitability difference between the driver and the vehicle, so as to make targeted adjustments to the driver's posture and behavior.
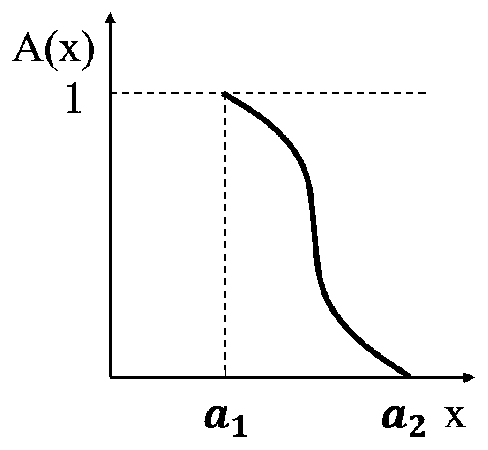
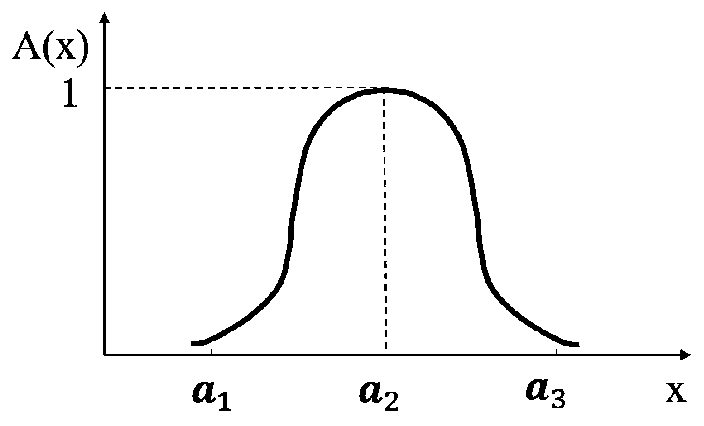
[0052] The normal distribution is used as the basis for dividing the membership degree of each parameter level of the driver to be evaluated. The specific process is as follows: the membership function corresponding to the five levels all satisfies at the endpoint of the interval (endpoint value a 1 , a 2 , a 3 , a 4 , a 5 The confidence level between known) is 95%, and under the normal curve of each interval, the area in the horizontal axis interval (μ-1.96σ, μ-1.96σ) is 95.449974%, thus it can be obtained that in each membership function The σ value of , the following five membership functions are obtained:
[0053] The membership function of an index to the grade (too bad):
[0054]
[0055] The membership function of an index to grade (po...
specific Embodiment approach 3
[0066] Specific Implementation Mode Three: This implementation mode is to explore the closeness of multiple evaluation indicators related to the driver to each driving suitability level, so as to determine the correlation between different indicators and levels, which is expressed by gray correlation.
[0067] The evaluation database contains 16 indicators including the pressure, angle and distance measurement data of multiple parts of the body and the data that advances with the detection time. When the driver sits on the driver's seat, the data acquisition card acquires the first set of objective physiological parameter samples about the driver and the seat; when the driver performs a certain task during dynamic driving, the data acquisition card acquires the second A set of physiological parameter samples about the driver and the seat; when the driver finishes the driving task, the data acquisition card acquires a third set of comparative physiological parameter samples abou...
PUM
 Abstract
Description
Claims
Application Information
 - R&D
- Intellectual Property
- Life Sciences
- Materials
- Tech Scout
- Unparalleled Data Quality
- Higher Quality Content
- 60% Fewer Hallucinations
Browse by: Latest US Patents, China's latest patents, Technical Efficacy Thesaurus, Application Domain, Technology Topic, Popular Technical Reports.
© 2025 PatSnap. All rights reserved.Legal|Privacy policy|Modern Slavery Act Transparency Statement|Sitemap|About US| Contact US: help@patsnap.com


