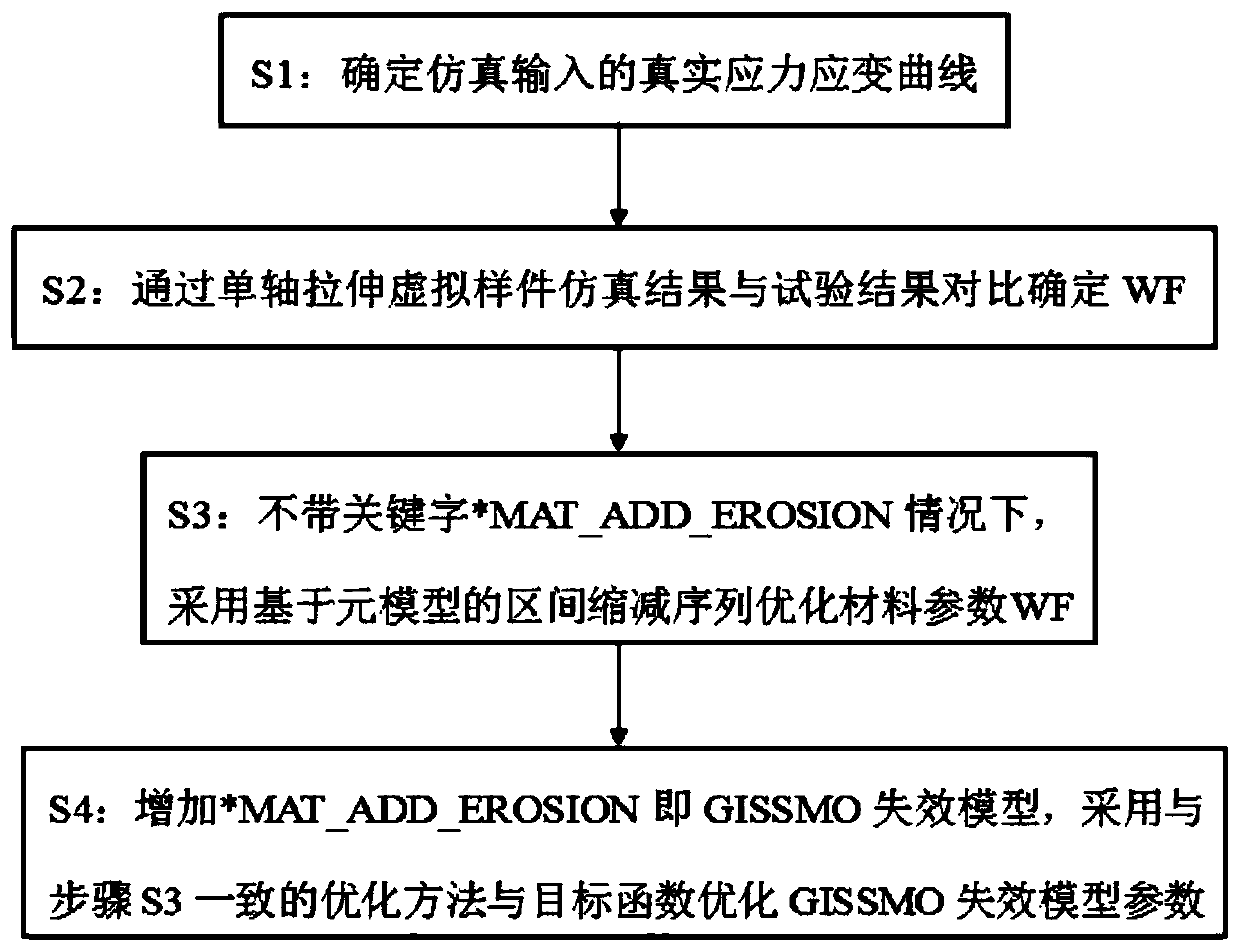
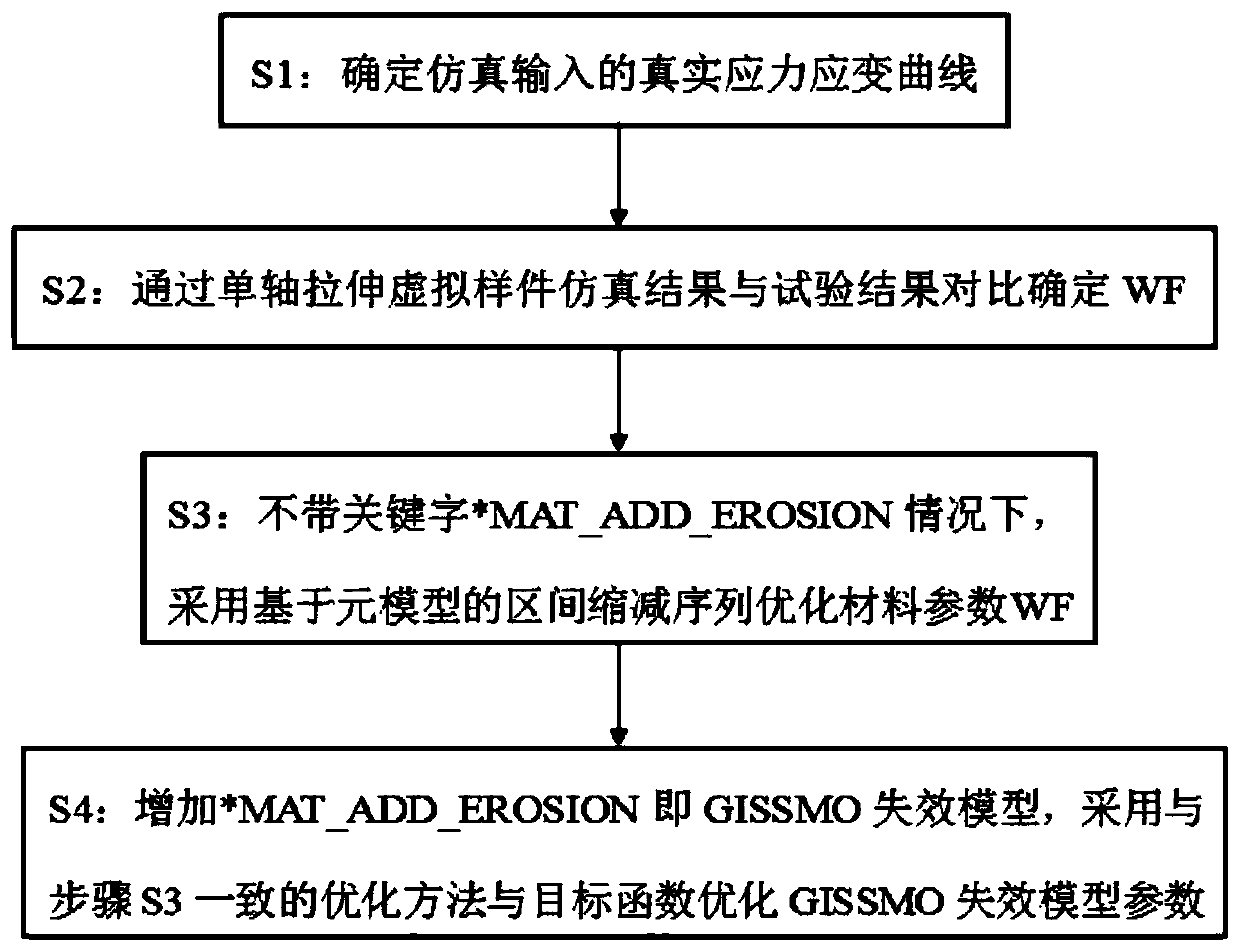
GISSMO material failure model parameter optimization method
An optimization method and technology of model parameters, applied in the field of materials, can solve problems such as large amount of calculation, difficult to obtain optimal solutions, etc., to achieve the effect of reducing workload and easy optimal solutions
- Summary
- Abstract
- Description
- Claims
- Application Information
AI Technical Summary
Problems solved by technology
Method used
Image
Examples
Embodiment 1
[0020] The fracture failure mechanism of metal materials can be divided into normal fracture, shear fracture and instability failure. Normal fracture is caused by the formation and combination of internal pores during metal deformation, and its fracture morphology is relatively rough; while shear fracture is caused by shear band slippage, and its fracture morphology is relatively smooth. The GISSMO failure model provides a phenomenological equation for the description of material fracture behavior. Assuming that the stressed section contains some micro-defects in the S area, the actual effective area of the section is The damage parameter D is introduced into the constitutive equation, and the damage coefficient can be expressed as:
[0021]
[0022] The reduction of the section in the effective area brings about the dilution of the section stiffness, and the actual stress value is corrected as:
[0023] σ * =σ(1-D) (2)
[0024] The GISSMO failure model describes th...
Embodiment 2
[0053] Compared with Example 1, the only difference is that when the proportional loading method is adopted, the nonlinear accumulation of DMGEXP increases is a concave function, and the greater the DMGEXP before fracture, the greater the damage accumulation, the slower the front end and the slower the rear end block. When DMGEXP is 2.0, 2.2, 2.4, and 2.6 respectively, the engineering stress-strain curve slightly delays fracture with the increase of DMGEXP. The increase of DMGEXP is slightly delayed in engineering stress-strain curve. When DMGEXP=2, the non-linear damage accumulation is more consistent with the test results. In order to reduce the degree of nonlinearity of the optimization model, DMGEXP can take 2.
Embodiment 3
[0055] The only difference from Example 2 is that when using Metamodel-based optimization to fit the sampling points and output the functional relationship between the response variable Y and a set of input variables (X1, X2...Xn), it does not directly input Instead, two curves Lm and LM are fitted first, and then a region is formed between Lm and LM, and a certain curve LR is selected between the regions, and this curve LR is used as the test target engineering stress-strain curve.
[0056] Since the measured sampling point data will have certain errors, the actual value of the sampling point must be in a certain value range Xim≤Xi≤XiM, Yim≤Yi≤YiM. That is, Xi ∈ [Xim, XiM], Xim is the minimum value of Xi collected during the experiment, XiM is the maximum value of Xi collected during the experiment; Yi ∈ [Yim, YiM], Yim is the Yi collected during the experiment The minimum value of YiM is the maximum value of Yi collected during the experiment; i=1, 2, 3...n. Therefore, if t...
PUM
 Abstract
Description
Claims
Application Information
 - R&D
- Intellectual Property
- Life Sciences
- Materials
- Tech Scout
- Unparalleled Data Quality
- Higher Quality Content
- 60% Fewer Hallucinations
Browse by: Latest US Patents, China's latest patents, Technical Efficacy Thesaurus, Application Domain, Technology Topic, Popular Technical Reports.
© 2025 PatSnap. All rights reserved.Legal|Privacy policy|Modern Slavery Act Transparency Statement|Sitemap|About US| Contact US: help@patsnap.com


