
A method for calculating the relative permeability of tight core based on digital imaging technology

A technology of relative permeability and digital imaging, applied in permeability/surface area analysis, calculation, earthwork drilling, etc., can solve the problems of large difference in phase permeability curves and no consideration, and avoid waste of resources, time-consuming and instrumentation. Effects of precision problems

Active Publication Date: 2021-03-09
SOUTHWEST PETROLEUM UNIV
View PDF9 Cites 0 Cited by
  • Summary
  • Abstract
  • Description
  • Claims
  • Application Information

AI Technical Summary

Problems solved by technology

Both the steady-state method and the dynamic method do not consider the influence of rock morphology characteristics such as internal structure and pore distribution on the relative permeability curve, and the calculated relative permeability curves are often quite different from the measured curves.

Method used


Image

  • A method for calculating the relative permeability of tight core based on digital imaging technology
  • A method for calculating the relative permeability of tight core based on digital imaging technology
  • A method for calculating the relative permeability of tight core based on digital imaging technology

Examples


Embodiment 2

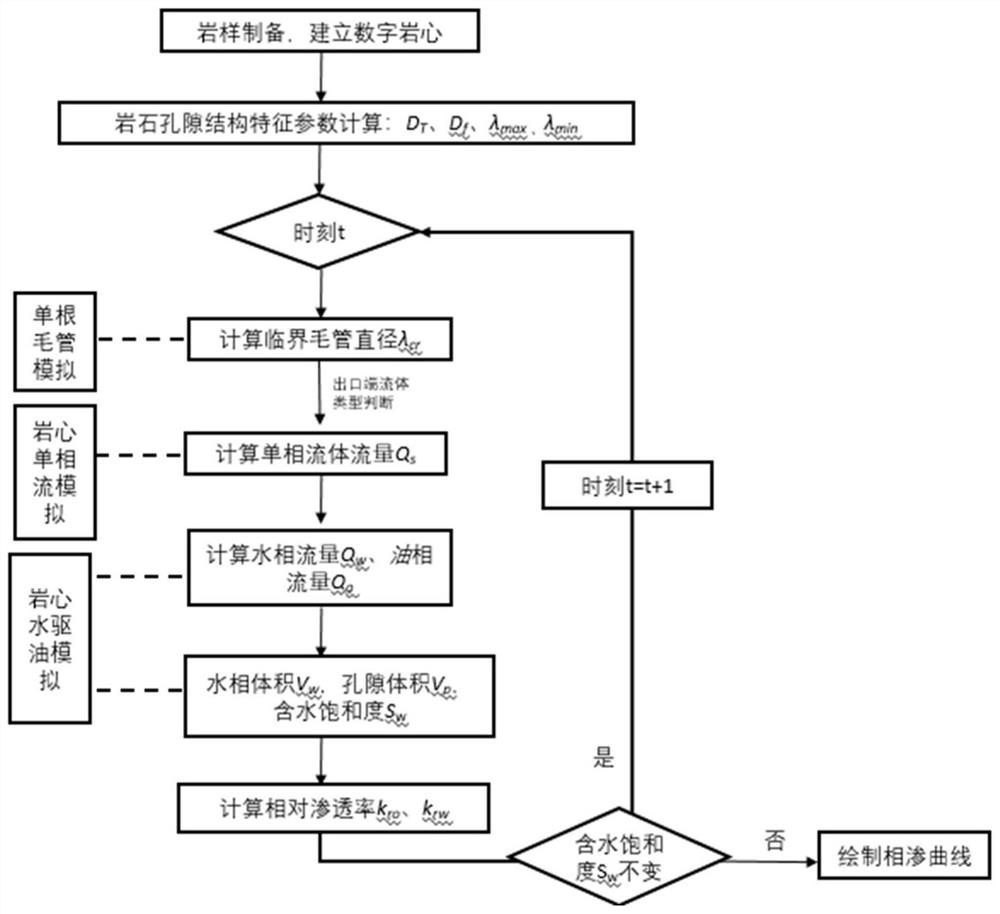
[0132] (1) Choose different porosity fractal dimensions D f =1.3, 1.4, 1.5, same tortuosity fractal dimension D T 、Maximum pore equivalent diameter λ max and minimum pore equivalent diameter λ min , as the eigenvalue of the core pore structure parameters, used to calculate the influence of different porosity fractal dimensions on the relative permeability curve.

[0133] (2) Taking t=0 as the starting time, calculate the corresponding critical capillary diameter, and judge the distribution of all capillary fluids in the core at this moment.

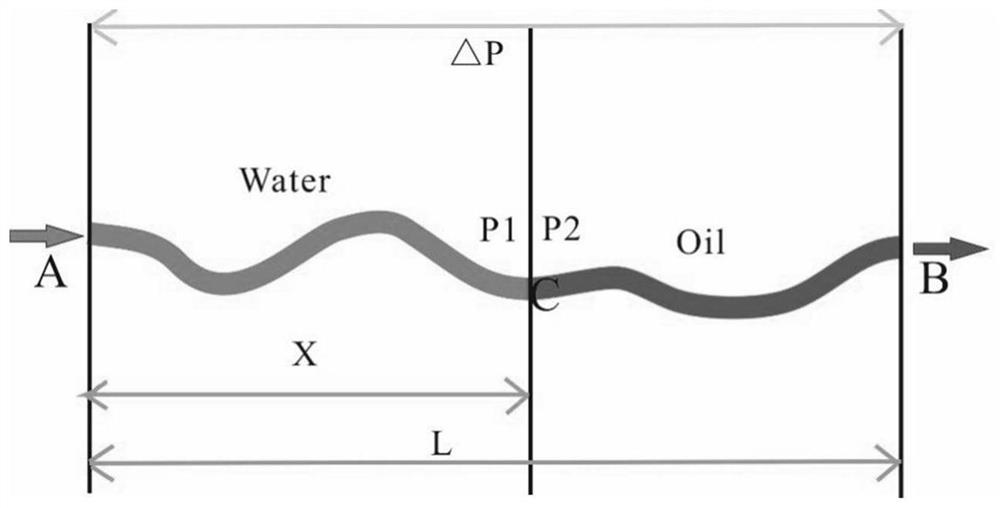
[0134] (4) Simulate and calculate the flow Q of single-phase flow s , and then simulate and calculate the water phase flow rate Q when water flooding oil flows at t=0 w and oil phase flow rate Q o .

[0135] (5) simulated calculation of water phase volume, pore volume and water saturation in the rock core when t=0;

[0136] (6) Calculate the relative permeability k corresponding to the water saturation ro and k rw .

[0137] (7)...


PUM

PropertyMeasurementUnit
diameteraaaaaaaaaa
lengthaaaaaaaaaa
diameteraaaaaaaaaa

Abstract

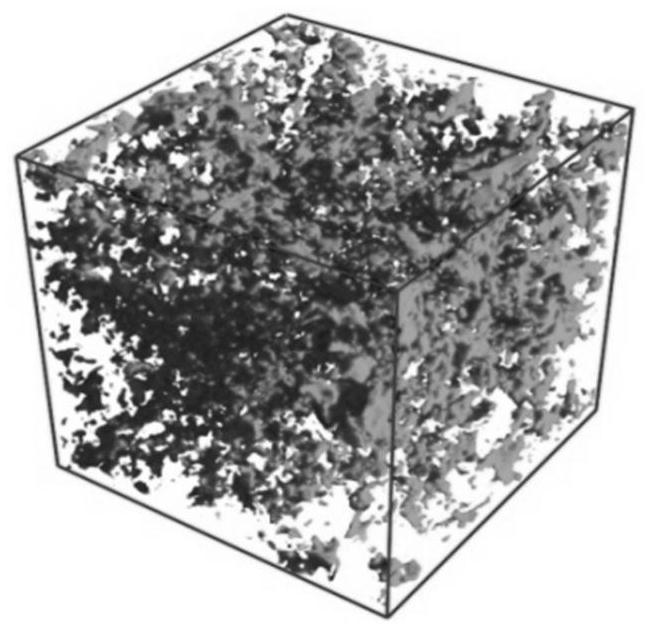
The invention discloses a method for calculating the relative permeability of a dense rock core based on digital imaging technology, comprising the following steps: S1: preparing a small column sample of a dense rock core meeting the resolution requirement; S2: using MicroCT-400 to scan and establish a digital rock core; S3: According to the digital core, statistically analyze the parameters reflecting the rock pore structure and shape characteristics; S4: Use the 3D image fractal box dimension algorithm to calculate the fractal dimension D of the tortuosity T and porosity fractal dimension D f ;S5: Using label analysis to count the maximum equivalent pore diameter λ max and minimum pore equivalent diameter λ min ; It solves the problems of time-consuming experiments, instrument precision, inability to perform repeated calculation simulations and waste of resources for repeated physical experiments.

Description

technical field [0001] The invention relates to the field of analyzing the microscopic physical properties of tight rocks, in particular to a method for calculating the relative permeability of tight rock cores based on digital imaging technology. Background technique [0002] Tight reservoirs are currently the focus of research on the development of unconventional oil and gas resources, and have broad development prospects. The flow of oil and gas in low-permeability tight reservoirs is often accompanied by non-Darcy flow phenomenon. In order to effectively characterize the low-velocity non-Darcy flow effect, a threshold pressure gradient is introduced. Due to the low permeability and the existence of threshold pressure gradient, the measurement of relative permeability curve takes a long time and has poor accuracy. Therefore, how to establish a set of relative permeability calculation methods considering the low permeability characteristics of porous media is very critica...

Claims


Application Information

Patent Timeline
Patent Type & Authority Patents(China)
IPC IPC(8): G01N15/08
CPCG01N15/0826G01N15/088E21B49/00G01N2015/0846Y02A10/40E21B49/0875E21B49/02G06T17/05G06T17/00
Inventor 段永刚李政澜方全堂魏明强彭瑀卫诗豪伍梓健盛舒遥
Owner SOUTHWEST PETROLEUM UNIV
Learn More