Data processing and report display method based on big data

A data processing and big data technology, applied in the fields of data processing and data visualization, can solve the problems of slow query speed, no response, long response time of report interface, etc. Effect

Active Publication Date: 2019-12-20
SICHUAN CHANGHONG ELECTRIC CO LTD
View PDF9 Cites 1 Cited by
  • Summary
  • Abstract
  • Description
  • Claims
  • Application Information

AI Technical Summary

Problems solved by technology

[0005] The purpose of the present invention is to provide a data processing and report display method based on big data, which is used to solve the problem that in the prior art, when the amount of data is large, the query speed will become slower and slower, resulting in longer and longer report interface response time, and even There will be no response, let alone the problem of being unable to complete the display of query requirements from multiple data sources

Method used


Image

  • Data processing and report display method based on big data
  • Data processing and report display method based on big data

Examples


Embodiment 1

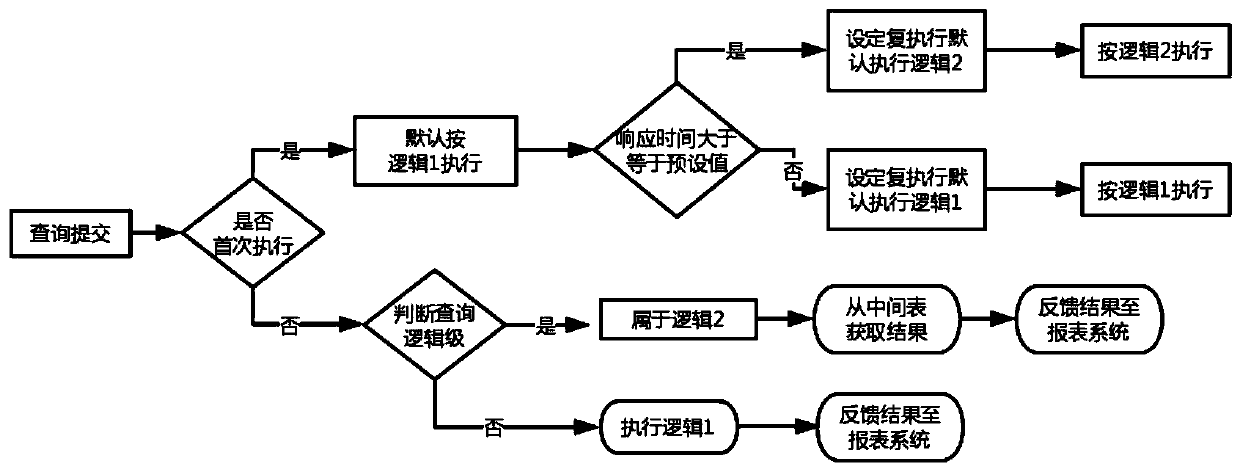
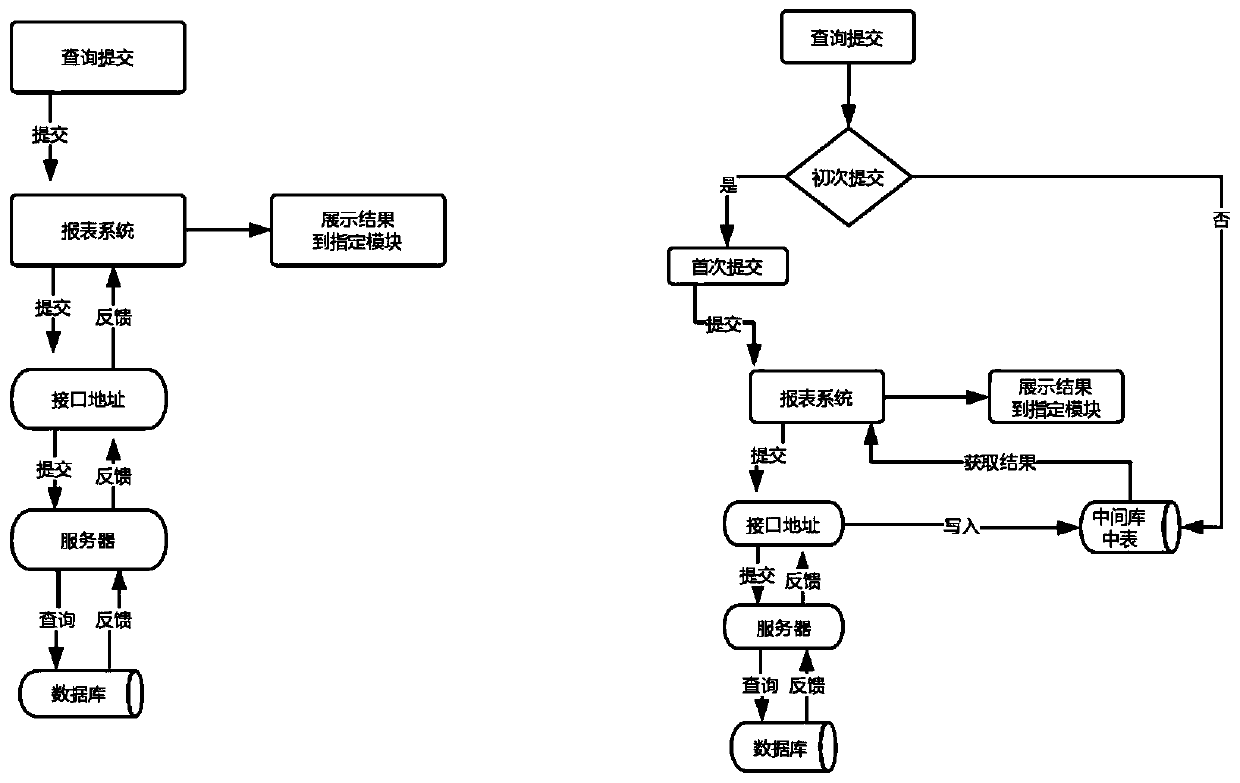
[0021] As shown in the accompanying drawings, a data processing and report display method based on big data, firstly use ETL tools to store the source data with huge data volume and different sources in the data warehouse, complete the integration of different data sources, and source data conduct unified management;

[0022] Then, configure the data source and report template in the report system, connect the source data to the hive data warehouse through the interface, select the report template of each module through the report system, and establish a pointing relationship between each module and the related data table with the system identification, and the system The flag is 1, that is, when the logic 1 is executed, the report display is based on the table query feedback in the directly connected data warehouse; after completing the selection and configuration of the report template, analyze the statistical indicators of each report template corresponding to the fields inv...


PUM


Abstract

The invention discloses a data processing and report display method based on big data, and the method comprises the steps: 1, storing data from different sources in a data warehouse, configuring a data source and a report template in a report system, and setting the longest response time of each module report template; 2, compiling a query code, writing query statements of all statistical indexesin a code bar according to logic 1, namely submitting the query statements to a server through a report system interface, and directly feeding back a result to a report client by the server; writing query statements of all statistical indexes according to logic 2, namely submitting the query statements to a server through a report system interface, loading a result into a preset intermediate tableby the server, reading a query result from the intermediate table, and displaying the query result; 3, when the query instruction is executed for the first time, if the response time is shorter thanthe longest response time of the template, executing the logic 1 and displaying a result; and if the response time is greater than or equal to the longest response time of the template, executing logic 2 and feeding back.

Description

technical field [0001] The present invention relates to the fields of data processing and data visualization, specifically, a data processing and report display method based on big data. Background technique [0002] With the advent of the era of big data, along with the processing requirements of massive data, the requirements for data processing and data visualization are getting higher and higher. [0003] At present, the basic process of report visualization is: first, configure report information, including configuring data sources through interface definition, select report templates (report templates are preset by the report system), and point data tables to report templates through system identifiers to realize data tables. Binding with the report template, etc., and then use drag and drop (currently the field drag and drop method report system has been automatically converted into query statements) or write SQL statement queries, by submitting the query to the serve...

Claims


Application Information

Patent Timeline
Patent Type & Authority Applications(China)
IPC IPC(8): G06F16/2453G06F16/2458G06F16/25G06F16/28
CPCG06F16/24549G06F16/24539G06F16/2462G06F16/254G06F16/283
Inventor 彭媛媛
Owner SICHUAN CHANGHONG ELECTRIC CO LTD
Why Eureka
Try Eureka