
Stratigraphic correlation uncertainty visualization method based on multi-source data fusion

A technique of uncertainty and stratigraphic comparison, applied in the fields of graphics and visualization, and petroleum exploration, which can solve problems such as uncertainty and error

Active Publication Date: 2019-11-12
ZHEJIANG UNIV OF FINANCE & ECONOMICS
View PDF5 Cites 4 Cited by
  • Summary
  • Abstract
  • Description
  • Claims
  • Application Information

AI Technical Summary

Problems solved by technology

Analysis results such as stratigraphic correlation conducted by experts in complex geological structures are also prone to errors and uncertainties

Method used


Image

  • Stratigraphic correlation uncertainty visualization method based on multi-source data fusion
  • Stratigraphic correlation uncertainty visualization method based on multi-source data fusion
  • Stratigraphic correlation uncertainty visualization method based on multi-source data fusion

Examples


Embodiment Construction

[0061] The method for visualizing uncertainty of formation correlation based on multi-source data fusion of the present invention will be further described below in combination with the accompanying drawings.

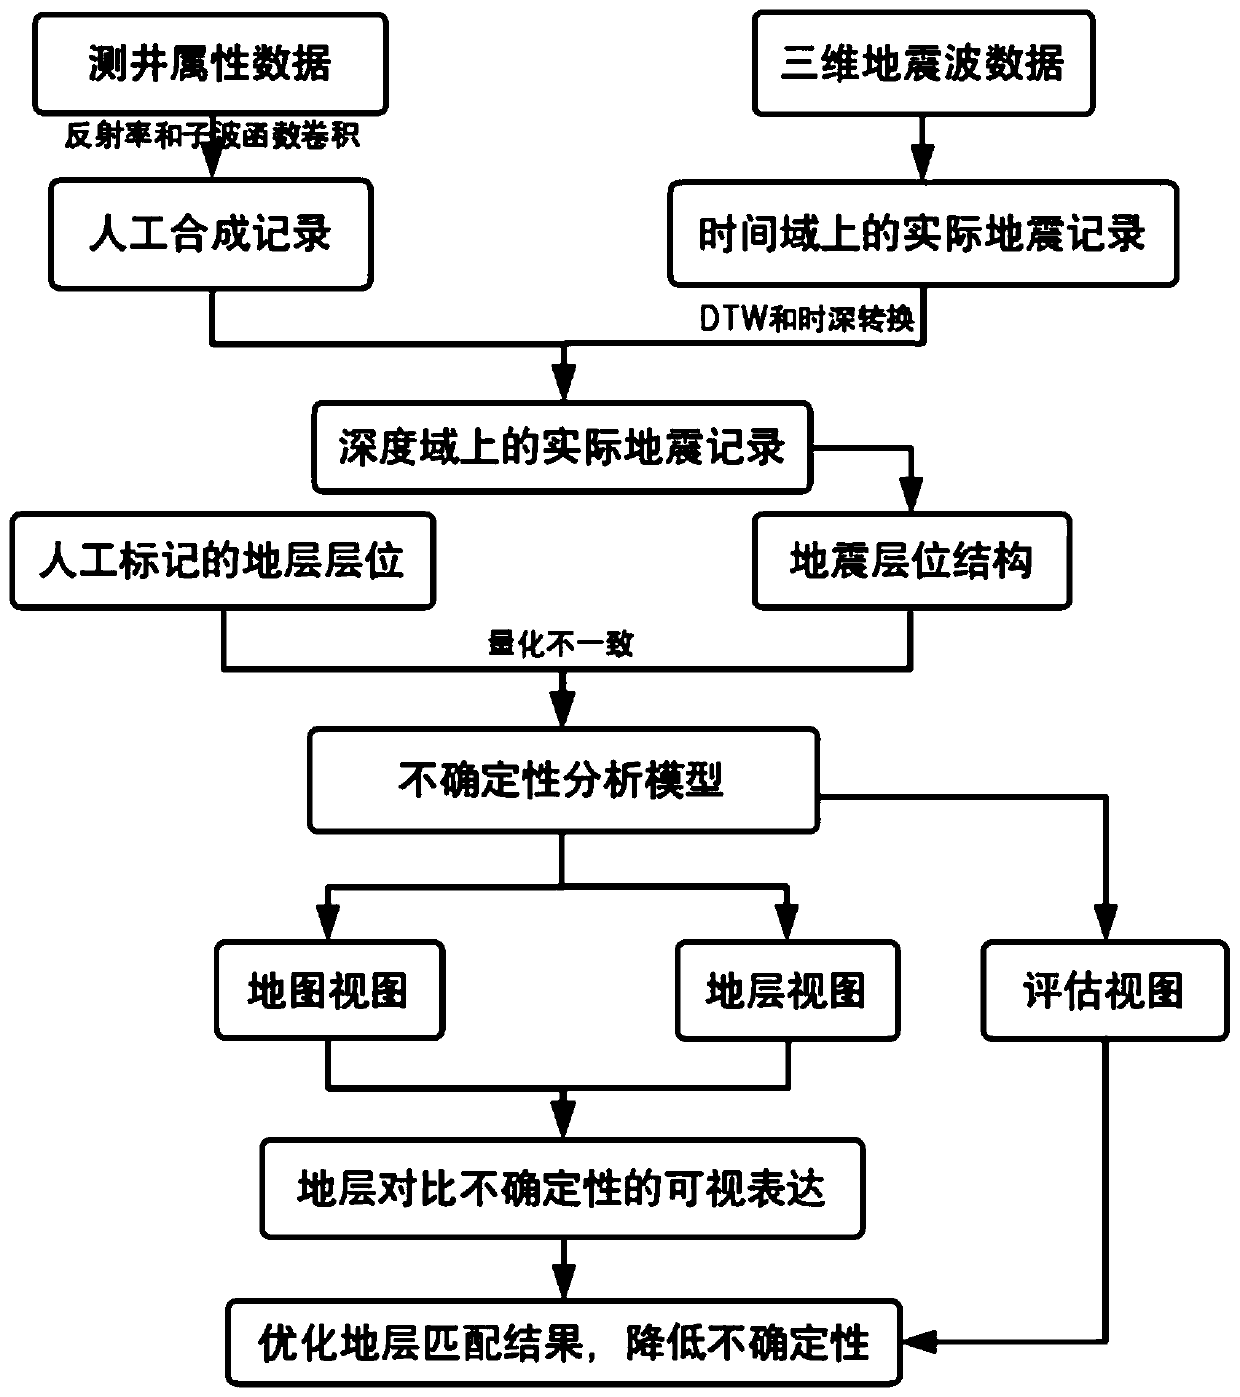
[0062] The process of this embodiment is as follows figure 1 As shown, the method generates synthetic seismic records for each well by convolving the reflectivity and wavelet functions; using dynamic time warping (DTW) to normalize the synthetic seismic records and real seismic records, and performing traditional time-depth Transform to match 3D seismic data and log attribute data; establish seismic horizon structure and quantify uncertainty differences between manually marked stratigraphic horizons and seismic horizons; develop an interactive visualization system for stratigraphic correlation uncertainties , design maps to help users observe the uncertainty of stratigraphic correlation between global or local drilling wells, design stratigraphic views to help users exp...


PUM


Abstract

The invention discloses a stratigraphic correlation uncertainty visualization method based on multi-source data fusion. The method is applied to quantizing quantization structure differences extractedfrom three-dimensional seismic wave data and logging attribute data; an uncertainty visualization system is developed; an uncertainty model is combined with visual design, so that a user is able to further improve a stratigraphic correlation result interactively; and the uncertainty of stratums with the inconsistent three-dimensional seismic wave data and logging attribute data is computed; visual expression and interaction of the uncertainty aim at help specialists verify and optimize the correlation result, so as to achieve visual uncertainty analysis in stratum comparison, and thus significance is provided for acquiring the accurate seismic interpretation. According to the method, the uncertainty of the stratum matching result can be reduced, the stratum matching accuracy can be enhanced, and plenty of labor and time also can be saved during a complex geological exploration process, and the rapid building of a geologic model, the effective formulating of petroleum, coal and other energy exploitation plans and the like are facilitated.

Description

technical field [0001] The invention belongs to the technical fields of petroleum exploration, graphics and visualization, and in particular relates to a visualization method for stratum correlation uncertainty based on multi-source data fusion. Background technique [0002] Due to the complexity of the subsurface geological structure, traditional stratigraphic correlation methods can only be described based on a single data set, which will cause great uncertainty in the process of stratigraphic correlation. Both logging attribute data and 3D seismic wave data can be effectively applied to stratigraphic correlation. Well logging attribute data reflects the relationship between formation properties and depth, and can effectively display the vertical changes of formation lithology and physical properties (S.M.Luthi and I.D.Bryant. Well-log correlation using aback-propagation neural network. Mathematical Geology, 29( 3): 413–425, 1997.). However, stratigraphic correlations ba...

Claims


Application Information

Patent Timeline
IPC IPC(8): G01V1/40G01V1/28G01V1/30G06K9/62
CPCG01V1/40G01V1/282G01V1/306G01V2210/624G06F18/251
Inventor 周志光张汝敏郭智勇刘玉华
Owner ZHEJIANG UNIV OF FINANCE & ECONOMICS
Learn More