A data visualization method based on user experience measurement

A technology of experience measurement and data, applied in the field of information visualization, can solve problems such as lack of

Active Publication Date: 2021-05-07
杭州菲尔德经济信息咨询有限公司
View PDF13 Cites 0 Cited by
  • Summary
  • Abstract
  • Description
  • Claims
  • Application Information

AI Technical Summary

Problems solved by technology

At present, in the field of visual representation, the research work focuses more on the user's visual perception and cognition to form some more authoritative design principles. It lacks different interactive technologies in data visualization systems, especially through interactive design to improve user experience satisfaction. system guiding methods and design principles

Method used


Image

  • A data visualization method based on user experience measurement
  • A data visualization method based on user experience measurement
  • A data visualization method based on user experience measurement

Examples


Embodiment Construction

[0078] The implementation of the technical solutions of the present invention will be further described in detail below in conjunction with the accompanying drawings.

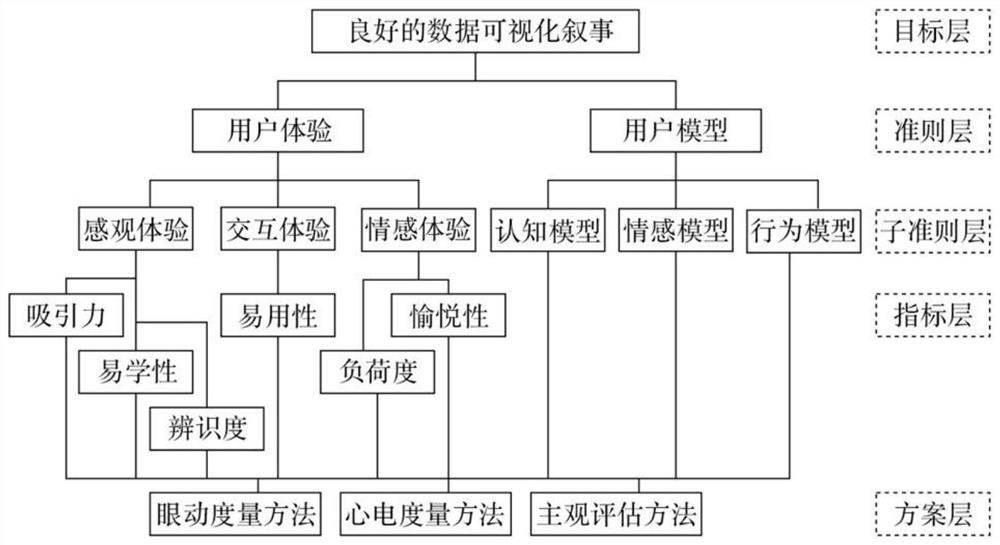
[0079] 1. If figure 1 As shown, on the basis of analyzing the relationship and attributes among the influencing factors of user experience, a data visualization narrative experience measurement model is constructed according to the basic principles of the hierarchical structure of target layer, program layer, and criterion layer;

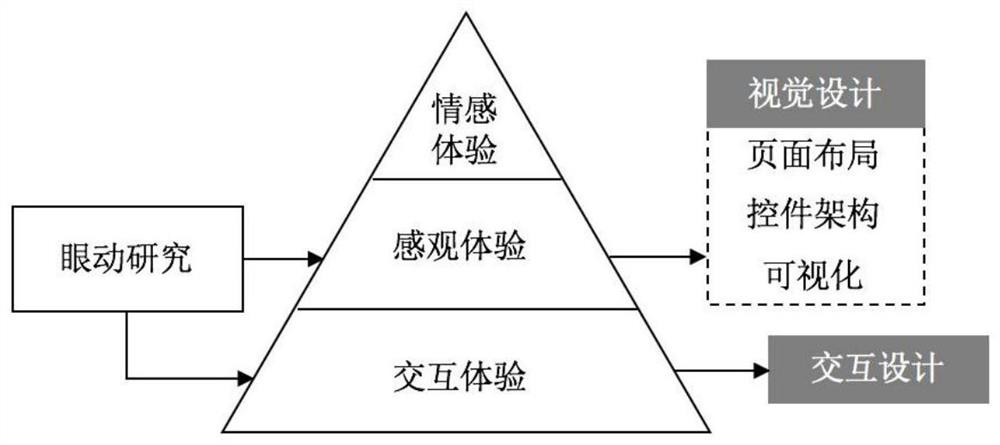
[0080] 2. If figure 2 As shown, design eye tracking data to measure user experience research method;

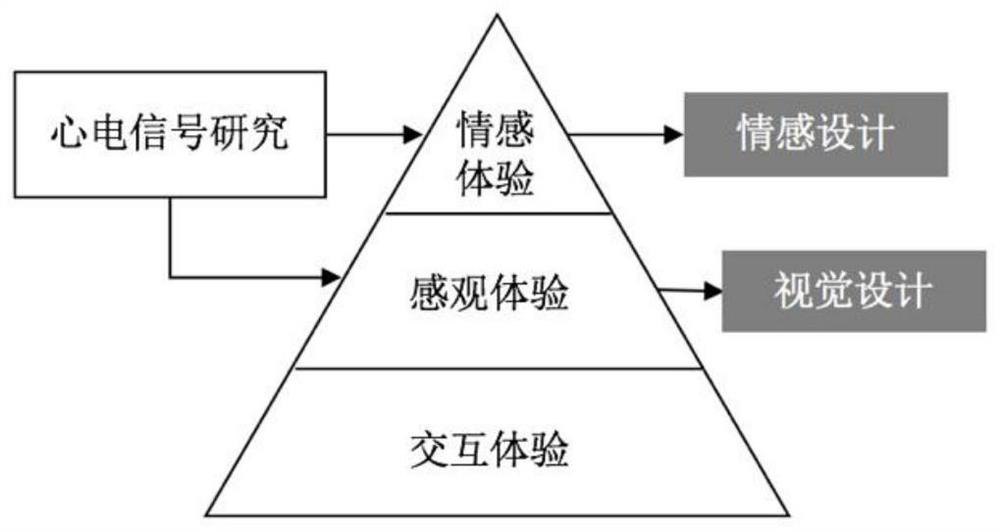
[0081] 3. If image 3 As shown, the research method of ECG signal data measurement user experience is designed;

[0082] 4. If Figure 4 As shown, the user experience measurement method model is built based on parallel nested hybrid;

[0083] 5. If Figure 5 As shown, the development and design model of data visualization narrative products is established.

[0084] Step 1. M...


PUM


Abstract

The invention discloses a data visualization method based on user experience measurement. The invention establishes a measurement model of data visualization narrative experience. Based on eye movement research and ECG research methods, a research method combining qualitative and quantitative research methods of parallel nesting research methods is proposed. According to the proposed research method, the experiment process of combining eye movement measurement and electrocardiogram measurement with data visualization narrative example is built, the quantitative value of experience index is extracted, and the experimental analysis results are applied to the optimization and improvement of data visualization narrative method. The present invention can innovatively introduce electrocardiogram measurement methods and eye movement measurement methods into the field of data visualization narrative research, and avoid subjective errors commonly present in traditional measurement methods by combining qualitative and quantitative methods. In the analysis of eye-tracking data, a spatial domain division method based on exploratory factor analysis is proposed, which provides a new method with higher accuracy for the division of interest regions of eye-tracking data.

Description

technical field [0001] This research involves a data visualization method based on user experience measurement, which belongs to the field of information visualization and can provide theoretical and technical support for interdisciplinary research in many fields such as data information dissemination and user cognitive behavior research. Background technique [0002] Transforming data sets into friendly and easy-to-understand images, that is, data visualization, is an important means for human beings to gain insight into the connotation of data and understand the laws of data. It can transform redundant data sets into friendly and easy-to-understand images. Data visualization comprehensively uses technologies such as computer graphics, image processing, and human-computer interaction to transform data into identifiable objects and present valuable information to users, thereby further acquiring knowledge and wisdom. Significant influence. [0003] The purpose of the presen...

Claims


Application Information

Patent Timeline
Patent Type & Authority Patents(China)
IPC IPC(8): G06F16/9038G06K9/62A61B3/113A61B5/346A61B5/00
CPCG06F16/9038A61B3/113A61B5/7253A61B5/318G06F18/2135G06F18/24
Inventor 王强张丽婵杨安宁
Owner 杭州菲尔德经济信息咨询有限公司
Why Eureka
Try Eureka