Infrared spectrum analysis method for identifying ABO blood types on basis of tissue slices
A technology of infrared spectrum analysis and ABO blood type, which is applied in the field of human blood type prediction, can solve the problems of inconspicuous agglutination, poor interference durability, and long detection time, and achieve good durability, easy operation, and fast detection.
- Summary
- Abstract
- Description
- Claims
- Application Information
AI Technical Summary
Problems solved by technology
Method used
Image
Examples
Embodiment 1
[0041] Example 1 An infrared spectrum DA method for identifying ABO blood types based on tissue sections
[0042] 1. Collection of samples
[0043] A total of 59 unstained lung pathological tissue sections (29 sclerosing alveolar cell tumor tissue sections and 30 lung adenocarcinoma in situ tissue sections) were collected from different patients, including 34 A blood type slices, 5 B blood type slices, 8 One slice of AB blood type and 12 slices of O blood type, record the blood type information corresponding to each slice.
[0044] 2. Spectral measurement
[0045] After preheating the infrared spectrometer for 2 hours and passing the calibration, use the polystyrene film provided with the machine to confirm that it meets the requirements of spectral measurement, and set the spectral measurement parameters: resolution 8cm -1 , Scan times 64 times, scan range 4000 ~ 1900cm -1 , measure the infrared transmission spectrum of each slice, scan with the same parameters before each...
Embodiment 2
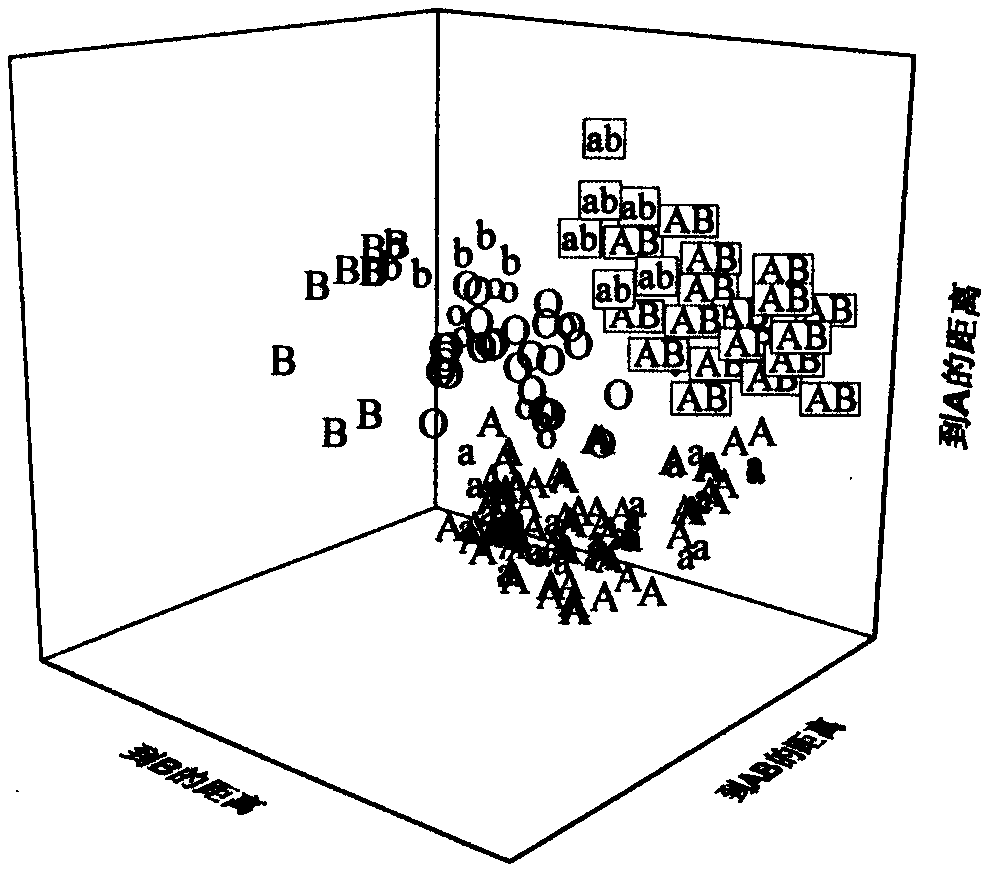
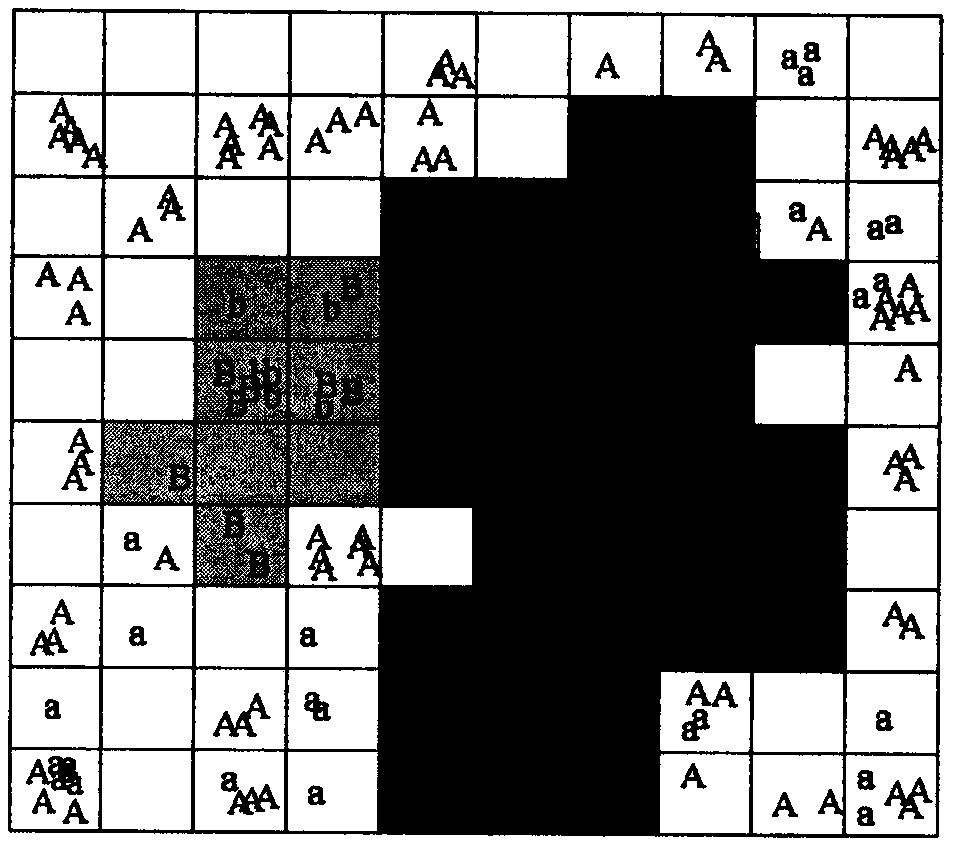
[0059] Example 2 An infrared spectrum CP-ANN method for identifying ABO blood types based on tissue sections
[0060] 1. Collection of samples
[0061] With embodiment 1.
[0062] 2. Spectral measurement
[0063] With embodiment 1.
[0064] 3. Extraction and modeling of spectral characteristic variables
[0065] (1) Selection of spectral pretreatment scheme
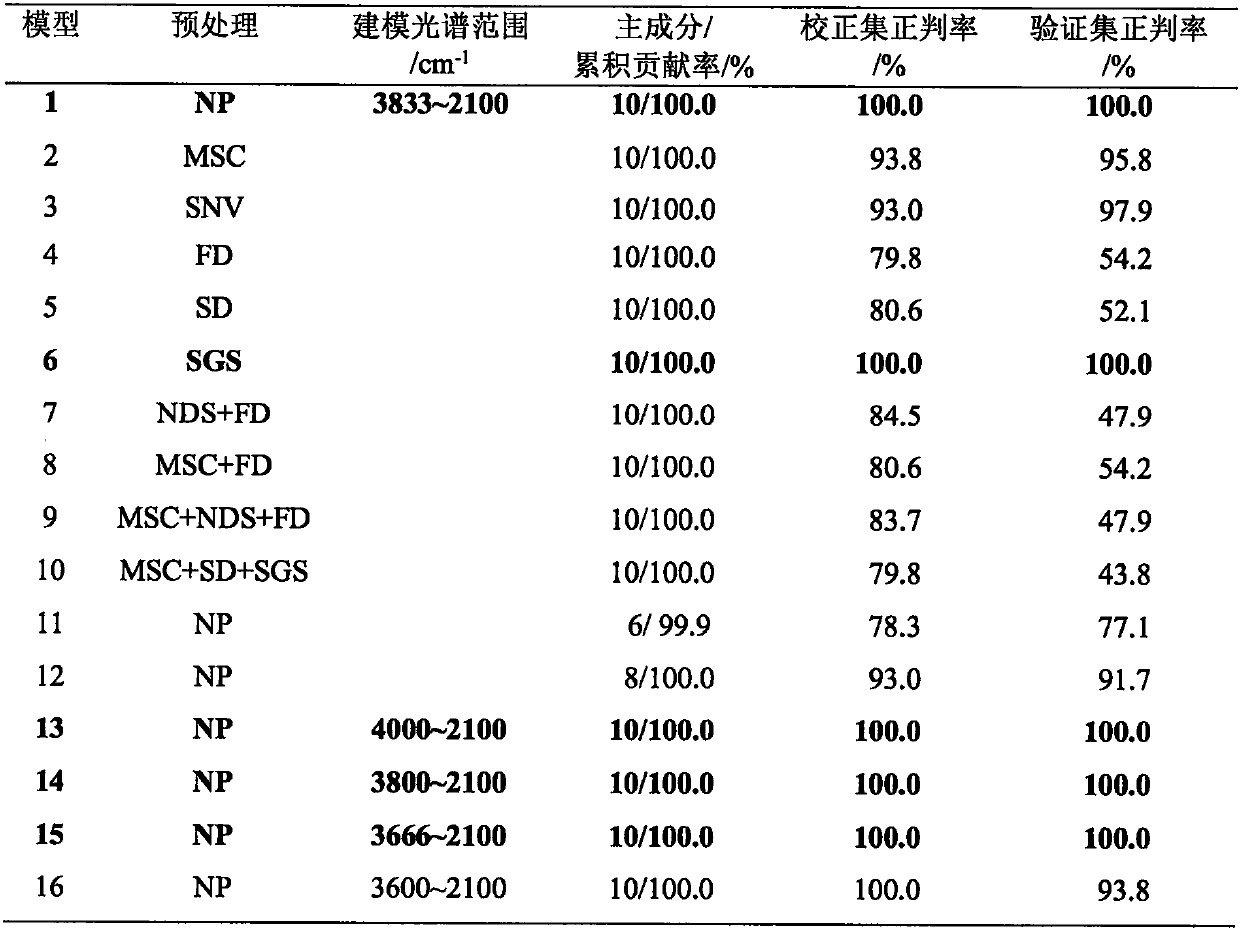
[0066] In order to make the built model have excellent prediction performance, various spectral preprocessing techniques including NP, MSC, SNV, FD, SD, SGS, and NDS were screened and combined, as shown in Table 2. The results show that when the obtained spectra are preprocessed by NP, the prediction performance of the built CP-ANN model is the best, as shown in model 1 in Table 2.
[0067] (2) Selection of modeling spectral range
[0068] Since the sample spectrum used to establish and verify the CP-ANN model is the same as that of the DA model, and the prediction characteristics of the two models are also blood ty...
PUM
 Abstract
Description
Claims
Application Information
 - R&D
- Intellectual Property
- Life Sciences
- Materials
- Tech Scout
- Unparalleled Data Quality
- Higher Quality Content
- 60% Fewer Hallucinations
Browse by: Latest US Patents, China's latest patents, Technical Efficacy Thesaurus, Application Domain, Technology Topic, Popular Technical Reports.
© 2025 PatSnap. All rights reserved.Legal|Privacy policy|Modern Slavery Act Transparency Statement|Sitemap|About US| Contact US: help@patsnap.com


