A method of processing thunderstorm core correlations
A processing method and related technology, applied in measurement devices, meteorology, scientific instruments, etc., can solve the problem of not being able to give the geographical distribution density of lightning, not solving the problem of quantification of cloud-to-ground flash frequency, not giving the single form and Volume changes and other issues to achieve the effect of classification and optimization
- Summary
- Abstract
- Description
- Claims
- Application Information
AI Technical Summary
Problems solved by technology
Method used
Image
Examples
Embodiment 1
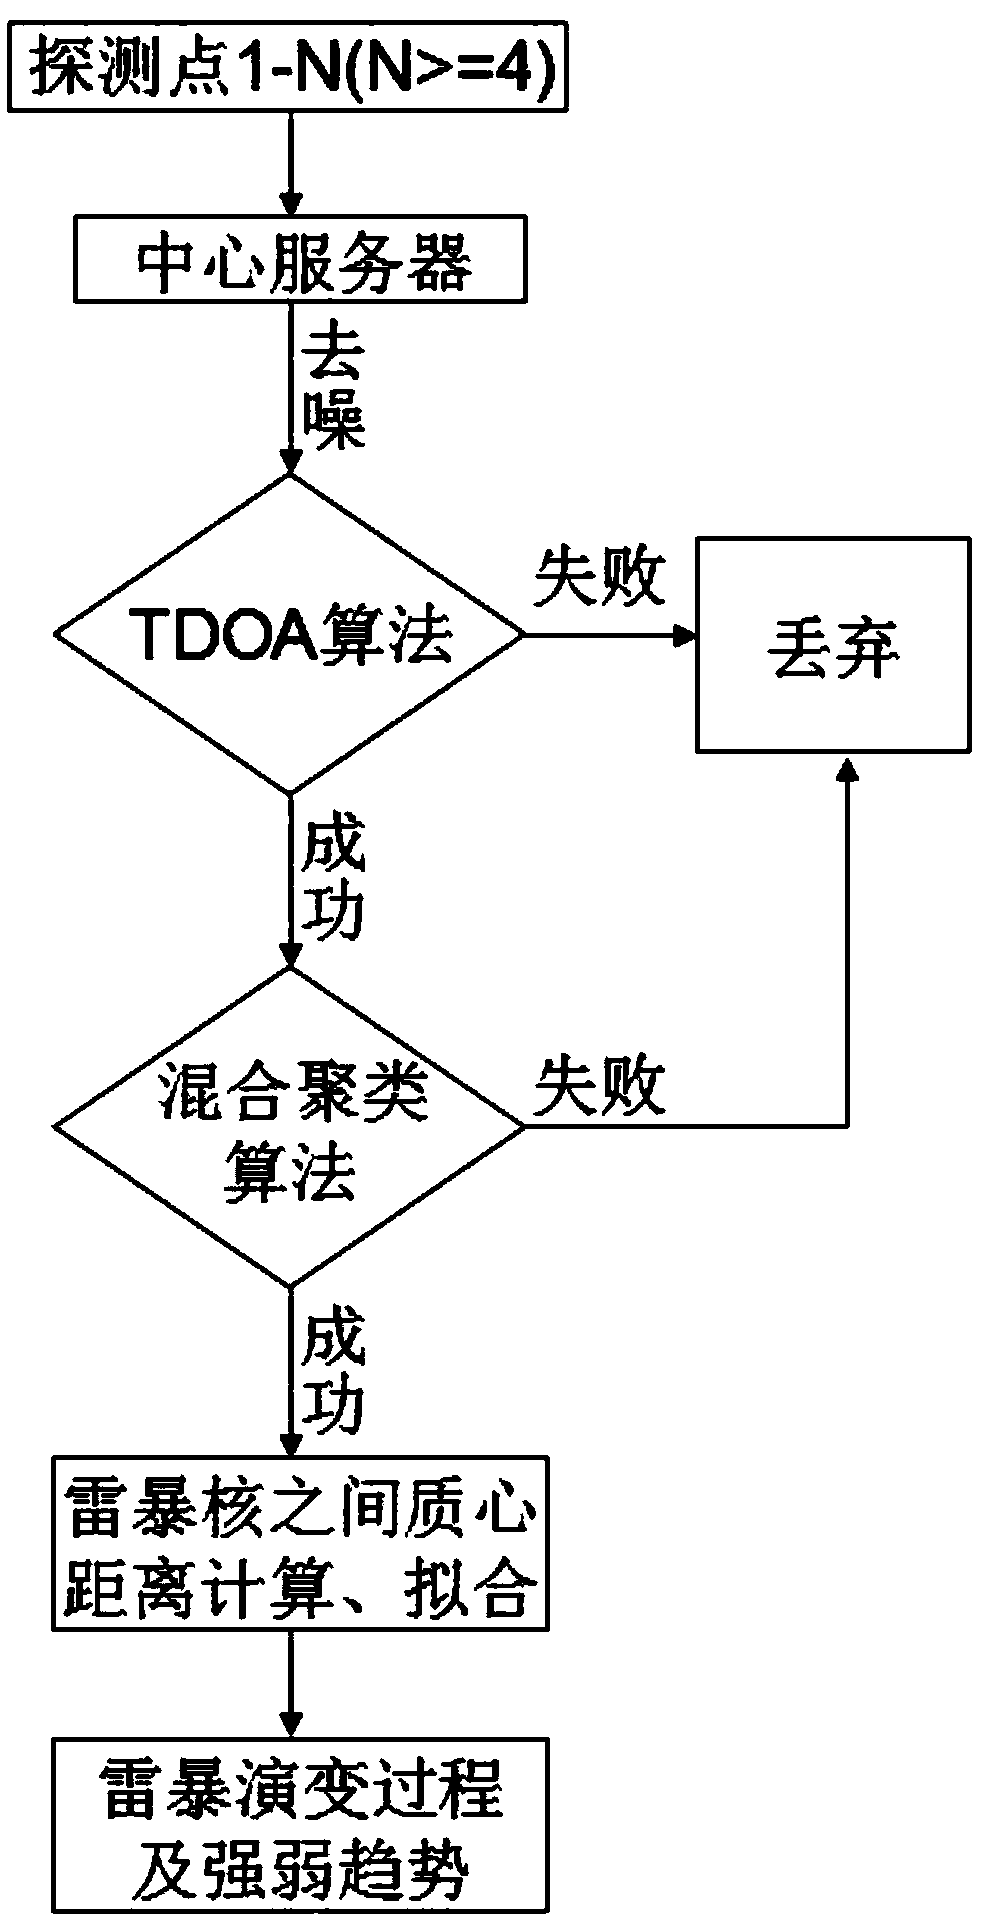
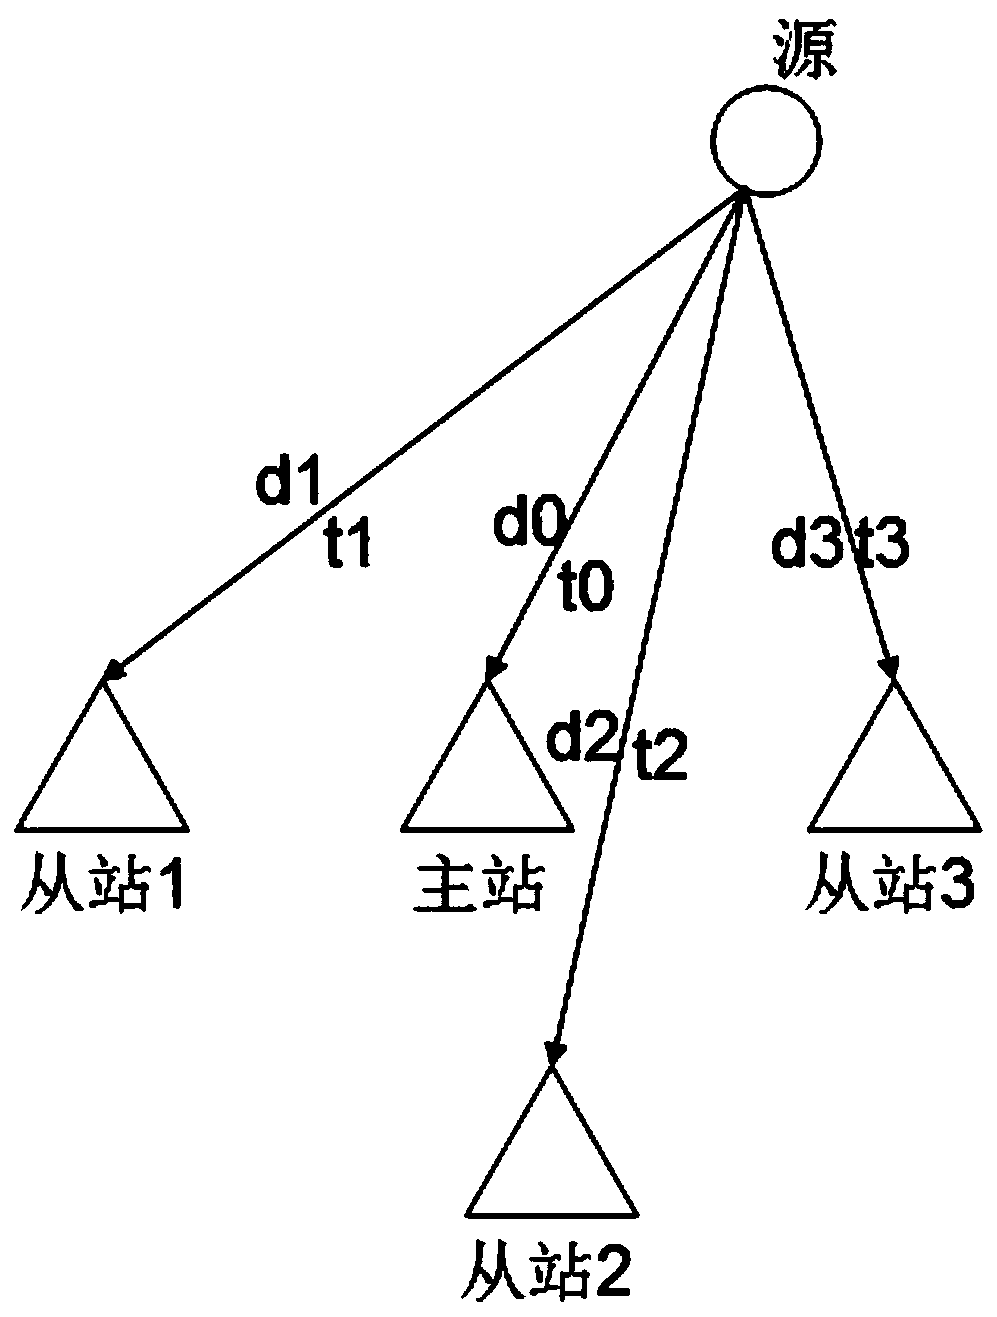
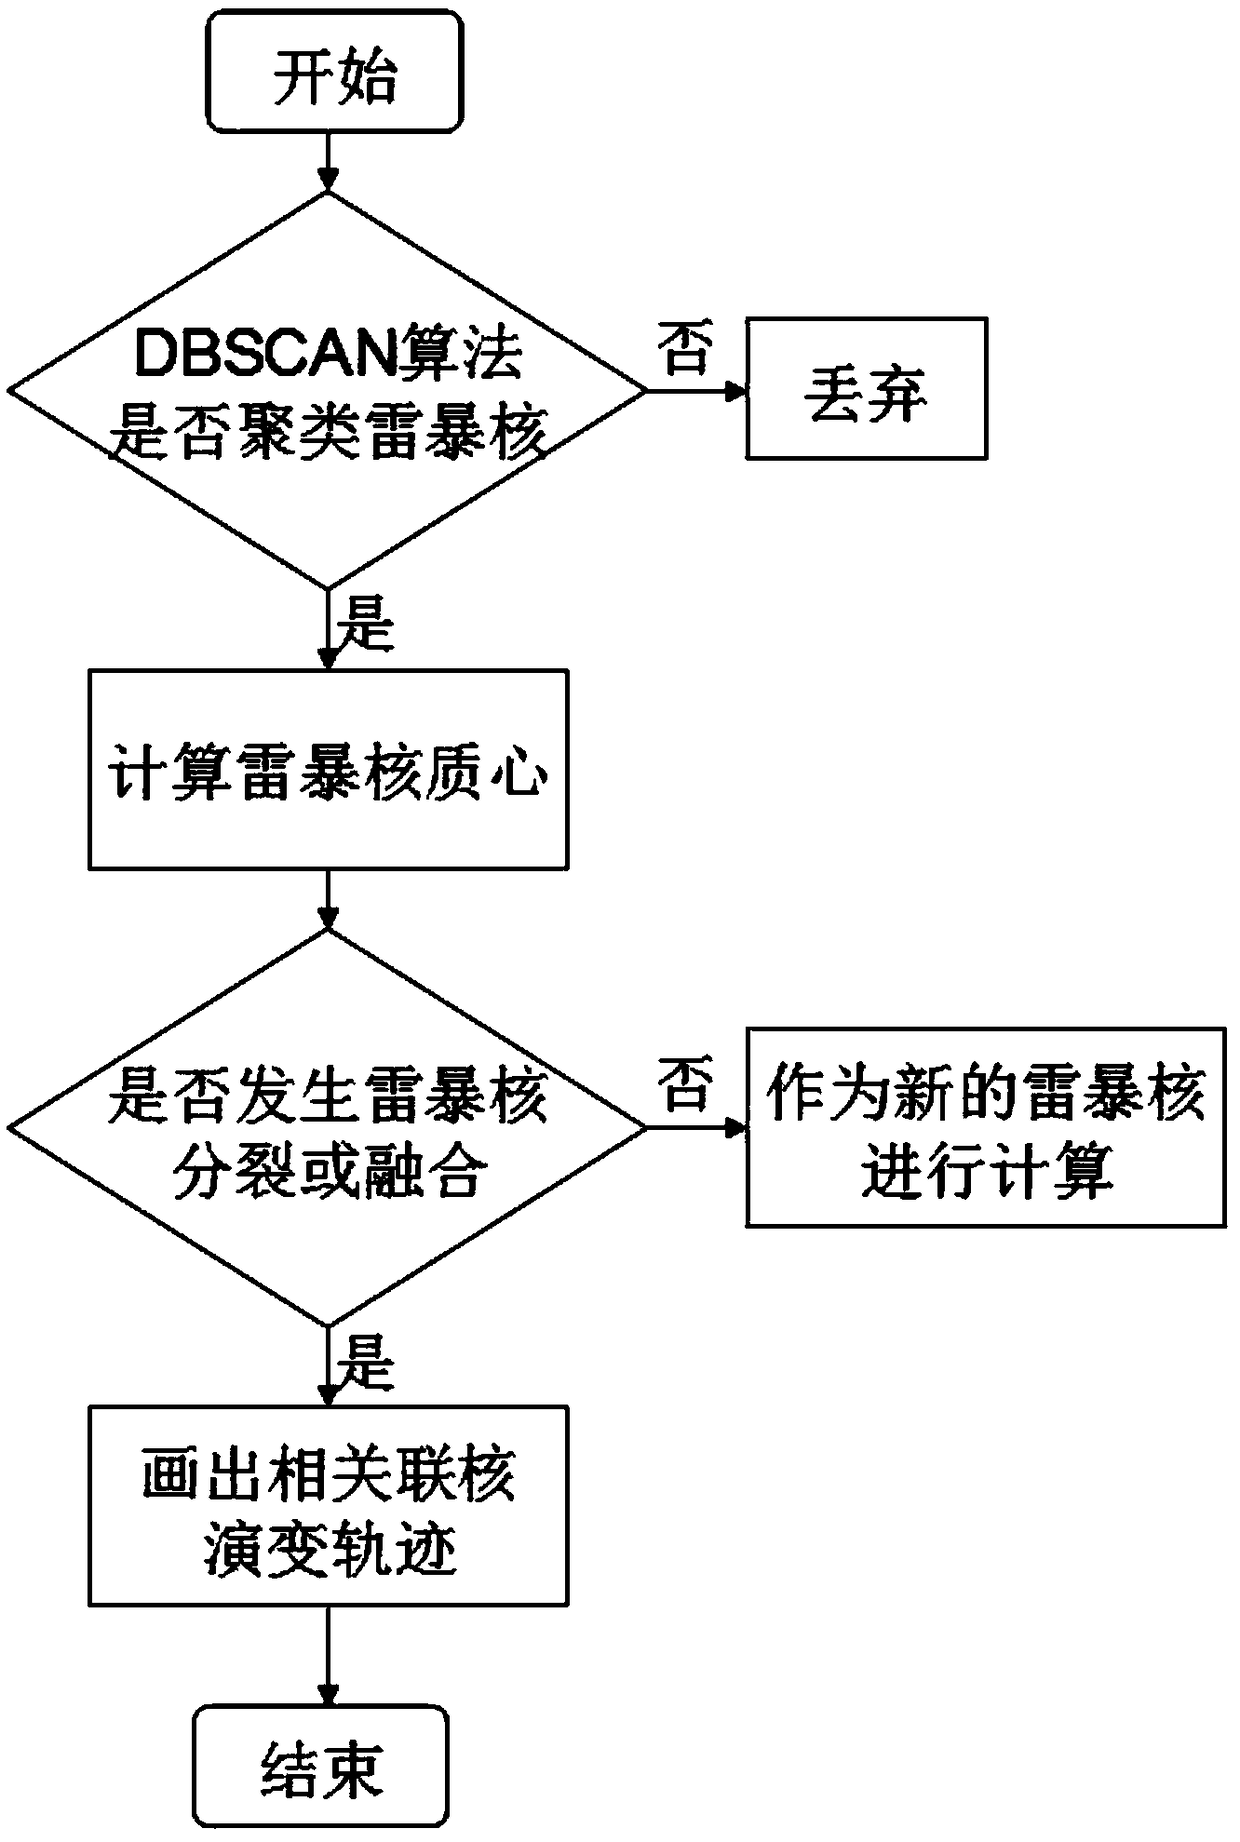
[0036] The invention provides a method for processing thunderstorm nuclear correlation, such as figure 1 As shown, this method is based on the lightning data transmitted by the detection point, using the arrival time difference algorithm to obtain real-time positioning data, and then using the density-reachable characteristic of the DBSCAN algorithm to aggregate the lightning data set into several clusters, and the data set of each cluster is used as The new input is then iteratively aggregated using the KMEANS algorithm to find the coordinate position of the centroid. On the basis of the cluster analysis results, the moving path of the centroid coordinate point and the intensity of lightning are fitted to obtain the correlation between thunderstorm nuclei and the change trend of thunderstorm nuclei. The results show that the method can effectively identify thunderstorms and track them in real time, and can effectively deal with the splitting and merging of thunderstorms, and ...
Embodiment 2
[0060] Select the thunderstorm weather instance data that occurred from 12:30 to 13:00 on August 19, 2017, Beijing time. A total of 14402 pieces of lightning location data occurred during this period, such as Figure 4 As shown, what is displayed is the instantaneous screen of the map of the lightning data part of the 6 minutes from 12:36 to 12:42. The half-hour data is divided into an interval of every 3 minutes on the time scale, as shown in Table 1.
[0061] Table 1 Statistical information of lightning location data at equal intervals
[0062]
[0063]
[0064] As shown in Table 1, the lightning location data are presented in a disorderly manner on the map, and the location of the thunderstorm nucleus and the correlation between the nuclei cannot be seen, nor can the evolution process of the thunderstorm nucleus be seen. The data in Table 1 is used as the original data set , input the hybrid clustering algorithm for clustering calculation. First, set the two parame...
Embodiment 3
[0066] Taking the thunderstorm data in Chuzhou, Anhui as an example, the evolution process of thunderstorms is as follows: Figure 6 As shown, the clustering results are shown in Table 2.
[0067] Table 2 Mixed clustering results
[0068] ID
[0069] It can be seen from Table 2 that with the change of time, the frequency of lightning increases and then weakens and then strengthens again, and the coordinate points of the center of mass of the thunderstorm nucleus are also constantly changing. The coordinate points of the center of mass of the thunderstorm nucleus are drawn as connected to form a thunderstorm trajectory map, such as Figure 6 As shown in the figure, it can be seen intuitively that the distribution area of thunderstorm nuclei is moving and the correlation between thunderstorm nuclei. The frequency of lightning occurrence is as follows: Figure 7 as shown, Figure 7 The real-time information of the thunderstorm nucleus is displayed in detail, such...
PUM
 Abstract
Description
Claims
Application Information
 - R&D
- Intellectual Property
- Life Sciences
- Materials
- Tech Scout
- Unparalleled Data Quality
- Higher Quality Content
- 60% Fewer Hallucinations
Browse by: Latest US Patents, China's latest patents, Technical Efficacy Thesaurus, Application Domain, Technology Topic, Popular Technical Reports.
© 2025 PatSnap. All rights reserved.Legal|Privacy policy|Modern Slavery Act Transparency Statement|Sitemap|About US| Contact US: help@patsnap.com


