Axial flow fan vibration signal sub-component extraction method based on inverse short-time fourier transform
A short-time Fourier and axial flow fan technology, applied in the field of signal processing, can solve the problem that the accuracy of the signal cannot be guaranteed, and achieve the effects of high-efficiency conversion, fast operation speed, and simple algorithm
- Summary
- Abstract
- Description
- Claims
- Application Information
AI Technical Summary
Problems solved by technology
Method used
Image
Examples
Embodiment 1
[0053] Embodiment 1, the situation of stationary signal simulation
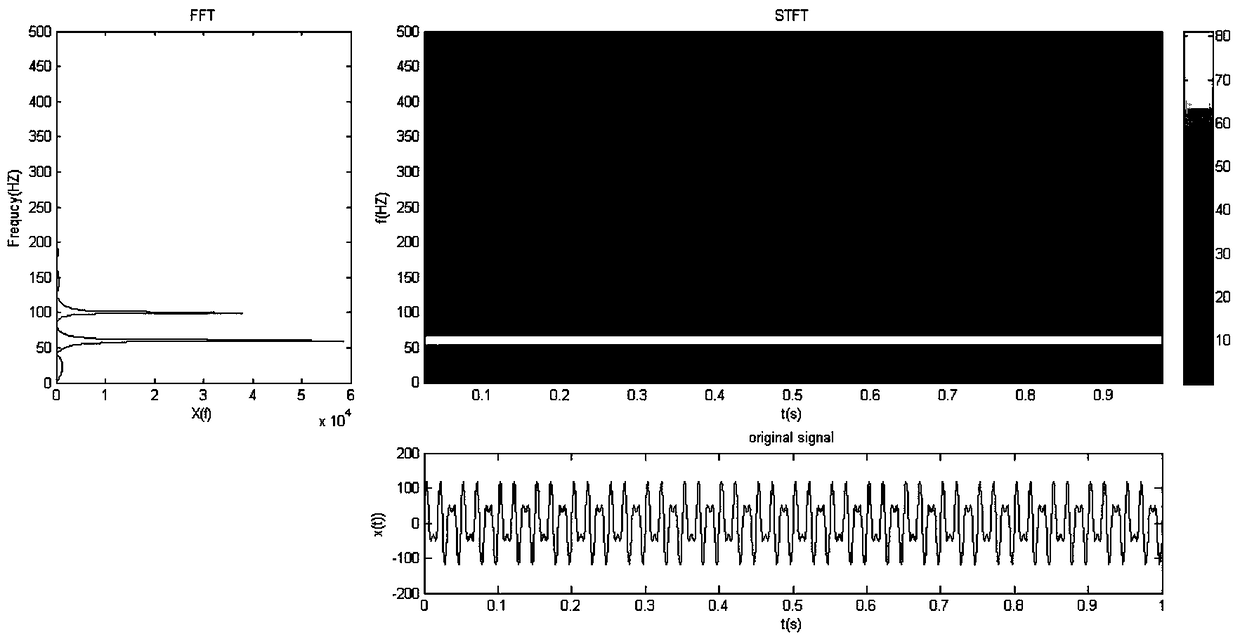
[0054]S01, set the simulation signal: x=80sin(2π·60t)+50sin(2π·100t)t is the time, in this example from 0 to 1 second, the sampling frequency is 1000, the length is 1000, and the number of sampling points N in the frequency domain is 1024 ;
[0055] S02, make the time domain, frequency domain and time-frequency diagram of the signal, STFT parameters: window length win=100, overlap rate 0.5, overlap length overlap=50, see figure 2 ;
[0056] S03, constructing a zero vector Z, calculating the amplitude correction coefficient h=win-overlap;
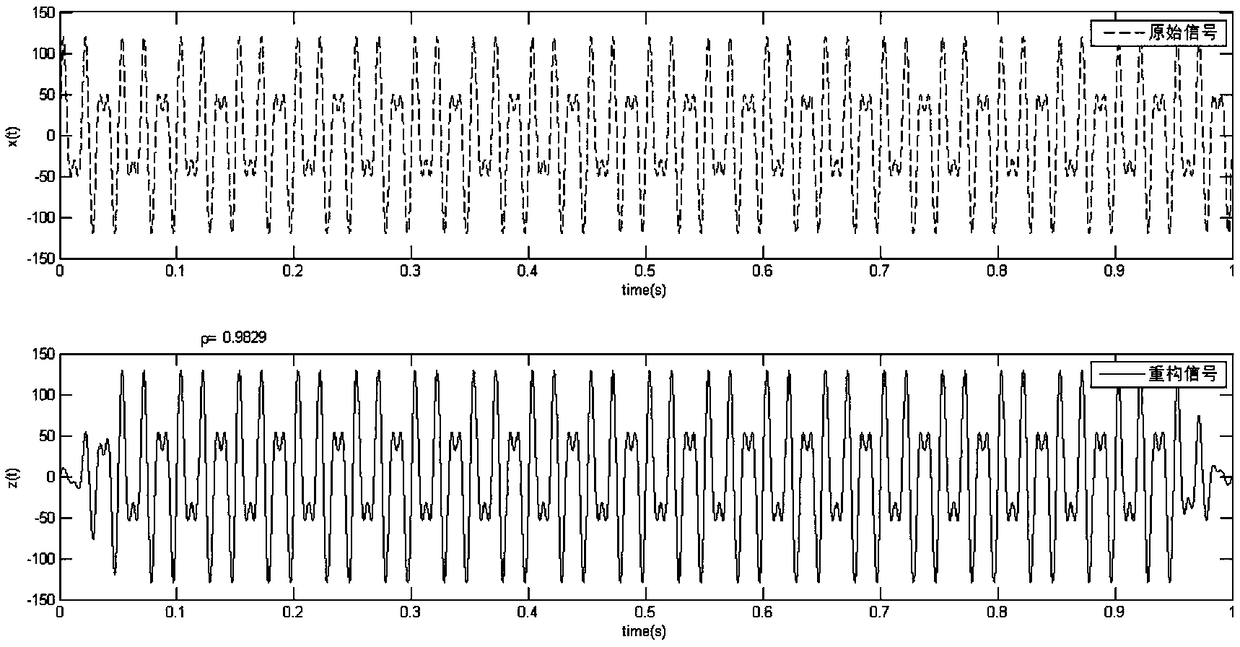
[0057] S04, input the corresponding parameters, and completely restore the original signal according to the time-frequency diagram, the algorithm result is as follows image 3 shown. The dotted line signal is the original signal, the solid line signal is the reconstructed signal, and ρ is the correlation coefficient;
[0058] S05, the specified time period is between ...
Embodiment 2
[0065] Embodiment 2, frequency conversion signal simulation situation
[0066] S01, set chirp signal,
[0067] x=80sin(2π·60t+π·10t 2 )
[0068] The parameters are the same as those in the simulation case 1, and the time-frequency diagrams in the time domain, frequency domain and short-time Fourier transform are made, as shown in Figure 7 shown;
[0069] S02, input the corresponding parameters, restore the reconstructed signal in the complete time and frequency segment according to the time-frequency diagram, such as Figure 8 Shown; the dotted line signal is the original signal, the solid line signal is the reconstructed signal, and ρ is the correlation coefficient;
[0070] S03, input the corresponding parameters, set the frequency range to 100-150HZ, and make a reconstructed signal diagram, such as Figure 9 As shown; the dotted line signal is the original signal, and the solid line signal is the reconstructed signal. It can be seen that the signal is roughly within 0...
Embodiment 3
[0071] Embodiment 3, the vibration data of actual fan
[0072] S01, collect the vibration data of a section of the actual operation of the fan. It is known that the rotation frequency of the fan is 20HZ, and the sampling interval is 0.2ms;
[0073] S02, perform wavelet noise reduction processing on the signal, and make its time-domain diagram, frequency-domain diagram and time-frequency diagram after short-time Fourier transform, such as Figure 10 shown;
[0074] S03, input the corresponding parameters, view the reconstructed signal in the complete time and frequency band, and reconstruct the signal according to the time-frequency diagram, such as Figure 11 Shown; the dotted line signal is the original signal, the solid line signal is the reconstructed signal, and ρ is the correlation coefficient;
[0075] S04, input the corresponding parameters, set the viewing time period to 0.6 to 1.6s, and the frequency period to 10 to 25HZ, the algorithm results are as follows Figur...
PUM
 Abstract
Description
Claims
Application Information
 - R&D
- Intellectual Property
- Life Sciences
- Materials
- Tech Scout
- Unparalleled Data Quality
- Higher Quality Content
- 60% Fewer Hallucinations
Browse by: Latest US Patents, China's latest patents, Technical Efficacy Thesaurus, Application Domain, Technology Topic, Popular Technical Reports.
© 2025 PatSnap. All rights reserved.Legal|Privacy policy|Modern Slavery Act Transparency Statement|Sitemap|About US| Contact US: help@patsnap.com


