Qualitative detection method for pollen species and pollen volatile organic compounds
A technology of volatile organic compounds and identification methods, which is applied in the field of pollen analysis, can solve the problems of pollen sample damage and time-consuming, and achieve the effects of high accuracy, high-throughput detection and analysis, and improved efficiency
- Summary
- Abstract
- Description
- Claims
- Application Information
AI Technical Summary
Problems solved by technology
Method used
Image
Examples
Embodiment 1
[0070] The detection method and principle of embodiment 1 pollen volatile organic compound
[0071] Using gas-phase ion mobility chromatography, the instrument can quickly detect volatile organic compounds in pollen after headspace sampling without vacuum and sample pretreatment, combined with related plug-ins and the built-in NIST gas phase retention index database and IMS According to the difference in retention time, ion migration time and ion peak intensity between different volatile organic compounds, different pollens were detected separately. It is characterized in that the method comprises the following steps:
[0072] Preparation steps of pollen volatile organic compound samples:
[0073] (1) Weigh 1.000g of pollen sample;
[0074] (2) Place directly into a 20mL headspace vial;
[0075] (3) The volatile gas after volatilization for 1 hour at normal temperature is used as a sample;
[0076] (4) The gas-phase ion mobility chromatograph separates and detects pollen v...
Embodiment 2
[0096] Implementation 2 Establishment of Standard Atlas of Volatile Organic Compounds in Pollen
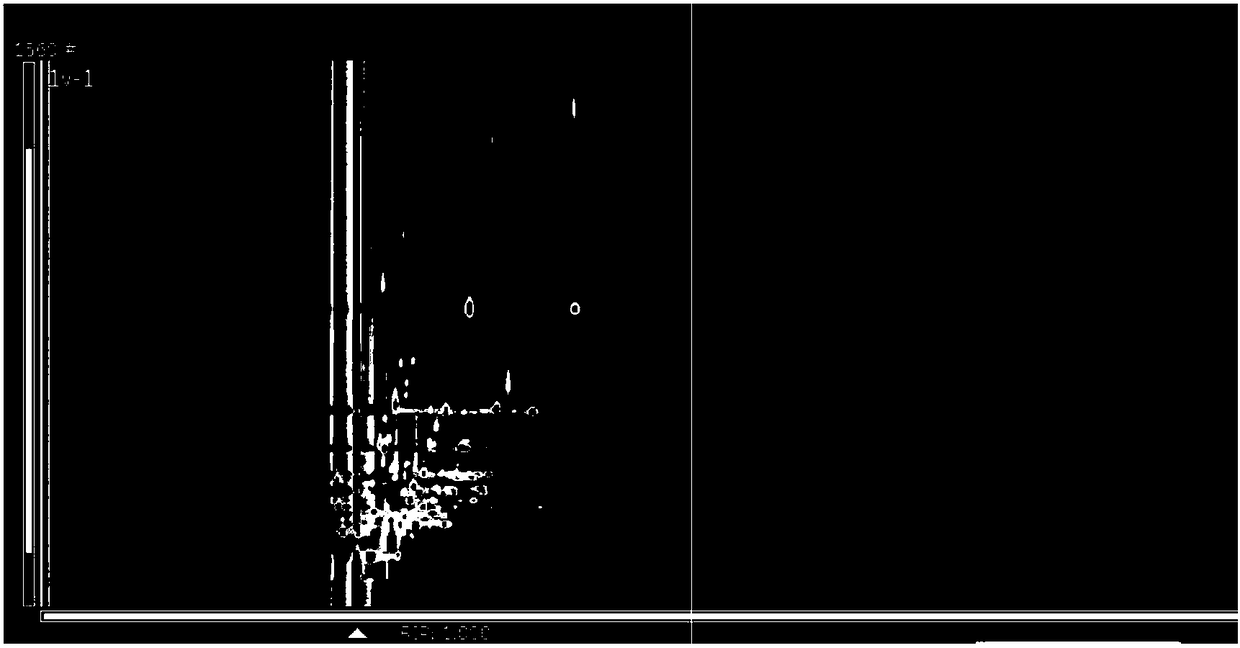
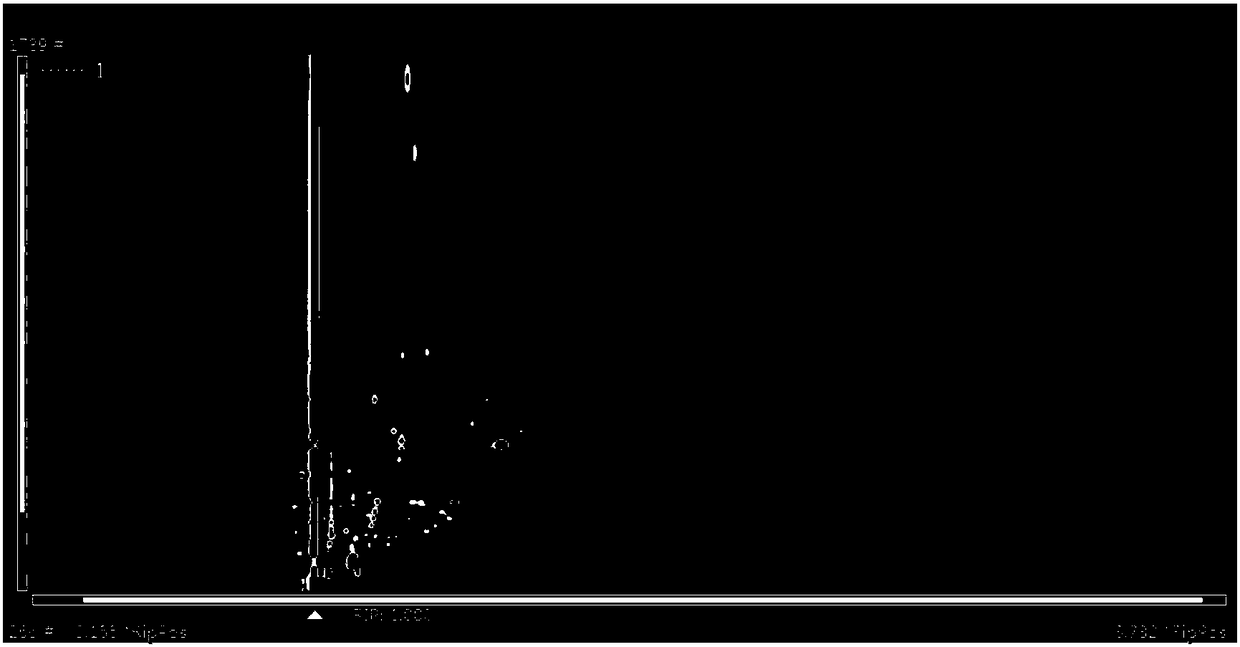
[0097] The pollen of Humulus japonicus and Artemisia annua were used as the samples to be detected respectively, and the detection was carried out according to the method in Example 1, and the spectra were drawn. Among them, the standard spectrum of volatile organic compounds in Humulus pollen is as follows: figure 1 shown. The standard spectrum of volatile organic compounds in Artemisia annua pollen is as follows: figure 2 shown. figure 1 and figure 2 Middle: a. The ordinate represents the retention time of gas chromatography, and the abscissa represents the ion migration time; b. The background of the whole figure is black, and the vertical line at abscissa 1.0 is the RIP peak (reaction ion peak, after normalization); c .Each dot on either side of the RIP peak represents a VOC. The color represents the concentration of the substance, with white representing a lower concen...
Embodiment 3
[0098] Difference analysis between a small amount of pollen samples of embodiment 3
[0099] 1. Difference analysis among four kinds of autumn pollen samples
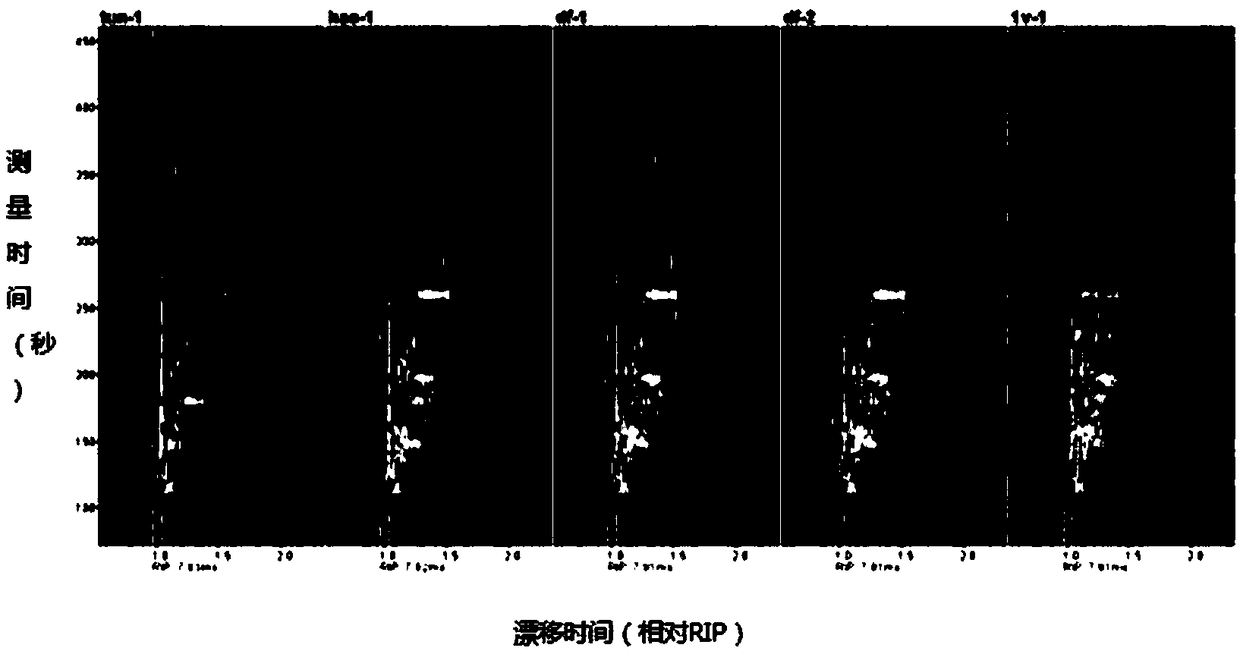
[0100] (1) Direct comparison of spectra: Visually observe the difference between sample spectra, such as image 3 shown. in, image 3 From left to right are ragweed-1, Artemisia grandis-1, Kochia-1, Kochia-2 and Humulus-1. It can be seen from the figure that there are great differences among different pollens, and Kochia There is a high degree of similarity between the two parallel samples.
[0101] (2) Difference comparison: select a spectrum as a reference, and subtract this spectrum from all the graphs. In the subtracted spectrum, the cleaner the background, the better the similarity with the reference, and the color on the graph The shade indicates the concentration of the substance, the darker the color, the higher the concentration than the reference, and the lighter the concentration of the substance is lower...
PUM
 Abstract
Description
Claims
Application Information
 - R&D
- Intellectual Property
- Life Sciences
- Materials
- Tech Scout
- Unparalleled Data Quality
- Higher Quality Content
- 60% Fewer Hallucinations
Browse by: Latest US Patents, China's latest patents, Technical Efficacy Thesaurus, Application Domain, Technology Topic, Popular Technical Reports.
© 2025 PatSnap. All rights reserved.Legal|Privacy policy|Modern Slavery Act Transparency Statement|Sitemap|About US| Contact US: help@patsnap.com


