PM2.5 concentration detection device based on photoacoustic spectroscopy
A concentration detection and photoacoustic spectroscopy technology, applied in the field of photoacoustic spectroscopy, can solve the problems of easy blocking, easy adhesion of aerosols, and the sensitivity and response speed need to be further improved. High sensitivity effect
- Summary
- Abstract
- Description
- Claims
- Application Information
AI Technical Summary
Problems solved by technology
Method used
Image
Examples
experiment example 1
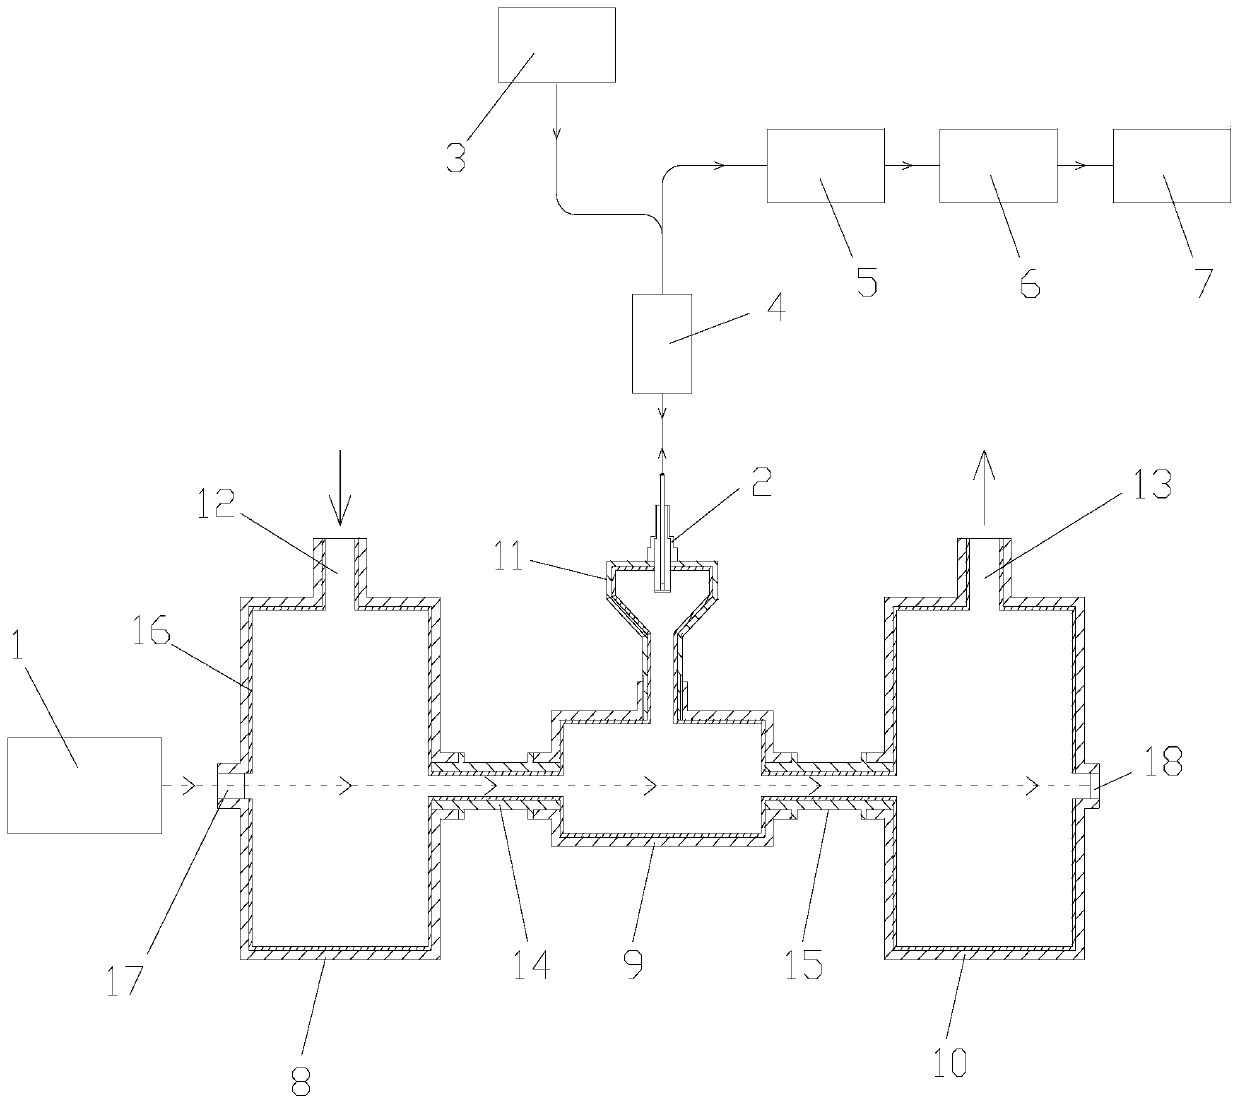
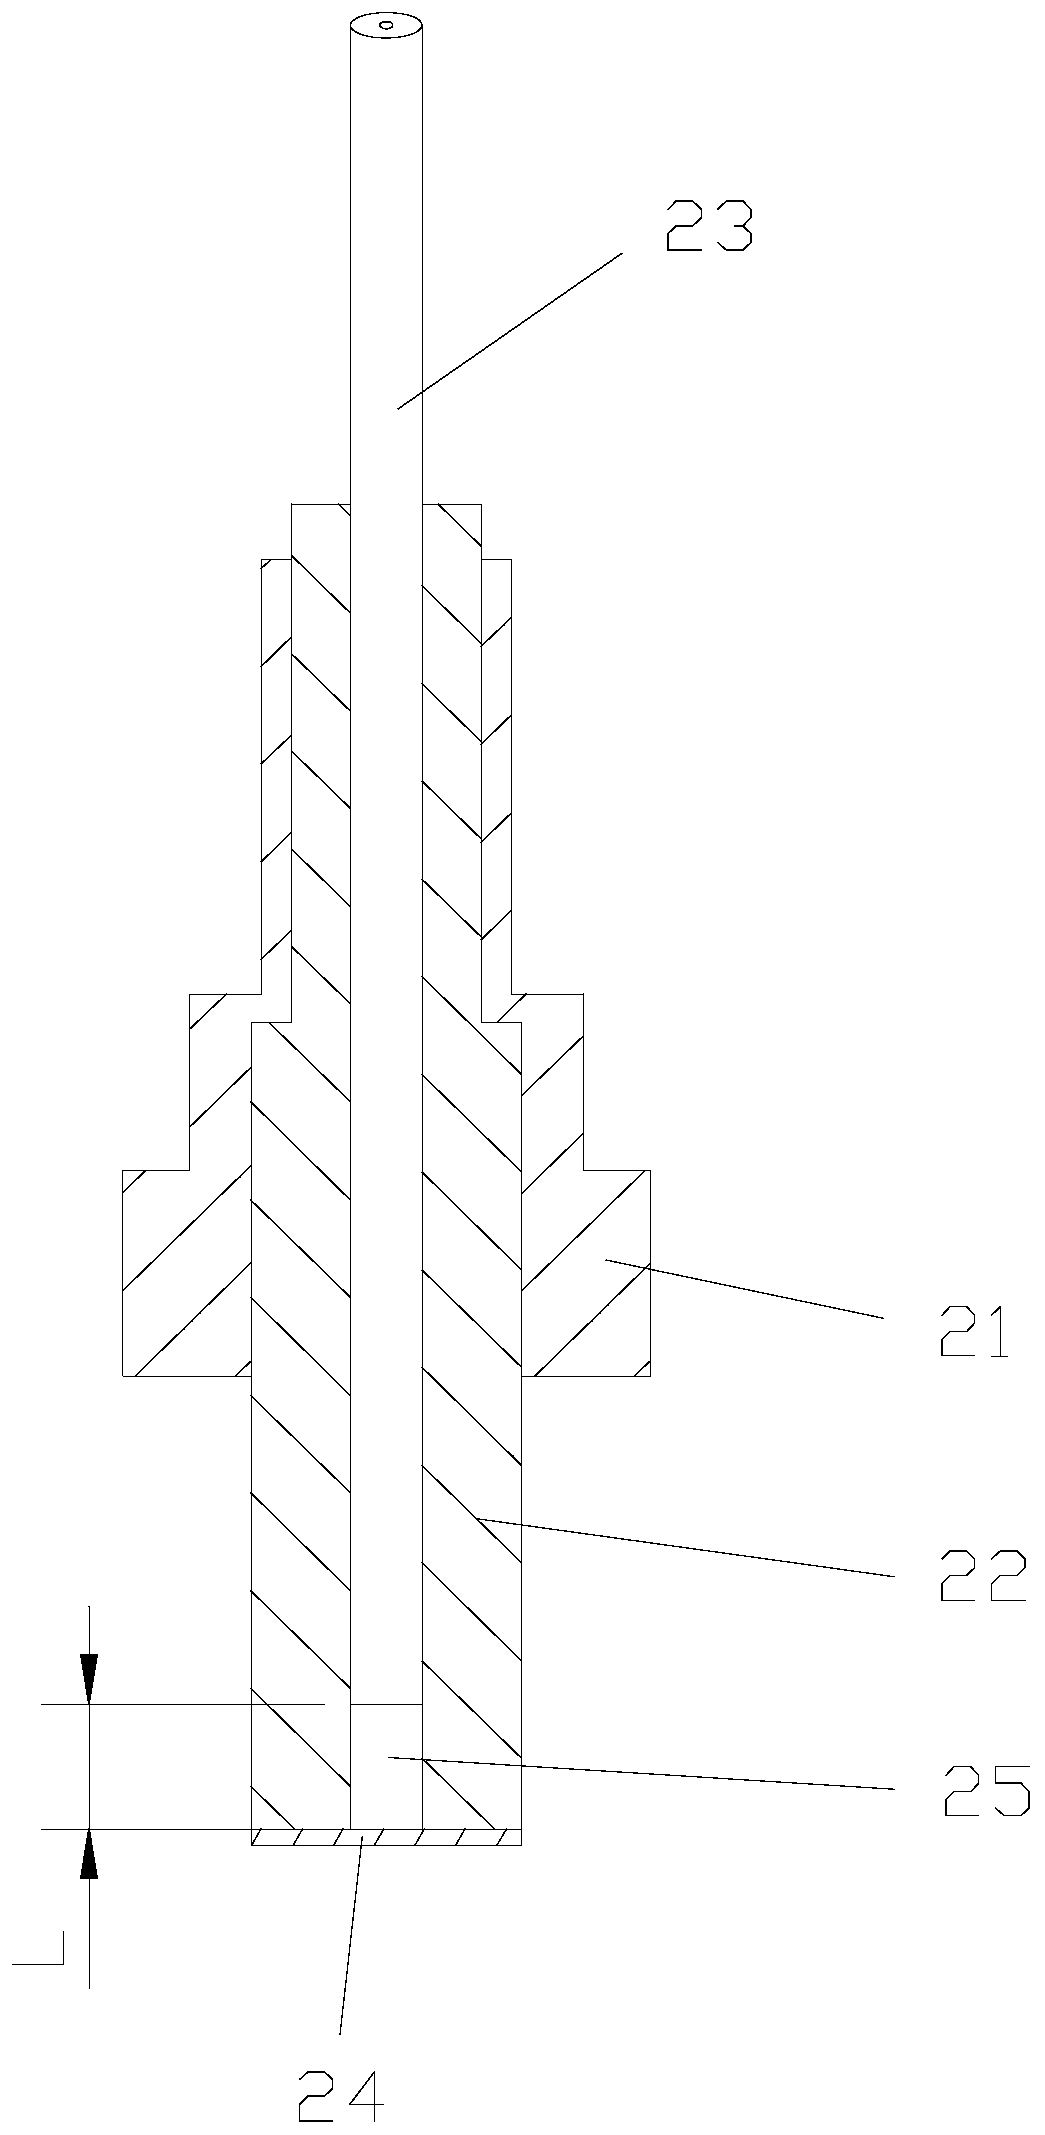
[0066] Experiment 1: PM 2.5 The particle generator can produce mass concentration of 0-200μg / m 3 PM 2.5 , and the known mass concentration of PM 2.5 Pass into the photoacoustic cell, and place the photoacoustic cell at room temperature (25°C) for experiments. Thanks to PM 2.5 The particles absorb light energy to generate sound pressure signals, which makes the fluorinated graphyne diaphragm on the optical fiber F-P detector (the thickness of the fluorinated graphyne diaphragm is 150nm) vibrate, that is, the cavity length of the optical fiber F-P sensor changes, and through the photodetector and the lock-in amplifier to obtain the photoacoustic signal V, and the photoacoustic signal and PM 2.5 There is a linear relationship between the mass concentrations, and the linear regression equation is:
[0067] V=kC+b (3)
[0068] In the formula, V is the photoacoustic signal obtained by the lock-in amplifier, and C is the PM 2.5 The mass concentration of , k is the slope, and b...
experiment example 2
[0071] Experiment 2: PM 2.5 The particle generator can produce mass concentration of 0-150μg / m 3 PM 2.5 , and the known mass concentration of PM 2.5 Pass into the photoacoustic cell, and place the photoacoustic cell at room temperature (25°C) for experiments. Thanks to PM 2.5 The particles absorb light energy to generate sound pressure signals, which makes the fluorinated graphyne diaphragm on the optical fiber F-P detector (the thickness of the fluorinated graphyne diaphragm is 180nm) vibrate, that is, the cavity length of the optical fiber F-P sensor changes, and through the photodetector and the lock-in amplifier to obtain the photoacoustic signal V, and the known PM is used in the experiment 2.5 Mass concentration C is 0, 10μg / m 3 , 20μg / m 3 , 50μg / m 3 , 80μg / m 3 , 100μg / m 3 , 150μg / m 3 , the corresponding photoacoustic signal V is 0.011mV, 0.221mV, 0.319mV, 1.118mV, 1.322mV, 1.843mV, 2.530mV respectively, and its linear regression equation is V=0.0169C+0.0606, a...
experiment example 3
[0073] Experiment 3: PM 2.5 The particle generator can produce mass concentration of 0-150μg / m 3 PM 2.5 , and the known mass concentration of PM 2.5 Pass into the photoacoustic cell, and place the photoacoustic cell at room temperature (25°C) for experiments. Thanks to PM 2.5 The particle absorbs light energy to generate a sound pressure signal, which makes the fluorinated graphyne diaphragm (the thickness of the fluorinated graphyne diaphragm is 200nm) on the optical fiber F-P detector vibrate, that is, the cavity length of the optical fiber F-P sensor changes, and through the photodetector and the lock-in amplifier to obtain the photoacoustic signal V, and the known PM is used in the experiment 2.5 Mass concentration C is 0, 10μg / m 3 , 20μg / m 3 , 50μg / m 3 , 80μg / m 3 , 100μg / m 3 , 150μg / m 3 , the corresponding photoacoustic signal V is 0.012mV, 0.224mV, 0.321mV, 1.122mV, 1.323mV, 1.845mV, 2.531mV respectively, and its linear regression equation is V=0.0169C+0.063, a...
PUM
| Property | Measurement | Unit |
|---|---|---|
| thickness | aaaaa | aaaaa |
| diameter | aaaaa | aaaaa |
| Resonant frequency | aaaaa | aaaaa |
Abstract
Description
Claims
Application Information
 - R&D Engineer
- R&D Manager
- IP Professional
- Industry Leading Data Capabilities
- Powerful AI technology
- Patent DNA Extraction
Browse by: Latest US Patents, China's latest patents, Technical Efficacy Thesaurus, Application Domain, Technology Topic, Popular Technical Reports.
© 2024 PatSnap. All rights reserved.Legal|Privacy policy|Modern Slavery Act Transparency Statement|Sitemap|About US| Contact US: help@patsnap.com


