A Method for Evaluation of Salient Datasets
An evaluation method and data set technology, applied in the field of image processing, can solve problems such as increasing the difficulty of salient object detection
- Summary
- Abstract
- Description
- Claims
- Application Information
AI Technical Summary
Problems solved by technology
Method used
Image
Examples
Embodiment 1
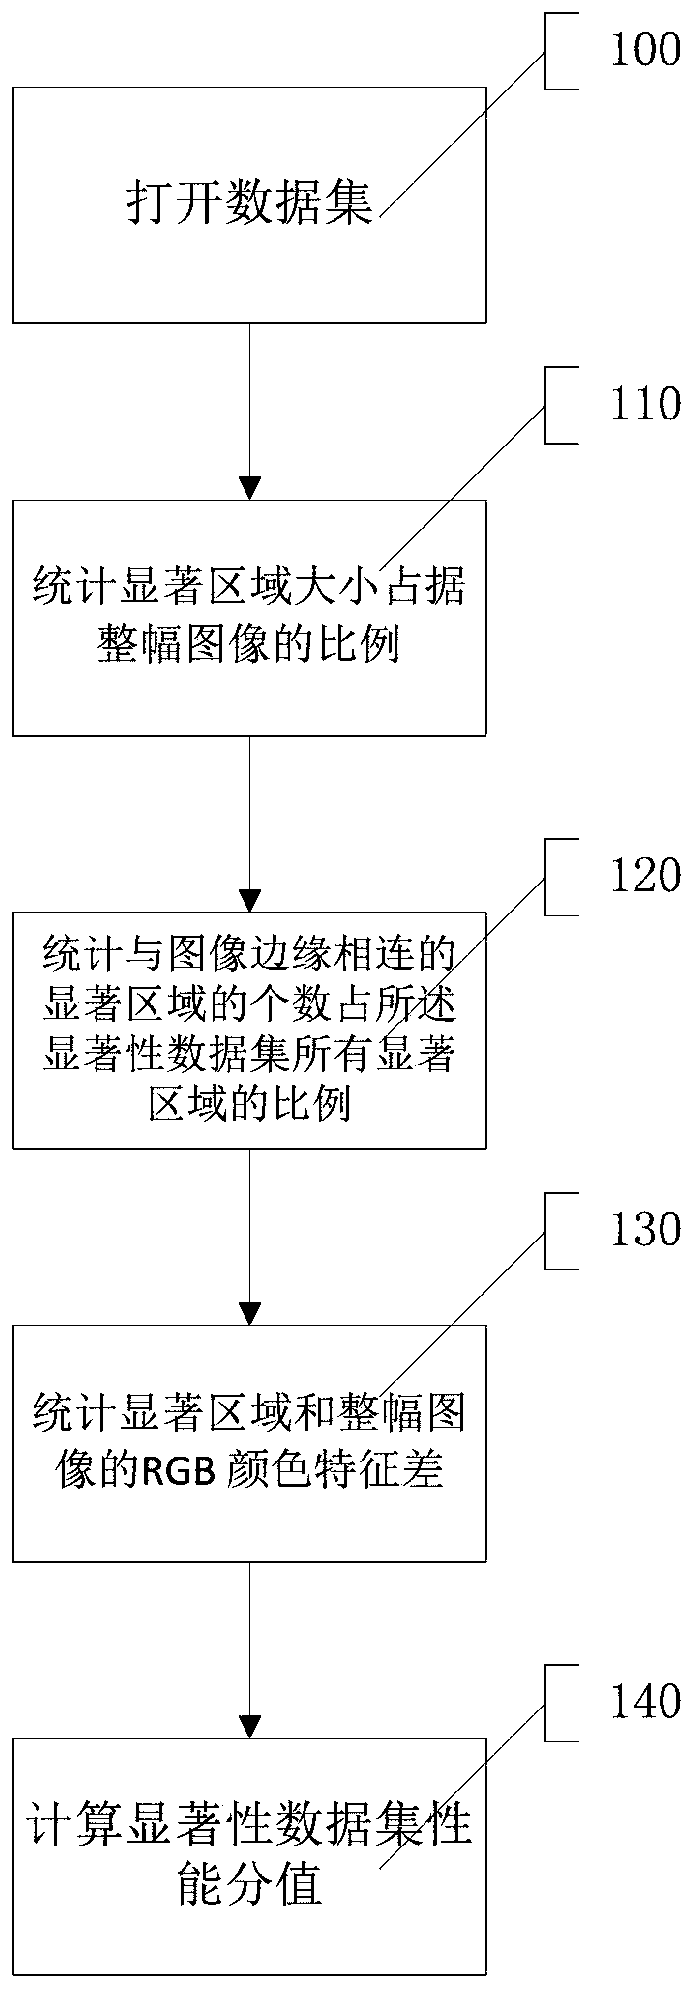
[0060] Such as figure 1 As shown, step 100 is executed to open the data set to be measured.
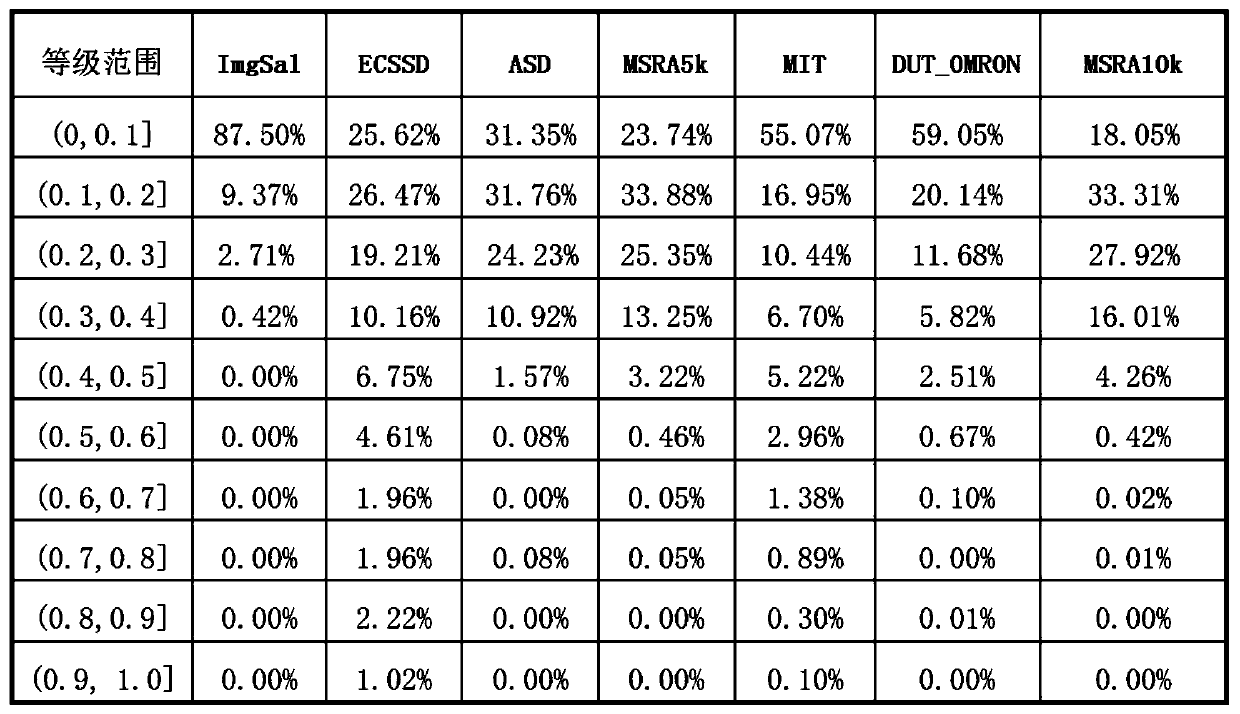
[0061] Step 110 is executed to calculate the proportion of the size of the significant region in the entire image.
[0062] An image I and the binary labeled map G corresponding to this image, assuming that the number of salient regions that are not connected to each other in the binary labeled map G is m. x i, 1≤i≤m, representing the salient area of block i in image I, calculate x i The percentage of the area of the entire image. Divide percentages into 10 scale classes, [0,0.1),[0.1,0.2),[0.2,0.3),[0.3,0.4),[0.4,0.5),[0.5,0.6),[0.6,0.7) ,[0.7,0.8]),[0.8,0.9),[0.9,1],x i In which scale level, add 1 to the number of significant regions within the scale range, num j =num j +1,1≤j≤10. Perform the above operation on each image in the data set, and finally calculate the percentage of the number of salient regions in the 10 scale levels to the number of all salient regions.
...
Embodiment 2
[0070] The calculation process of the percentage of the salient area size of the dataset to the entire image is as follows:
[0071] Input: data set D and its corresponding binary label map S;
[0072] Output: The percentage of the number of significant regions within the 10 scale levels to the number of all significant regions.
[0073] calculation process:
[0074] 1.for image i∈[1,10] do
[0075] 2.num i = 0; / / initialize the number of each level to 0
[0076] 3. end for
[0077] 4.for image I j ∈ D do
[0078] 5. Read I j and I j The corresponding binary label graph G;
[0079] 6. Extract the connected salient region set C in the binary labeled graph G, and the number of C is m;
[0080] 7. for x i ∈C, 1≤i≤m do
[0081] 8. Calculate x i image of I j percentage of area
[0082] 9. Judgment i The rank is j, num j =num j +1, 1≤j≤10;
[0083] end for
[0084] 10. end for
[0085] 11.for j∈[1,10] do / / Calculate the ratio of the number of significant region...
Embodiment 3
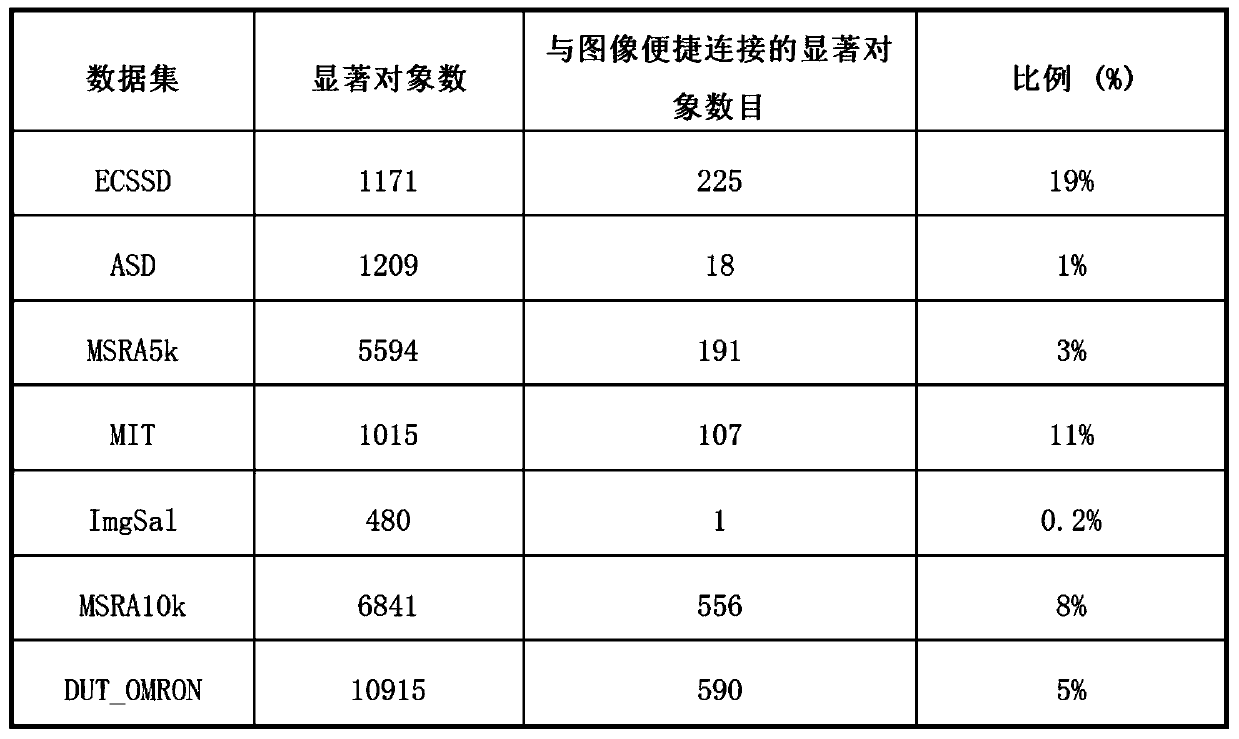
[0090] The calculation process of the number of salient regions connected to the edge of the image and the proportion of all salient regions in the dataset is as follows:
[0091] Input: data set D and its corresponding binary label map S;
[0092] Output: The number of salient regions connected to the edges of the image and the proportion of all salient regions in the dataset.
[0093] calculation process:
[0094] 1.num represents the number of salient regions connected to the edge of the image, num=0;
[0095] 2.sum represents the number of significant regions, sum=0;
[0096] 3.for image I j ∈ D do
[0097] 4. Read I j and I j The corresponding binary label graph G;
[0098] 5. Extract the connected salient region set C in the binary annotation map G, the number of C is m;
[0099] 6. sum=sum+m;
[0100] 7. for x i ∈C, 1≤i≤m do
[0101] 8. if x i connected to the edge of the image
[0102] 9. num=num+1;
[0103] 10. end if
[0104] 11. end for
[0105] 12. en...
PUM
 Abstract
Description
Claims
Application Information
 - R&D
- Intellectual Property
- Life Sciences
- Materials
- Tech Scout
- Unparalleled Data Quality
- Higher Quality Content
- 60% Fewer Hallucinations
Browse by: Latest US Patents, China's latest patents, Technical Efficacy Thesaurus, Application Domain, Technology Topic, Popular Technical Reports.
© 2025 PatSnap. All rights reserved.Legal|Privacy policy|Modern Slavery Act Transparency Statement|Sitemap|About US| Contact US: help@patsnap.com


