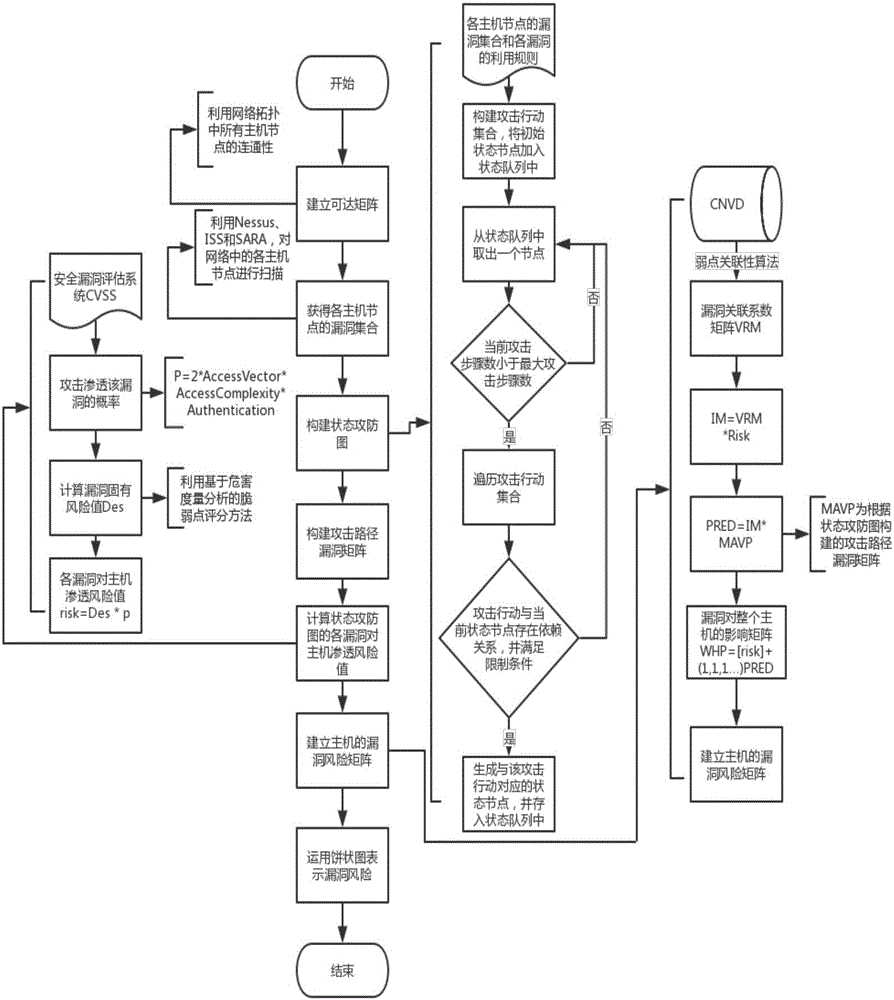
Matrix visualization method based on state transition graph
A matrix and state technology, applied in the field of matrix visualization based on state attack and defense graph, can solve the problems of low evaluation efficiency, uncertainty, and inability to adapt to a slightly larger network, and achieve the effect of accurate calculation results
- Summary
- Abstract
- Description
- Claims
- Application Information
AI Technical Summary
Problems solved by technology
Method used
Image

Examples
Embodiment 1
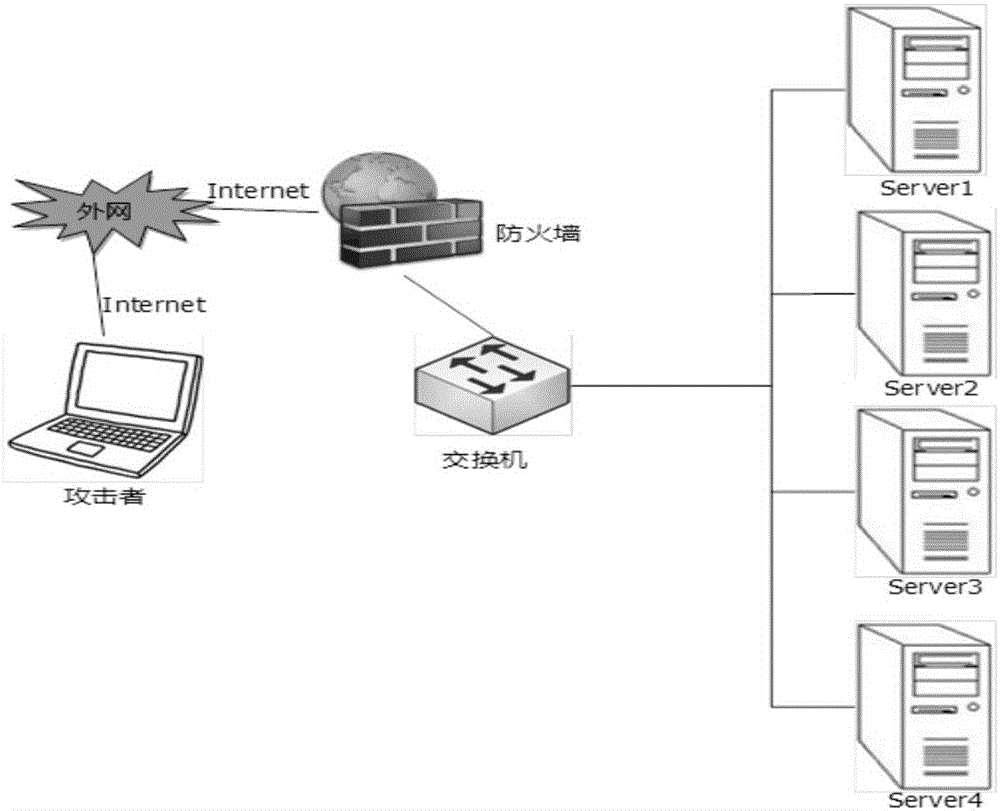
[0103] by figure 2 The network topology shown is taken as an example to illustrate the specific implementation steps. Such as figure 2 As shown, there are four servers in this network environment. server1 opens the Telnet service, server2 runs the web server, server3 is the FTP server, and server4 is the database server. The network firewall only allows external access to the Telnet server, and prohibits other access.
[0104] the first step, by figure 2 From the topology diagram shown and the access relationship between each host node, we can know that the reachability matrix is established as follows.
[0105]
[0106] Among them, 1 indicates that the access is connected, and 0 indicates that the access is not connected.
[0107] In the second step, use the vulnerability scanning tools Nessus, ISS and SARA to scan each server node in the network system, and obtain the vulnerability set of each server node as shown in Table 1 below.
[0108] Table 1
[0109] ...
PUM
 Abstract
Description
Claims
Application Information
 - R&D
- Intellectual Property
- Life Sciences
- Materials
- Tech Scout
- Unparalleled Data Quality
- Higher Quality Content
- 60% Fewer Hallucinations
Browse by: Latest US Patents, China's latest patents, Technical Efficacy Thesaurus, Application Domain, Technology Topic, Popular Technical Reports.
© 2025 PatSnap. All rights reserved.Legal|Privacy policy|Modern Slavery Act Transparency Statement|Sitemap|About US| Contact US: help@patsnap.com