
Transmission line icing type prediction method based on vertical temperature profile

A technology of transmission lines and prediction methods, which is applied in the field of power transmission and distribution, can solve the problems of inability to judge the type of icing, differences, etc., and achieve the effects of strong practicability, simple calculation operation, and high accuracy

Active Publication Date: 2016-12-07
STATE GRID HUNAN ELECTRIC POWER +2
View PDF3 Cites 1 Cited by
  • Summary
  • Abstract
  • Description
  • Claims
  • Application Information

AI Technical Summary

Problems solved by technology

However, the ice coverage prediction results can only obtain the equivalent ice coverage thickness, and the ice coverage type cannot be judged, resulting in discrepancies between the prediction results and on-site manual observations

Method used


Image

  • Transmission line icing type prediction method based on vertical temperature profile
  • Transmission line icing type prediction method based on vertical temperature profile
  • Transmission line icing type prediction method based on vertical temperature profile

Examples


example 1

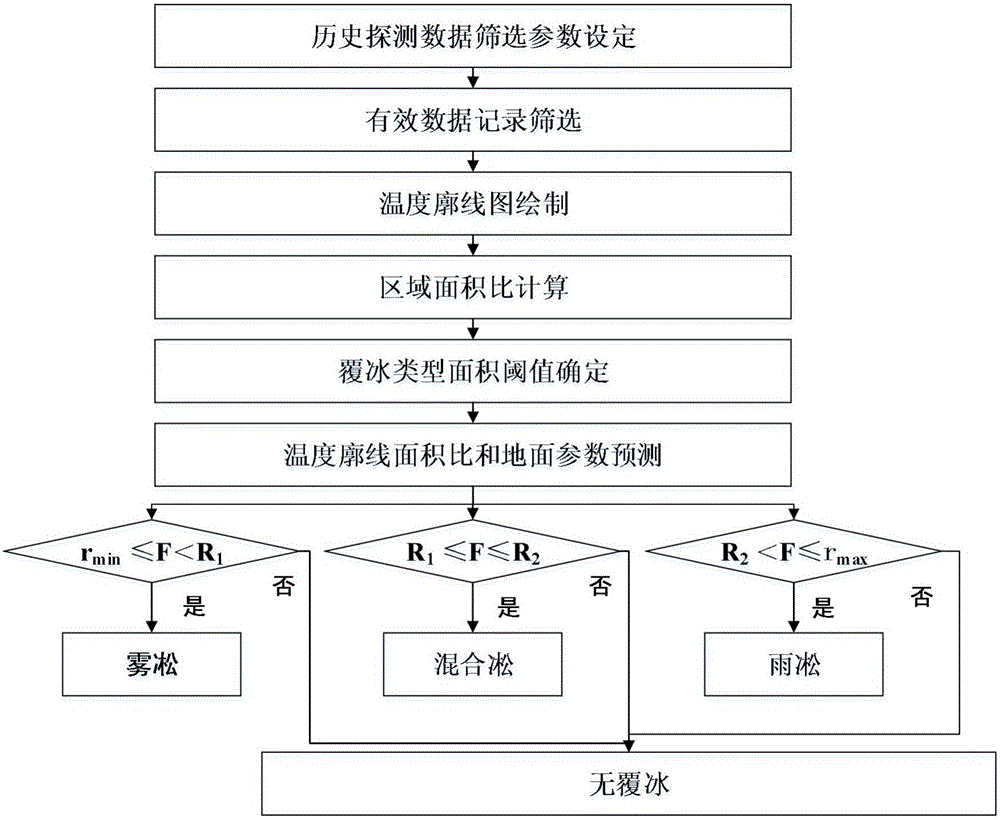
[0037] Such as figure 1 As shown, the icing type prediction in the embodiment of the present invention includes the following steps.

[0038] (1) Historical detection data screening parameter setting

[0039] Select an observation site in Shaoyang, Hunan, and set the highest and lowest heights of the observation layer relative to the ground, which are 0 and 8000m, respectively, that is, the range of high-altitude data is [0,8000]. Set the initial recording time of the historical data of the site as 2012 and the end recording time as 2015, then the observation period is [2012,2015].

[0040] (2) Effective data record screening

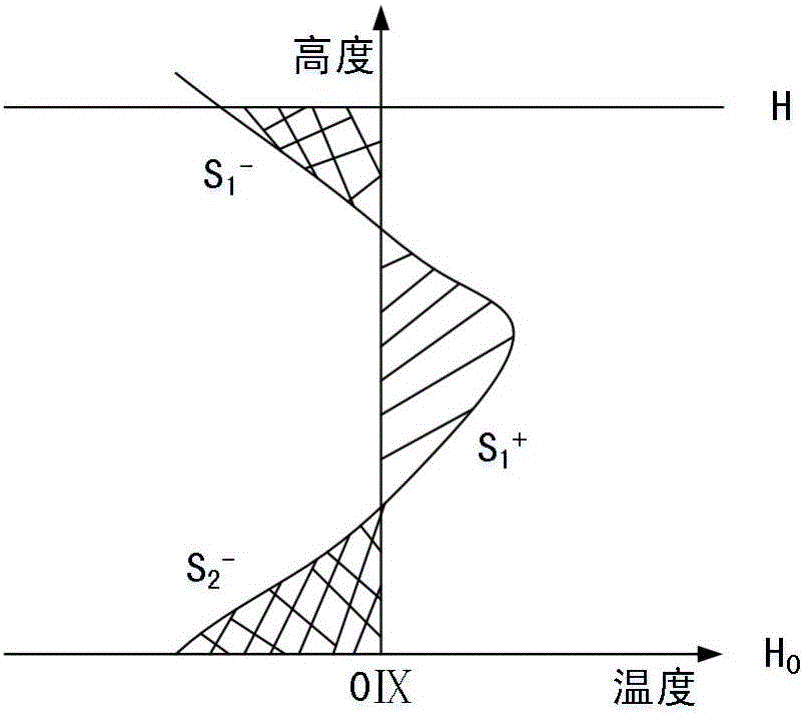
[0041] Obtain the collected temperature data and ground relative humidity data at different heights between [0,8000] when three types of icing, rime, rime and mixed rime occurred in the period of [2012,2015]. An observation record is composed of three types of elements: the type of icing observed at each time point, the temperature at different heigh...

example 2

[0057] Steps (1)~(5) are the same as Example 1.

[0058] (6) Temperature profile area ratio and surface parameter prediction

[0059] Set the initial forecast time of the WRF meteorological numerical model as January 20, 2016, and predict the temperature at different altitudes at 10:00 am on January 22, 2016, and select step (1) to determine the altitude range as [0,8000 ], draw the temperature profile according to step (3), and calculate the area ratio as 0.3 according to step (4). And predict the ground temperature -6 ℃ and relative humidity 97%.

[0060] (7) Prediction of icing type

[0061] Step (6) predicts that T≤0℃, Rh≥90%, 0.1≤r≤0.8, the predicted ice type is mixed rime, and the actual verification is mixed rime.

example 3

[0063] Steps (1)~(5) are the same as Example 1.

[0064] (6) Temperature profile area ratio and surface parameter prediction

[0065] Set the initial forecast time of the WRF meteorological numerical model as January 20, 2016, and predict the air temperature at different altitudes at 18:00 on January 22, 2016, and select step (1) to determine the altitude range as [0,8000] According to step (3), the temperature profile is drawn, and the area ratio is calculated as 0.05 according to step (4). And predict the ground temperature -9 ℃ and relative humidity 96%.

[0066] (7) Prediction of icing type

[0067] Step (6) predicts that T≤0°C, Rh≥90%, 0.01≤r<0.1, the predicted ice type is rime, and the actual verification is rime.


PUM


Abstract

The invention discloses a transmission line icing type prediction method based on a vertical temperature profile. The method comprises the following steps of 1, historical detection data screening and parameter setting; 2, effective data record screening; 3, temperature profile image drawing; 4, region area ratio calculation; 5, icing type area threshold determination; 6, temperature profile area ratio and ground parameter prediction; and 7, icing type prediction. The beneficial effects are that the invention fills the gap that no transmission line icing type prediction technology based on vertical atmospheric temperature profile analysis is available, is suitable for predicting all icing types of a power grid, and is strong in practicality; the invention establishes a threshold of an area by using historical icing data of the prediction area, so as to predict the power grid icing type of the area, and the accuracy is high; and the invention obtains a transmission line icing type by prediction and provides an important reference base for ice melting and ice eliminating of a power grid in the winter power grid icing period.

Description

technical field [0001] The invention belongs to the technical field of power transmission and distribution, and in particular relates to a method for predicting the icing type of a power transmission line based on a temperature vertical profile. Background technique [0002] Power grid freezing disasters have spread to more than 100 countries and regions around the world. With the rapid development of UHV and other AC and DC lines, power grid freezing disasters have occurred frequently. The direct economic loss is tens of billions of dollars. In order to prevent and control ice disasters in power grids, it is urgent to carry out power grid icing prediction. [0003] Among the existing technologies, the ice coverage prediction mainly uses the numerical model to predict the meteorological elements in the next 3-7 days, and combines the ice thickness growth model to calculate the equivalent ice thickness of the conductor. However, the ice coverage prediction results can only ...

Claims


Application Information

Patent Timeline
IPC IPC(8): G06Q10/04G06Q50/06
CPCG06Q10/04G06Q50/06
Inventor 陆佳政冯涛徐勋建张杰李丽杨莉
Owner STATE GRID HUNAN ELECTRIC POWER
Learn More