Visualization method of radio signal data

A radio signal and data technology, applied in the field of information visualization, can solve the problems of lack of radio signal data visualization methods, difficult to show radio signal time-varying patterns, difficult to record, etc.

Active Publication Date: 2016-08-24
CENT SOUTH UNIV
View PDF2 Cites 10 Cited by
  • Summary
  • Abstract
  • Description
  • Claims
  • Application Information

AI Technical Summary

Problems solved by technology

However, there are still some problems that need to be solved urgently in the practical application of radio signal data. First, radio signal data is extracted over time, and a large number of signal feature records may correspond to the same actual non-instantaneous radio signal. Due to the instability of the monitoring environment and the possible presence of Interference signals and multi-user time-division multiplex the same frequency, it is difficult to correctly record the signal characteristics according to the actual radio signal clustering by automatic methods; then, traditional scatter diagrams, line diagrams and parallel coordinates and other visualization methods are difficult to show radio Due to the time-varying patterns of multi-featured signals, experts lack effective radio signal data visualization methods to observe, compare and analyze radio signals

Method used


Image

  • Visualization method of radio signal data
  • Visualization method of radio signal data
  • Visualization method of radio signal data

Examples


Embodiment Construction

[0072] The present invention will be further described in detail below in conjunction with the accompanying drawings and specific embodiments.

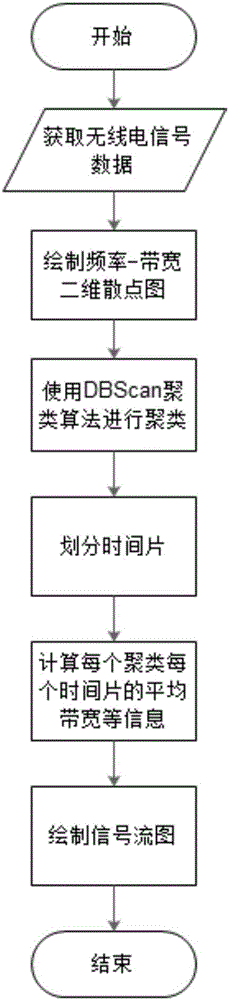
[0073] A visualization method for radio signal data, comprising the following steps:

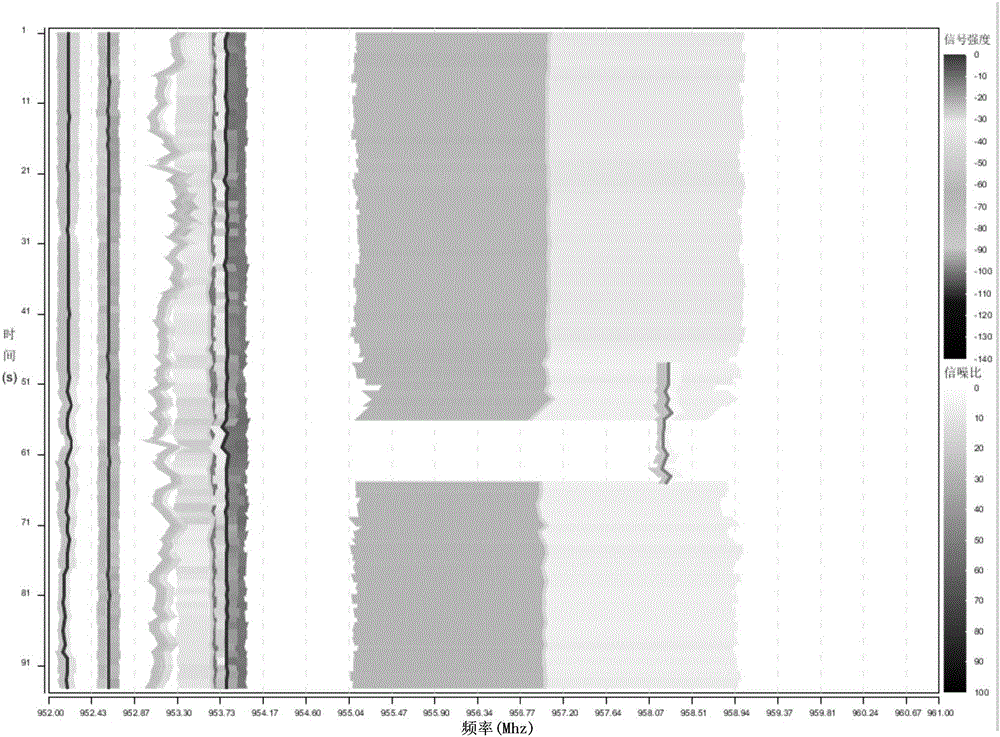
[0074] Step 1: Get the radio signal data, the radio signal data is from 2016 / 4 / 715:16:08 to 2016 / 4 / 715:17:42, a total of 94 seconds for all signal points with a frequency range of 952‐961Mhz, Each data record of the radio signal data corresponds to a radio signal, and each radio signal contains features such as center frequency (freq), bandwidth (baud), signal-to-noise ratio (snr), signal strength (dbm) and time stamp, indicating The signal is detected at the time point indicated by the timestamp, and contains a total of 6437 radio signals, labeled signal S i (1≤i≤6437) center frequency, bandwidth, signal-to-noise ratio, signal strength and time stamp are respectively

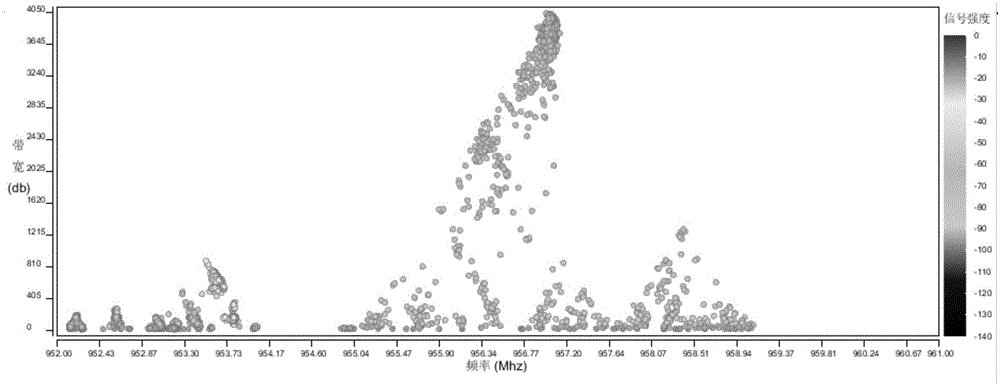
[0075] Step 2: Draw a frequency-bandwidth scatter diagram based on the radio...


PUM


Abstract

The invention provides a visualization method of radio signal data. The visualization method of the radio signal data comprises a first step of obtaining the radio signal data extracted from frequency spectrum data and original electric level sampling data; a second step of drawing a frequency-bandwidth scatter diagram; a third step of clustering the radio signal data by using a clustering algorithm; a fourth step of dividing time slices; a fifth step of calculating an average center frequency, an average bandwidth, an average signal-to-noise ratio and an average signal intensity of each time slice for each cluster; and a sixth step of drawing a signal flow diagram. Multiple characteristics of radio signals are coded efficiently by utilizing the signal flow diagram, multiple types of important characteristics of relatively scattered signal data at a time frequency are shown smoothly, a multi-characteristic time-varying mode of the radio signal is shown in a better manner, and a macroscopic perceiving efficiency of an analyzer for the radio signal time-varying mode is speeded up.

Description

technical field [0001] The invention relates to the field of information visualization, in particular to a visualization method for radio signal data. Background technique [0002] Radio spectrum is a limited natural resource and is the basic carrier of modern wireless information transmission. In order to reduce mutual interference between radio signals, to ensure the smooth flow of important communication links, and to make better use of limited spectrum resources, especially in key areas such as airports and borders and in major event support tasks, strengthen radio spectrum monitoring and Radio signal management is of great strategic significance to safeguarding national security and promoting the steady development of the national economy. [0003] Monitoring the radio spectrum in a certain frequency band is the cornerstone of radio management activities. The spectrum monitoring data collected by various monitoring equipment provides information sources for spectrum oc...

Claims


Application Information

Patent Timeline
Patent Type & Authority Applications(China)
IPC IPC(8): H04L12/24H04B17/309H04B17/318
CPCH04B17/309H04B17/318H04L41/22
Inventor 周芳芳曾媛赵颖张蓉李俊材佘燕敏
Owner CENT SOUTH UNIV
Why Eureka
Try Eureka