
Regional power grid source-side pollutant and carbon discharge level evaluation method

A technology of regional power grid and evaluation method, applied in the field of electrical engineering, can solve the problems such as the inability to reflect the overall pollutant emission level of the power supply side, the green level per unit of electricity, and the inability to quantify the improvement of the renewable energy structure of the regional power grid.

Inactive Publication Date: 2016-07-20
海南电网有限责任公司 +1
View PDF0 Cites 3 Cited by
  • Summary
  • Abstract
  • Description
  • Claims
  • Application Information

AI Technical Summary

Problems solved by technology

The existing assessment system on the power supply side mainly evaluates the energy consumption and pollutant emission levels of coal-fired power plants, and cannot quantify the improvement of the energy structure brought about by the development of renewable energy in regional power grids, nor can it reflect the overall pollution on the power supply side. emissions and green levels per unit of electricity

Method used


Image

  • Regional power grid source-side pollutant and carbon discharge level evaluation method
  • Regional power grid source-side pollutant and carbon discharge level evaluation method
  • Regional power grid source-side pollutant and carbon discharge level evaluation method

Examples


Embodiment 1

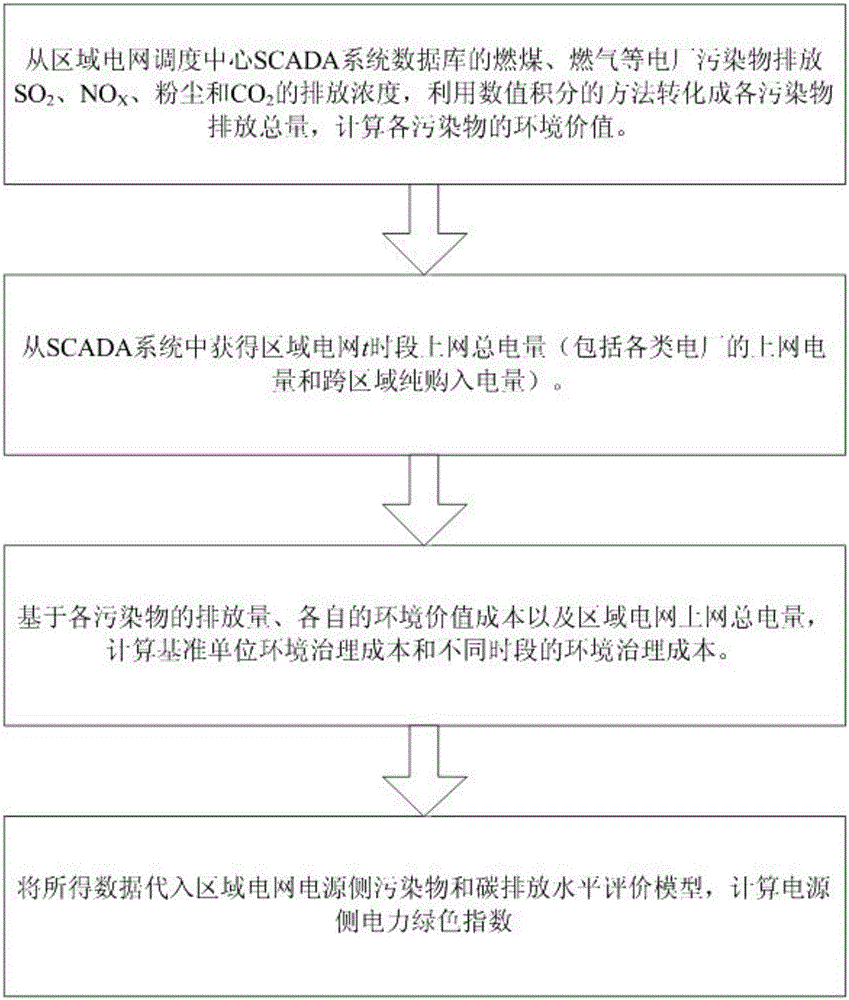
[0052] The present invention will be described in detail below by taking the calculation of the power green index at the power supply side of the regional grid as an example. The present invention uses the SCADA module of the power grid dispatching control center to obtain the data required for the calculation of the power green index, and needs to be processed according to the following steps, as figure 1 shown.

[0053] Step 1. Use the relevant data interface of the SCADA system database to obtain the required system-related operating data, perform corresponding preprocessing and calculation on the relevant data, and obtain various parameters required for the unit electricity environmental governance cost and the green index. Pollutants include SO 2 , NO x , CO 2 ,dust.

[0054] Coal-fired and gas-fired power plants in the regional power grid report the concentration of pollutants emitted by power generation, the time interval is Δt, and the unit is mg / m 3 , through the...

Embodiment 2

[0093] A method for evaluating the level of pollutants and carbon emissions on the power supply side of a regional power grid, the steps are as follows:

[0094] SCADA system database of regional power grid dispatching center SO 2 , NO X , dust and CO 2 The online monitoring data of each power source in the regional power grid and the cross-regional pure purchased electricity, expressed in SO 2 , NOX, CO 2 , The environmental value of dust pollutants is used as the weight to obtain the environmental governance cost of pollutants and carbon emissions per unit of electricity on the power supply side of the regional power grid, and use the results to calculate the power green index on the power supply side of the regional power grid.

[0095] Preferably, the specific steps are as follows:

[0096] (1) Using the SCADA system database of the regional power grid dispatching center to discharge SO pollutants from thermal power plants 2 , NOX, dust and CO 2 online monitoring dat...


PUM


Abstract

The invention relates to a regional power grid source-side pollutant and carbon discharge level evaluation method. An environment treatment cost of pollutants and carbon discharge of an electric quantity per unit at the power source side of a regional power grid is obtained by use of online monitoring data of such power plant pollutants as SO2, NOX, dust and CO2 which are discharged by fire coal, combustion gas and the like of a regional power grid scheduling center SCADA system database, an online electric quantity of each power source in the regional power grid and a cross-regional pure purchased electric quantity by taking environment values of such pollutants as the SO2, the NOX, the CO2, the dust and the like as weights, and a regional power grid source-side power green index is calculated by use of such a result. According to the invention, the pollutant treatment cost of the electric quantity per unit of the regional power grid, with economic significance, and the source-side power green index measuring source-side pollutant and carbon discharge level of the regional power grid are obtained, and evaluation of the source-side pollutant and carbon discharge level of the regional power grid at different space time is realized.

Description

technical field [0001] The invention belongs to the technical field of electrical engineering, and relates to a method capable of quantifying the power cleanliness degree of a power supply side of a regional power grid, in particular to a method for evaluating the level of pollutants and carbon emissions on the power supply side of a regional power grid. Background technique [0002] The power industry is currently the largest concentrated emission "carbon source" in China, and it is also the largest source of pollutant emissions. The means to reduce pollutants and carbon emissions on the power supply side of the regional power grid mainly include two aspects: one is to use advanced technology for terminal treatment of pollutant emissions; Adjustment. The existing assessment system on the power supply side mainly evaluates the energy consumption and pollutant emission levels of coal-fired power plants, and cannot quantify the improvement of the energy structure brought abou...

Claims


Application Information

Patent Timeline
IPC IPC(8): G06Q10/06G06Q50/06
CPCY02P90/84G06Q10/06393G06Q50/06
Inventor 吴清庞松岭兰穗梅杨超米增强石金玮
Owner 海南电网有限责任公司
Learn More