
A Visualization Method of Graph and Text Collection

A collection, graphic and text technology, applied in special data processing applications, instruments, electrical and digital data processing, etc., can solve the problems of visual layout without considering the extraction of feature pictures, lack of visual aesthetics, etc.

Active Publication Date: 2016-08-17
TSINGHUA UNIV
View PDF5 Cites 0 Cited by
  • Summary
  • Abstract
  • Description
  • Claims
  • Application Information

AI Technical Summary

Problems solved by technology

Among them, Document Cards by Hendrik Strobelt simply lists the text and pictures, lacking in visual aesthetics, while the tag cloud only considers the use of words to visualize the text collection, and does not consider how to extract feature pictures and make a reasonable visual layout with the text Information presented together

Method used


Image

  • A Visualization Method of Graph and Text Collection
  • A Visualization Method of Graph and Text Collection
  • A Visualization Method of Graph and Text Collection

Examples


Embodiment 1

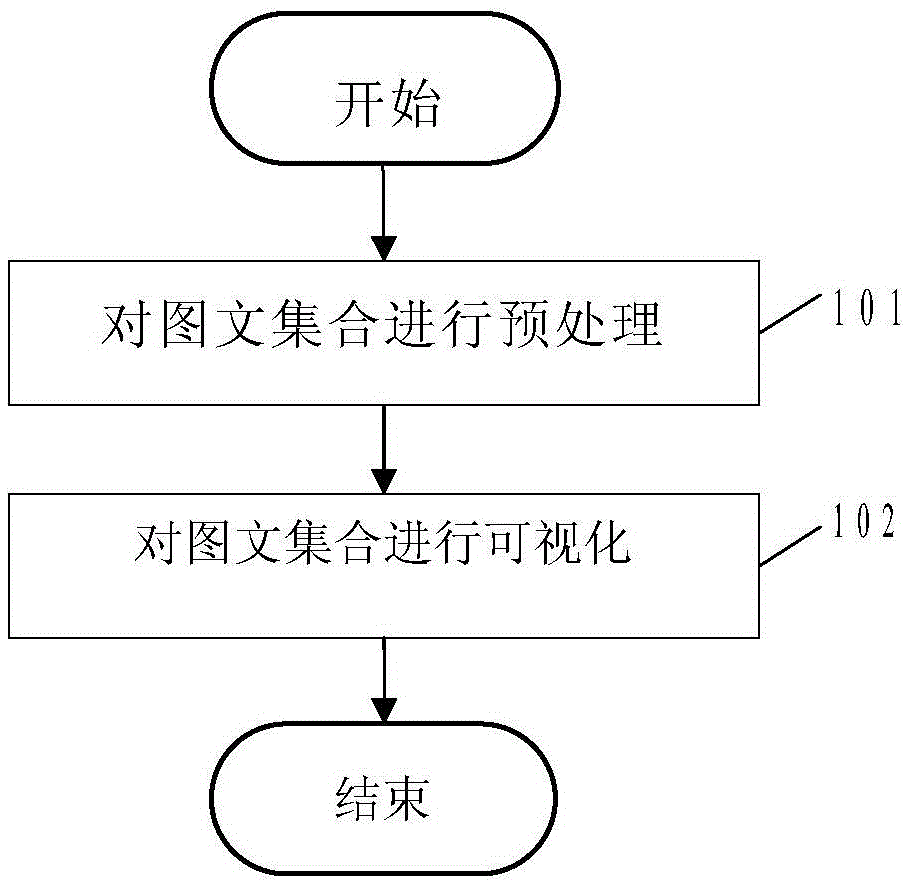
[0021] see figure 1 , this embodiment provides a visualization method for a graph-text collection, and the process is as follows:

[0022] 101: Preprocessing the image-text collection;

[0023] 102: Visualize a collection of images and texts.

[0024] The method provided in this embodiment achieves the beneficial effect of enabling users to intuitively and quickly understand the content of the graphic collection by extracting the characteristic words and characteristic pictures of the graphic collection and displaying the result in a graphical manner.

Embodiment 2

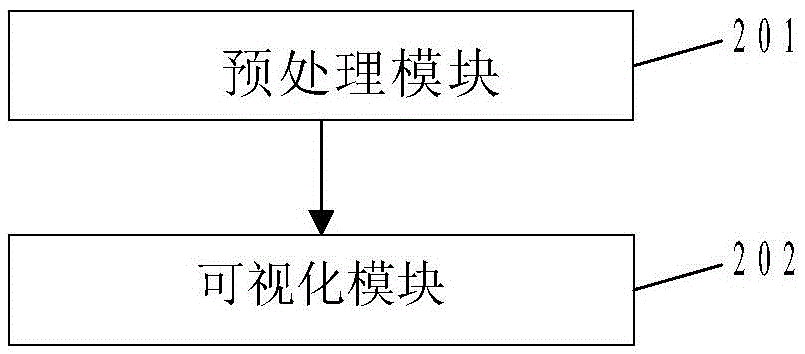
[0026] see figure 2 , this implementation provides a visualization device for a collection of pictures and texts, the device includes:

[0027] A preprocessing module 201, configured to preprocess the graphic and text collection to be visualized;

[0028] The visualization module 202 is used to visualize the collection of pictures and texts.

[0029] Specifically, in the above-mentioned preprocessing module 201, the text collection is divided into words, and the text feature words are obtained after removing the stop words, and the weight of the words is calculated; wherein, the stop words refer to such as "of", "and" and "in " and other prepositions, modal particles and very commonly used words. The repeated pictures in the picture collection are discarded, and the weights of the remaining pictures are calculated.

[0030] In the visualization module 202, the visual characteristics of graphical display are described as follows:

[0031] 1. The overall distribution is ell...

Embodiment 3

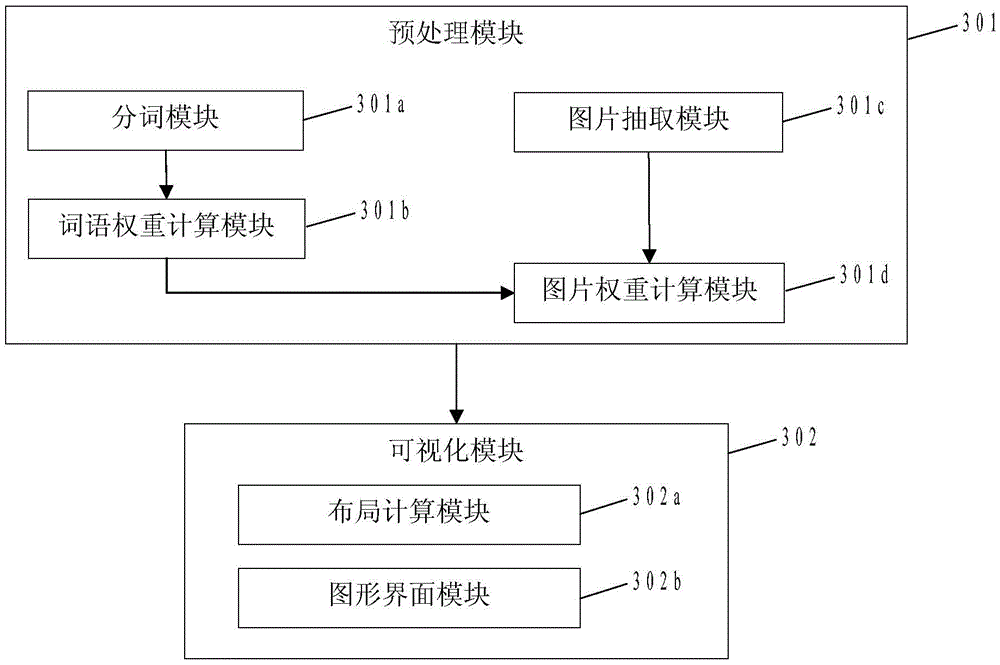
[0036] see image 3 , this implementation provides a visualization device for a collection of pictures and texts, the device includes:

[0037] The preprocessing module 301 is used to preprocess the raw data to be visualized, and obtain the characteristic words and the weights of the characteristic words, the characteristic pictures and the weights of the characteristic pictures of the graph-text set;

[0038] The visualization module 302 is configured to use the result of the preprocessing module 301 to visualize the image-text collection.

[0039] Further, the preprocessing module 301 includes:

[0040] The word segmentation unit 301a is used to segment the text collection and remove stop words to obtain independent feature phrases;

[0041] The term weight calculation unit 301b is used to calculate the weight of the feature words of the text set;

[0042] The picture extraction unit 301c is used to extract different pictures in the picture collection;

[0043] The pictu...


PUM


Abstract

A visualization method for a collection of pictures and texts, which processes text collections containing pictures to obtain feature words and weights of feature words, feature pictures, and weights of feature pictures in the picture-text collection, and then uses feature words and feature pictures to compare text and text The collection is visualized; the present invention also provides a visualization device for a collection of pictures and texts, including: a preprocessing module, which is used to preprocess the raw data to be visualized, and obtain the feature words of the collection of pictures and texts and the weights and features of the feature words. The weight of pictures and feature pictures; the visualization module is used to use the above result data to visualize information and present the characteristics of graphic and text collections; the present invention displays the feature words and feature pictures of graphic and text collections through a graphical interface, so as to enable users Intuitively and quickly understand the purpose of the content of the graphic collection.

Description

technical field [0001] The invention relates to the technical field of text information processing and information visualization, and in particular to a method and device for visualizing a collection of pictures and texts. Background technique [0002] With the rapid development of information technology, massive amounts of information are constantly emerging, making it increasingly difficult for people to process and understand them. Information visualization provides an effective means to help people understand information and acquire knowledge: it maps data into visual symbols, and at the same time provides people with the ability to quickly interact with visual information, enabling people to take advantage of the inherent parallelism of visual perception. The key information contained in the big data can be quickly obtained through the advanced processing capability. As an interdisciplinary research field, information visualization comprehensively uses technologies and...

Claims


Application Information

Patent Timeline
IPC IPC(8): G06F17/27G06K9/46
Inventor 唐家渝刘知远孙茂松
Owner TSINGHUA UNIV
Learn More