
Method and device for obtaining frequency attenuation gradient of seismic data

A technology of frequency attenuation and seismic data, applied in the field of exploration geophysics, can solve problems such as energy overlap, calculation accuracy to be improved, serious problems, etc.

Inactive Publication Date: 2014-02-05
GEOPHYSICAL EXPLORATION CO OF CNPC CHUANQING DRILLING ENG CO LTD
View PDF1 Cites 10 Cited by
  • Summary
  • Abstract
  • Description
  • Claims
  • Application Information

AI Technical Summary

Problems solved by technology

However, the Image module of EP-Tech software has certain defects because it uses the three-parameter wavelet transform method to calculate the amplitude spectrum in the time-frequency domain: the amplitude spectrum in the time-frequency domain based on the conventional continuous wavelet transform uses the Time-scale information conversion, and in this conversion process, each scale corresponds not to a frequency, but to a frequency band, resulting in energy overlap, which is more serious at high frequencies, resulting in Attenuation of high-frequency amplitude spectrum energy
Although the Image module of EP-Tech software uses three-parameter wavelet, compared with the conventional continuous wavelet transform, it only improves the wavelet function, while the core algorithm - continuous wavelet transform remains unchanged, that is, there are still high The energy attenuation phenomenon of the frequency band amplitude spectrum, the attenuation is not caused by oil and gas reservoirs, but the attenuation caused by continuous wavelet transform, which will affect the reliability of oil and gas reservoir prediction
In addition, the Image module of EP-Tech software uses a two-point linear fitting method to calculate the attenuation coefficient of the high-frequency amplitude spectrum, and its calculation accuracy needs to be improved

Method used


Image

  • Method and device for obtaining frequency attenuation gradient of seismic data
  • Method and device for obtaining frequency attenuation gradient of seismic data
  • Method and device for obtaining frequency attenuation gradient of seismic data

Examples


Embodiment Construction

[0017] Exemplary embodiments of the present invention will now be described in detail, examples of which are illustrated in the accompanying drawings, wherein like reference numerals refer to like parts throughout.

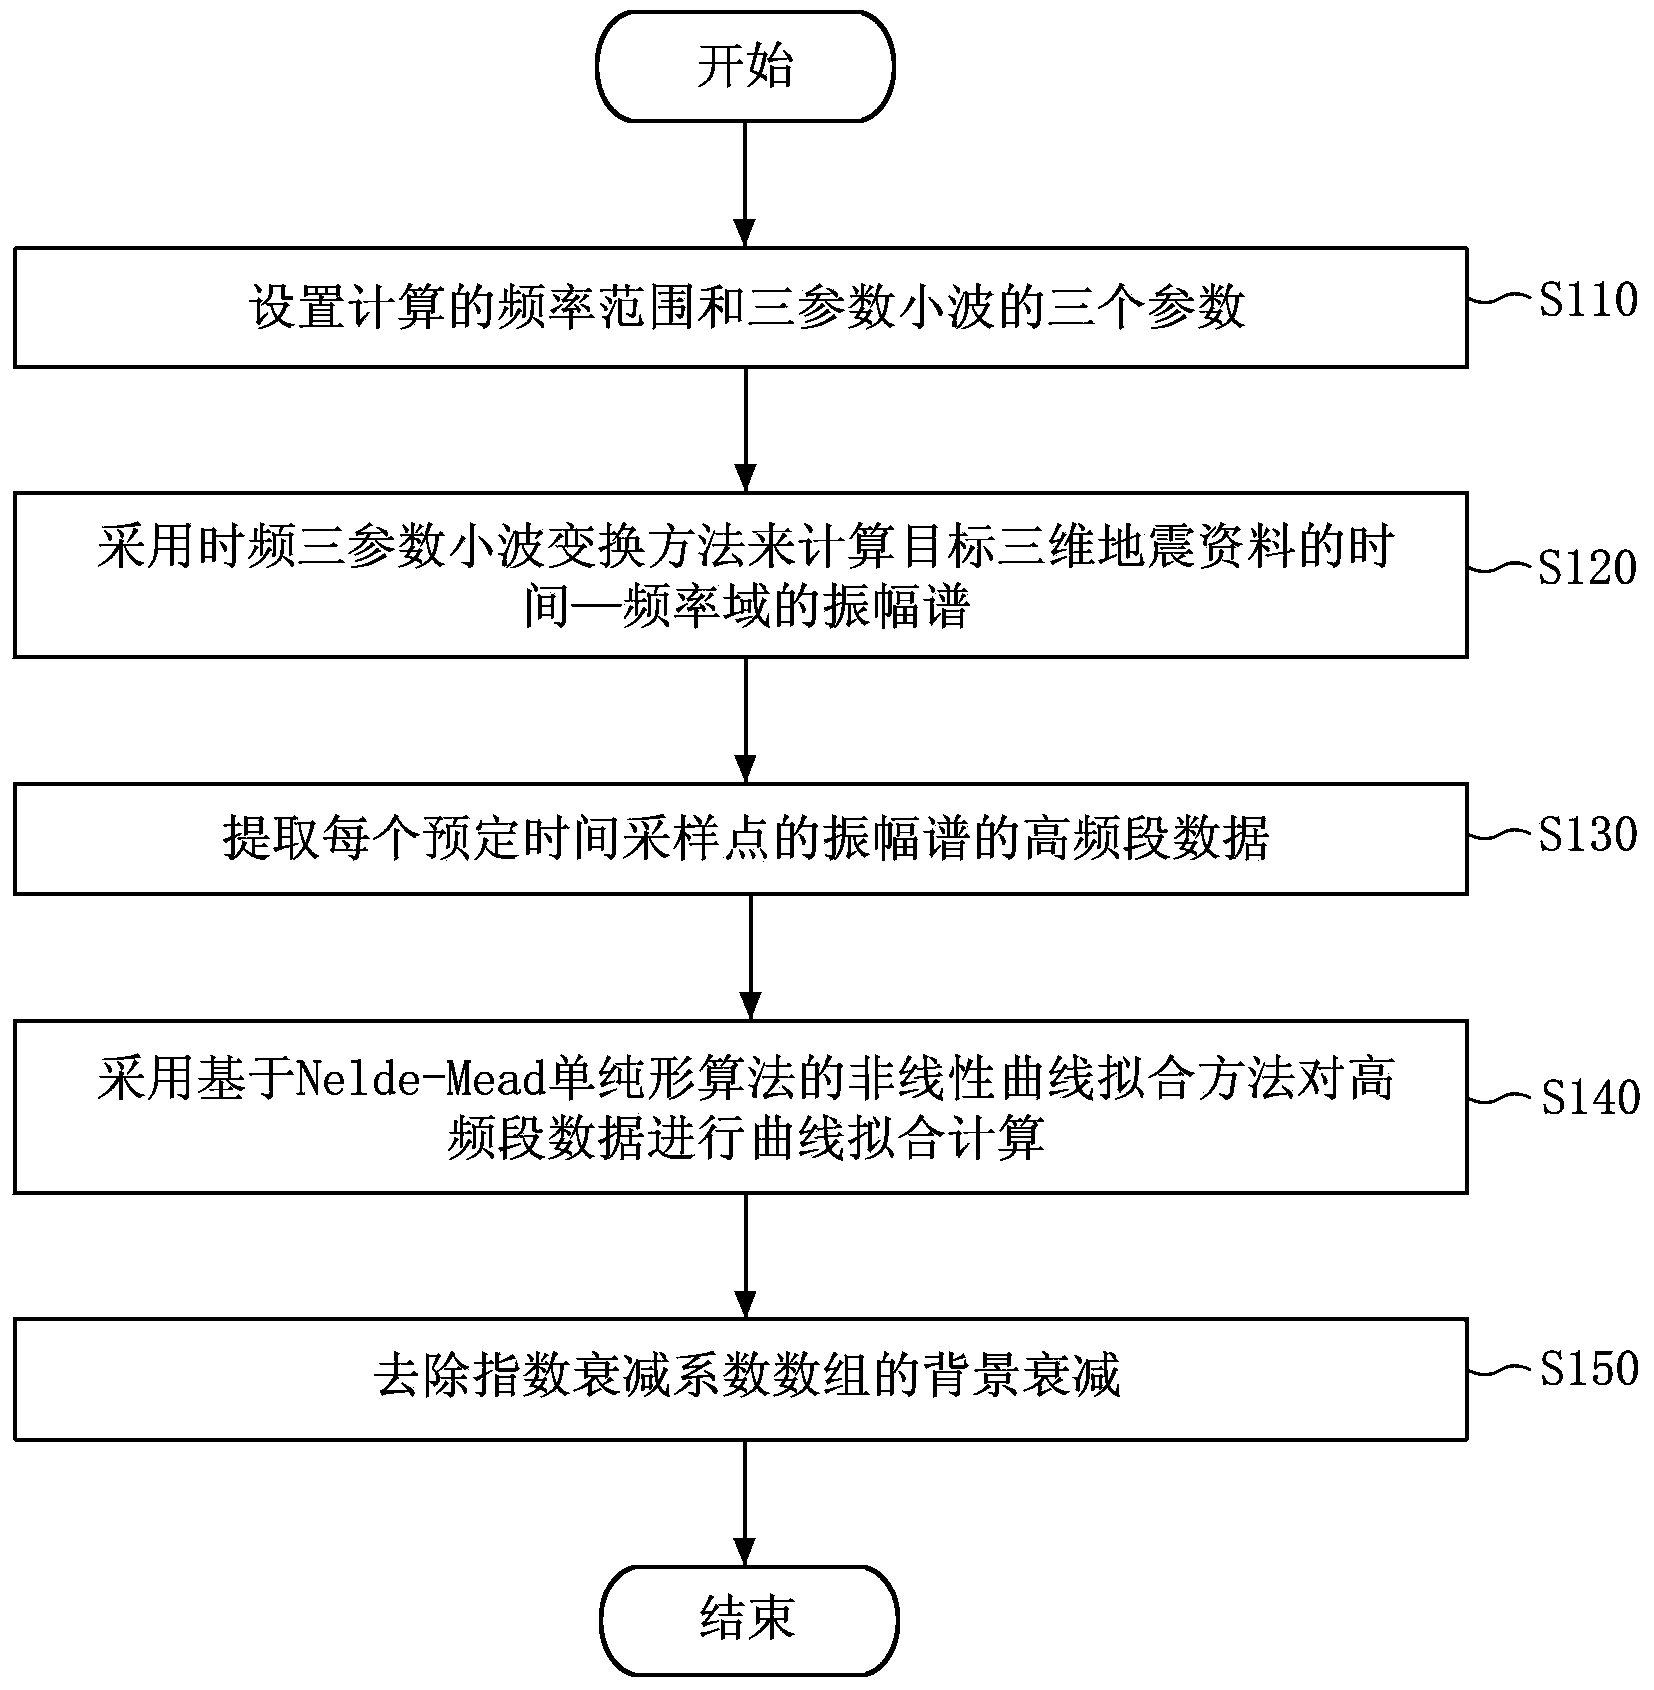
[0018] figure 1 is a flowchart illustrating a method of obtaining a frequency attenuation gradient of seismic data according to an exemplary embodiment of the present invention.

[0019] refer to figure 1 , in step S110, set the calculated frequency range and three parameters of the three-parameter wavelet. Here, more specifically, the calculated frequency range can be set to the frequency value f at the beginning of the calculation 1 to the frequency value f at the end of the calculation 2 , the three parameters of the three-parameter wavelet may include wavelet modulation frequency ε, energy delay factor β and energy decay factor τ.

[0020] In step S120, the time-frequency three-parameter wavelet transform method is used to calculate the amplitude spectrum ...


PUM


Abstract

The invention provides a method and device for obtaining the frequency attenuation gradient of seismic data. The method for obtaining the frequency attenuation gradient of the seismic data comprises the steps that an amplitude spectrum of a time-frequency domain of the target three-dimensional seismic data is calculated through a time-frequency three-parameter wavelet transform method; high-frequency-band data of the amplitude spectrum of each preset time sampling point are extracted; curve fitting calculation is conducted on the high-frequency-band data through a nonlinear curve fitting method based on the Nelde-Mead simplex algorithm, so that an exponential attenuation coefficient array formed by exponential attenuation coefficients corresponding to the preset time sampling points is obtained; background attenuation of the exponential attenuation coefficient array is removed, so that a frequency attenuation gradient array is obtained.

Description

technical field [0001] The invention relates to the field of exploration geophysics, more specifically, to a method and device for obtaining the frequency attenuation gradient of seismic data. Background technique [0002] The attenuation of seismic waves has a certain relationship with the oil-gas content of sandstones. When seismic waves pass through oil-gas-bearing sandstones, the energy will undergo obvious high-frequency attenuation, that is, the energy in the high-frequency band of the amplitude spectrum will obviously attenuate. In order to effectively utilize high-frequency attenuation information, in the prior art, the degree of frequency attenuation is characterized by calculating the exponential attenuation coefficient of the high-frequency amplitude spectrum of the signal, that is, the frequency attenuation gradient analysis technique, wherein the frequency range of the high-frequency amplitude spectrum Refers to the frequency corresponding to the maximum amplitu...

Claims


Application Information

Patent Timeline
Patent Type & Authority Applications(China)
IPC IPC(8): G01V1/28G01V1/36
Inventor 邹文张洞君陶正喜何光明
Owner GEOPHYSICAL EXPLORATION CO OF CNPC CHUANQING DRILLING ENG CO LTD
Learn More