Water environment monitoring and quality-control data analysis method
A data analysis and environmental monitoring technology, applied in the field of data analysis, can solve the problem that monitoring quality control data is difficult to meet the requirements of scientific management
- Summary
- Abstract
- Description
- Claims
- Application Information
AI Technical Summary
Problems solved by technology
Method used
Image
Examples
Embodiment 1
[0109] a. Obtain the water environment quality control data to be audited, and use conventional and traditional methods to process the data. Conventional methods refer to the data logic judgment method and Dixon test method, remove obviously unreasonable abnormal data, and use unsupervised learning algorithms to identify hidden contains outlier data;
[0110] b. Establish a water environment quality control data analysis model using supervised learning algorithms, and identify the reliability of monitoring data;
[0111] c. Compare the output of quality control data with the quality control data in the historical data of the same analytical method and instrument type to obtain the deviation;
[0112] d. To determine whether the data is approved or not, the specific determination steps are: if the deviation is not large, the data is reasonable, pass the review, and add it to the historical data set; otherwise, the deviation is too large, the data will be listed as suspicious da...
Embodiment 2
[0114] k-means clustering
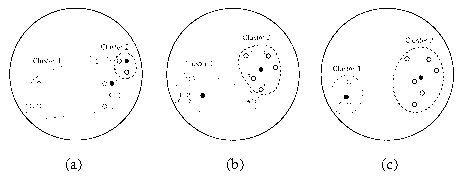
[0115] K-means clustering (k-means) algorithm takes k as a parameter and divides n objects into k classes, so that the elements within a class have a high similarity, while the similarity between classes is low. The calculation of similarity is based on the average value of objects in a class (which is regarded as the center of gravity of the class).
[0116] The k-means clustering algorithm iterates as follows:
[0117] (a) Randomly select k objects, each initially representing the mean or center of a class:
[0118] (b) For each remaining object, assign it to the nearest class according to its distance from the center of each class.
[0119] For the regrouped k class, judge whether the criterion function converges: if it converges, the algorithm terminates;
[0120] Otherwise, go to (c);
[0121] (c) Recalculate the center of each class, go to (b).
[0122] Usually, we adopt the squared error criterion, which is defined as follows:
[0123] ...
Embodiment 3
[0127] particle swarm optimization
[0128] Particle Swarm Optimization (PSO) simulates the group behavior of birds in nature, applies the idea of information sharing in biological populations to the algorithm process, and guides population evolution with individual cognition and social experience. As a new intelligent optimization algorithm, particle swarm optimization has the characteristics of both evolutionary algorithm and swarm intelligence algorithm, and has been widely used to solve various nonlinear, non-differentiable and multi-peak complex optimization problems. Compared with genetic algorithm, particle swarm optimization is not easy to produce premature convergence, and has the advantages of simple structure, less control parameters, and faster operation speed.
[0129] The particle swarm optimization algorithm is initialized as a group of random particles (random solutions), each particle represents a candidate solution in the solution space (d dimension), and t...
PUM
 Abstract
Description
Claims
Application Information
 - R&D
- Intellectual Property
- Life Sciences
- Materials
- Tech Scout
- Unparalleled Data Quality
- Higher Quality Content
- 60% Fewer Hallucinations
Browse by: Latest US Patents, China's latest patents, Technical Efficacy Thesaurus, Application Domain, Technology Topic, Popular Technical Reports.
© 2025 PatSnap. All rights reserved.Legal|Privacy policy|Modern Slavery Act Transparency Statement|Sitemap|About US| Contact US: help@patsnap.com


