Three-dimensional butterfly line technical model and application thereof in technical analysis of financial market

A technical analysis and financial market technology, applied in the three-dimensional butterfly line technical model and its application in financial market technical analysis, can solve problems such as misleading, unclear, lagging technical graphics, etc., to increase reliability and timeliness characteristics, easy to analyze and judge, and conducive to rapid decision-making

Inactive Publication Date: 2013-02-27
高进
View PDF1 Cites 1 Cited by
  • Summary
  • Abstract
  • Description
  • Claims
  • Application Information

AI Technical Summary

Problems solved by technology

[0007] 2. Traditional anti-trend technical indicators fluctuate frequently with price fluctuations during the operation process. When expressing the wave rules of price operation, when will encounter support and when will encounter resistance? ambiguity
[0008] 3. The traditional anti-trend technical indicators show too many golden crosses and dead crosses during the operation process. When expressing when to peak and when to bottom, it is not clear enough and is obviously misleading
[0011] Therefore, when performing technical analysis on the price movement changes of market trends based on traditional anti-trend technical indicators, the technical graphics have obvious problems of lag, ambiguity and misleading, making it difficult for investors to correct Analyzing the trend characteristics of market price operation and the possible support and resistance conditions may easily lead to errors in analysis and judgment and may lead to investment operation errors, resulting in investment losses

Method used


Image

  • Three-dimensional butterfly line technical model and application thereof in technical analysis of financial market
  • Three-dimensional butterfly line technical model and application thereof in technical analysis of financial market
  • Three-dimensional butterfly line technical model and application thereof in technical analysis of financial market

Examples


Embodiment 1

[0094] 1. Analysis and application of 3D butterfly line

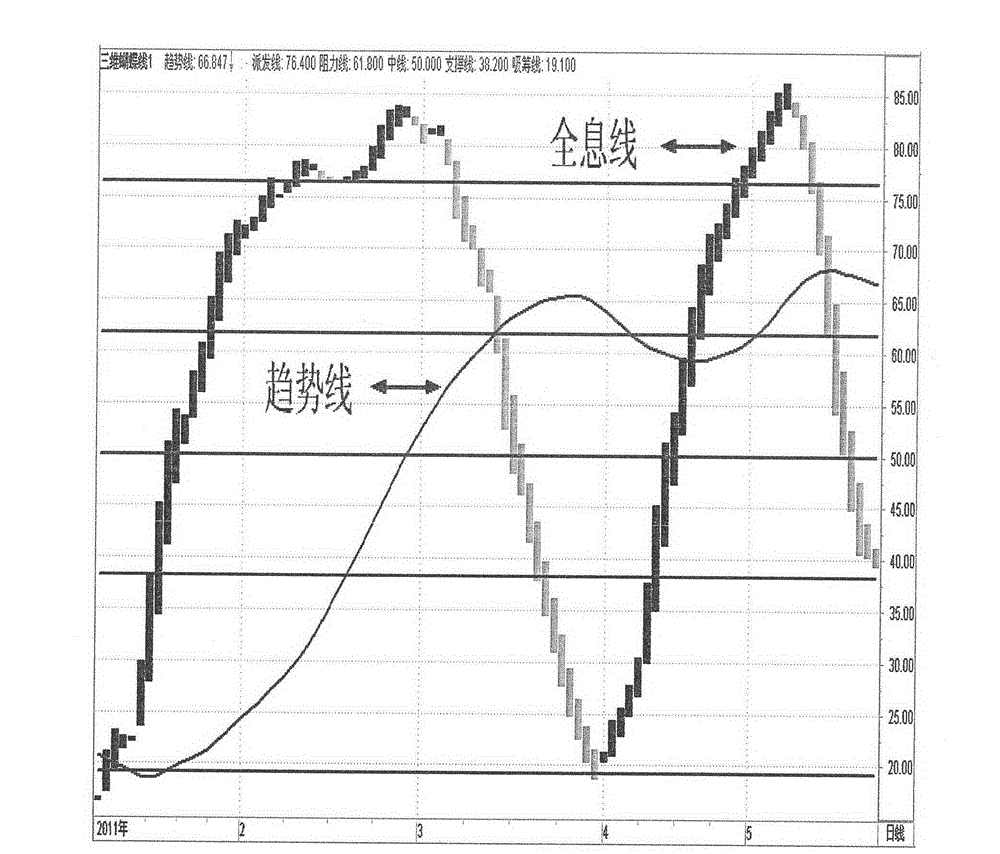
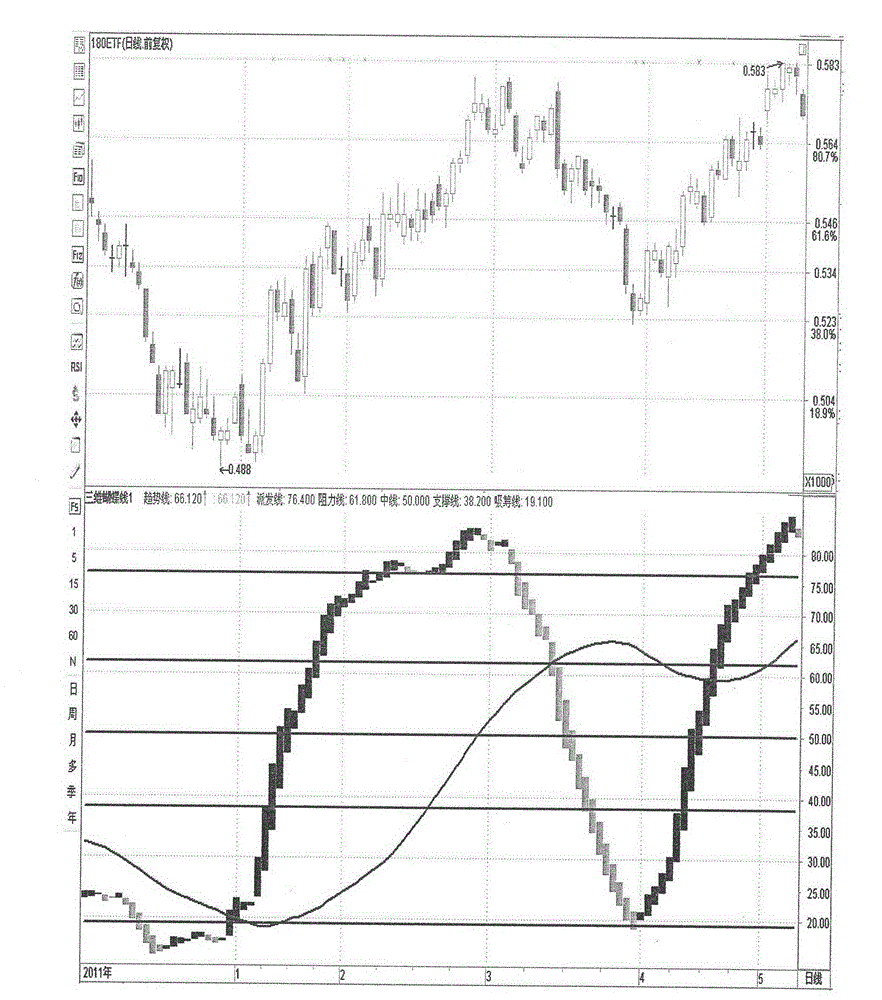
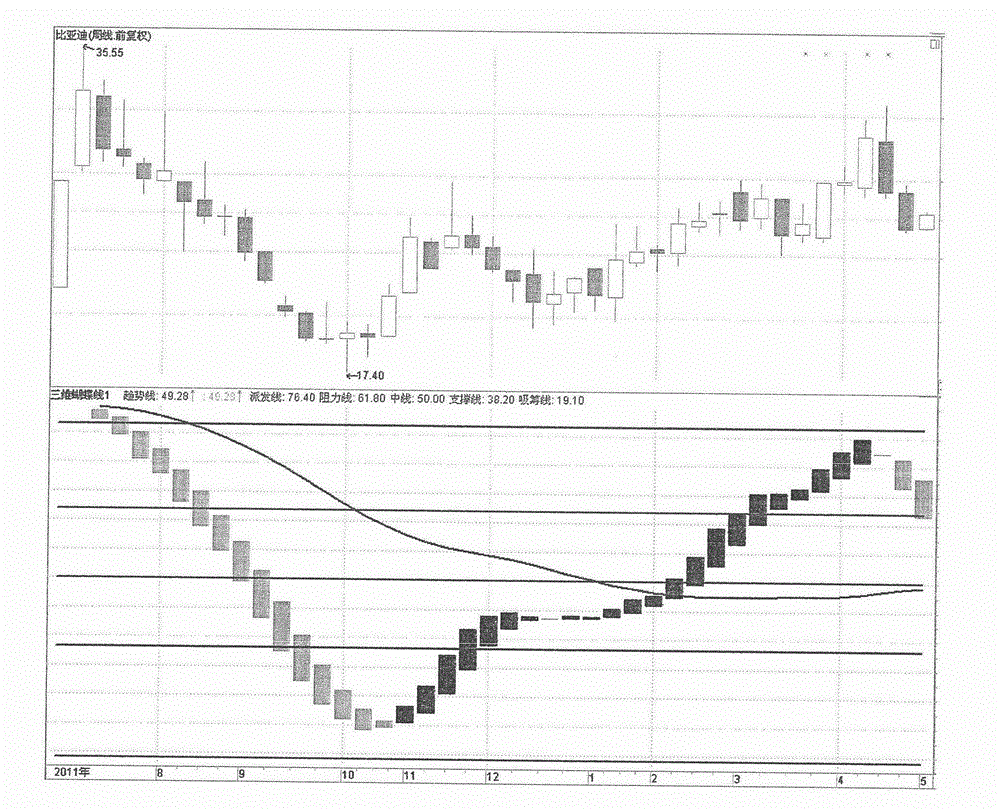
[0095] The application of the mathematical model of the three-dimensional butterfly line in the technical analysis of the financial market is mainly carried out through the expression form of the wave movement of the three-dimensional butterfly line technical index between 0 and 100.

[0096] Through the programming language of the stock technical analysis software, the mathematical model of the three-dimensional butterfly line is displayed as a graphic technical index of the holographic line and the support and resistance line, forming a new type of technical analysis index, thus forming a new type of independent technology Analytical theory and methods. It can be used independently or combined with other technical indicators for in-depth analysis, research and judgment of price fluctuation trends in financial markets. The specific analysis and application methods are described as follows:

[0097] (1) Principles of ...


PUM


Abstract

The invention relates to a three-dimensional butterfly line technical model and application of the three-dimensional butterfly line technical model in the technical analysis of the financial market. The closing price of the average closing price is subjected to setting of the time parameter and counter-trend processing, the sum of golden ratios of the counter-trend prices of three adjacent trading hour units (today, yesterday and the day after yesterday) is taken as a base unit, and a new counter-trend price line, 'holographic line' for short, is formed after the equalization treatment. A long 'holographic line' and a short 'holographic line' or multiple 'holographic lines' with different periods are formed according to the differences of setting of the time period, and then the analysis is carried out with the assistance of multiple parallel lines formed by common analysis values in the financial market like the golden ratio and multiple or half of the golden ratio or the approximate golden ratio. The three-dimensional mode of the combination of price, time and space is scientifically defined, a brand new technical indicator is provided for the technical analysis of the financial market like security, future goods and gold, and the three-dimensional butterfly line technical model is widely applicable to the trading markets to technically analyze security, future goods, gold and the like.

Description

technical field [0001] The invention relates to a three-dimensional butterfly line technical model and its application in financial market technical analysis. Background technique [0002] In the existing technical analysis of financial markets such as securities, futures, and gold, the anti-trend index of stock prices (that is, overbought and oversold indicators) is an important curve describing stock price trends, and it is the most commonly used analysis in market technical analysis. The method is the most commonly used secondary chart indicator in market technical analysis software. [0003] In the existing traditional technical analysis of financial markets such as securities, futures, and gold, there are about 400 kinds of technical analysis indicators, and anti-trend technical indicators account for more than 1 / 5, and there are about 80 kinds. However, the commonly used anti-trend technical indicators take Qianlong software as an example, including CCI, DRF, KDJ, K%R...

Claims


Application Information

Patent Timeline
Patent Type & Authority Applications(China)
IPC IPC(8): G06Q40/04
Inventor 高进
Owner 高进
Why Eureka
Try Eureka