
Chemometrics method for classifying sample sets in spectrum analysis

A chemometrics and spectral analysis technology, applied in the field of sample set division, can solve the problems of spectral absorbance drift, tilt, data measurement error, and it is difficult to obtain the prediction effect of the calibration model.

Inactive Publication Date: 2014-07-30
GUILIN UNIVERSITY OF TECHNOLOGY
View PDF3 Cites 0 Cited by
  • Summary
  • Abstract
  • Description
  • Claims
  • Application Information

AI Technical Summary

Problems solved by technology

However, in the process of spectral measurement, due to the experimental environment, operating skills, instrument precision and other reasons, the spectral absorbance may produce noises such as drift and tilt; similarly, in the measurement of chemical values, conventional chemical measurement methods cannot Avoid bringing system noise, environmental noise, operating noise, etc., which will cause measurement errors in the data, making it difficult for the established calibration model to obtain ideal prediction results

Method used


Image

  • Chemometrics method for classifying sample sets in spectrum analysis
  • Chemometrics method for classifying sample sets in spectrum analysis
  • Chemometrics method for classifying sample sets in spectrum analysis

Examples


Embodiment

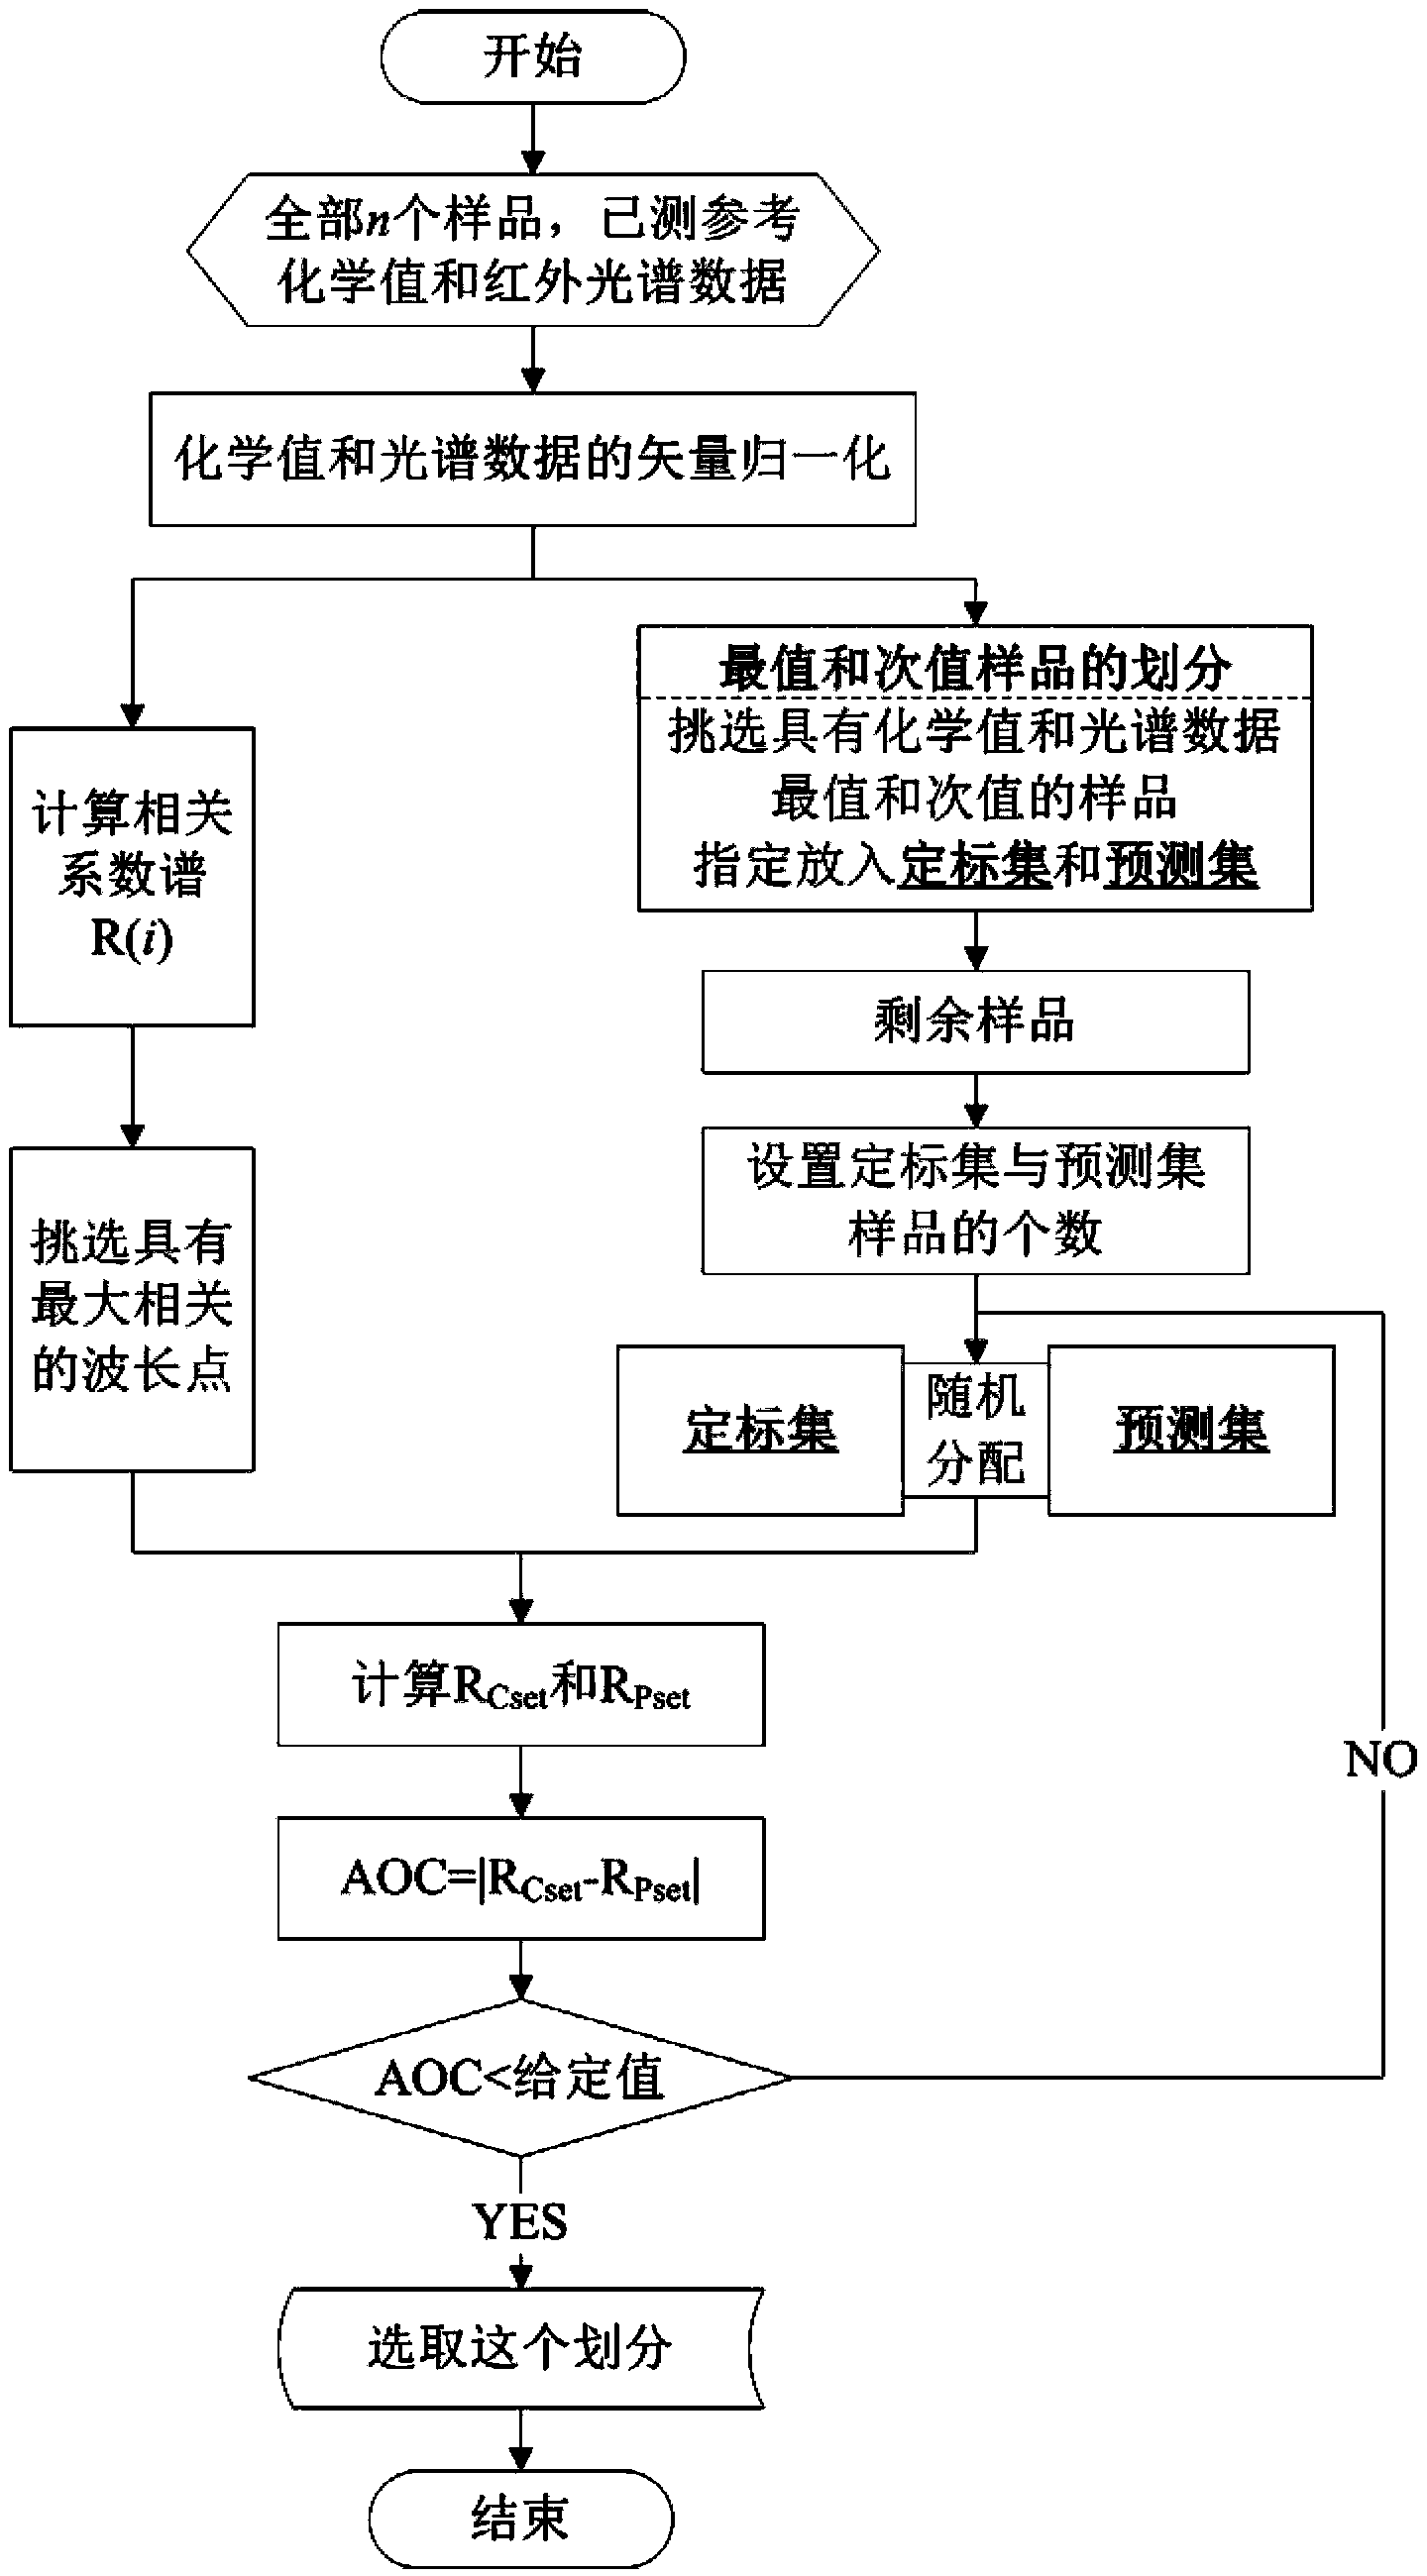
[0042] Taking the near-infrared analysis of grapefruit peel pectin as an example, there are 118 grapefruit peel samples (N=118), and each sample obtains the spectral value of 3114 wavelength points (P=3114) through spectral experiment measurement, according to approximately 2:1 The ratio of the calibration set distributes 78 samples (L=78), and the prediction set distributes 40 samples (K=40); adopt the method of the present invention to divide the samples, concrete steps:

[0043] 1) Data normalization

[0044] a) Normalization of reference chemical values

[0045] Based on the known pectin chemical values ​​of 118 pomelo peel samples (numbered from 1 to 118), the average number C is first calculated by formula (1) m =4.987(%), further according to the average C m , the normalized value C of the chemical value of each sample is calculated by formula (2) n (j).

[0046] b) Normalization of spectral data

[0047] Based on the known spectral data of 118 pomelo peel samples ...


PUM


Abstract

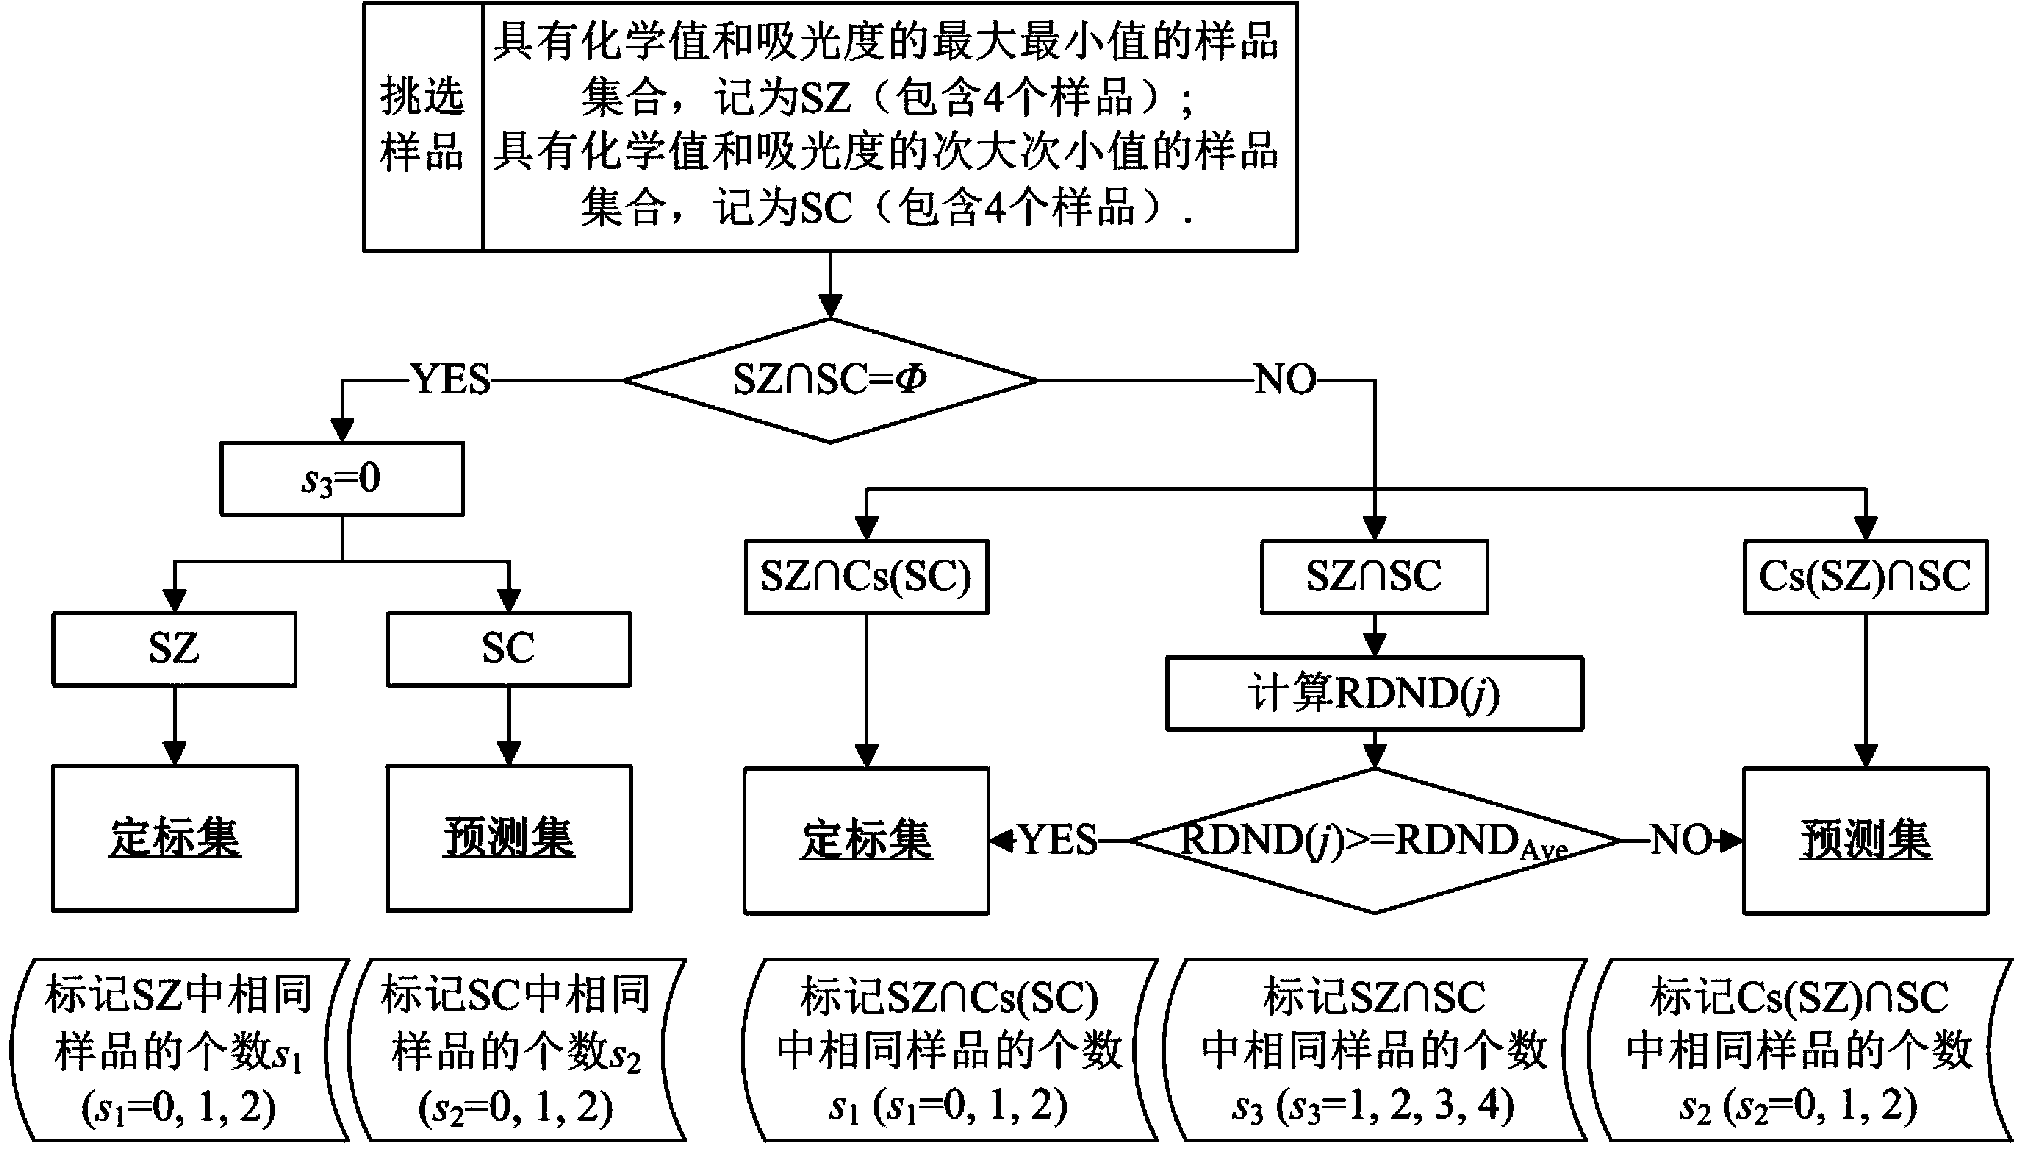
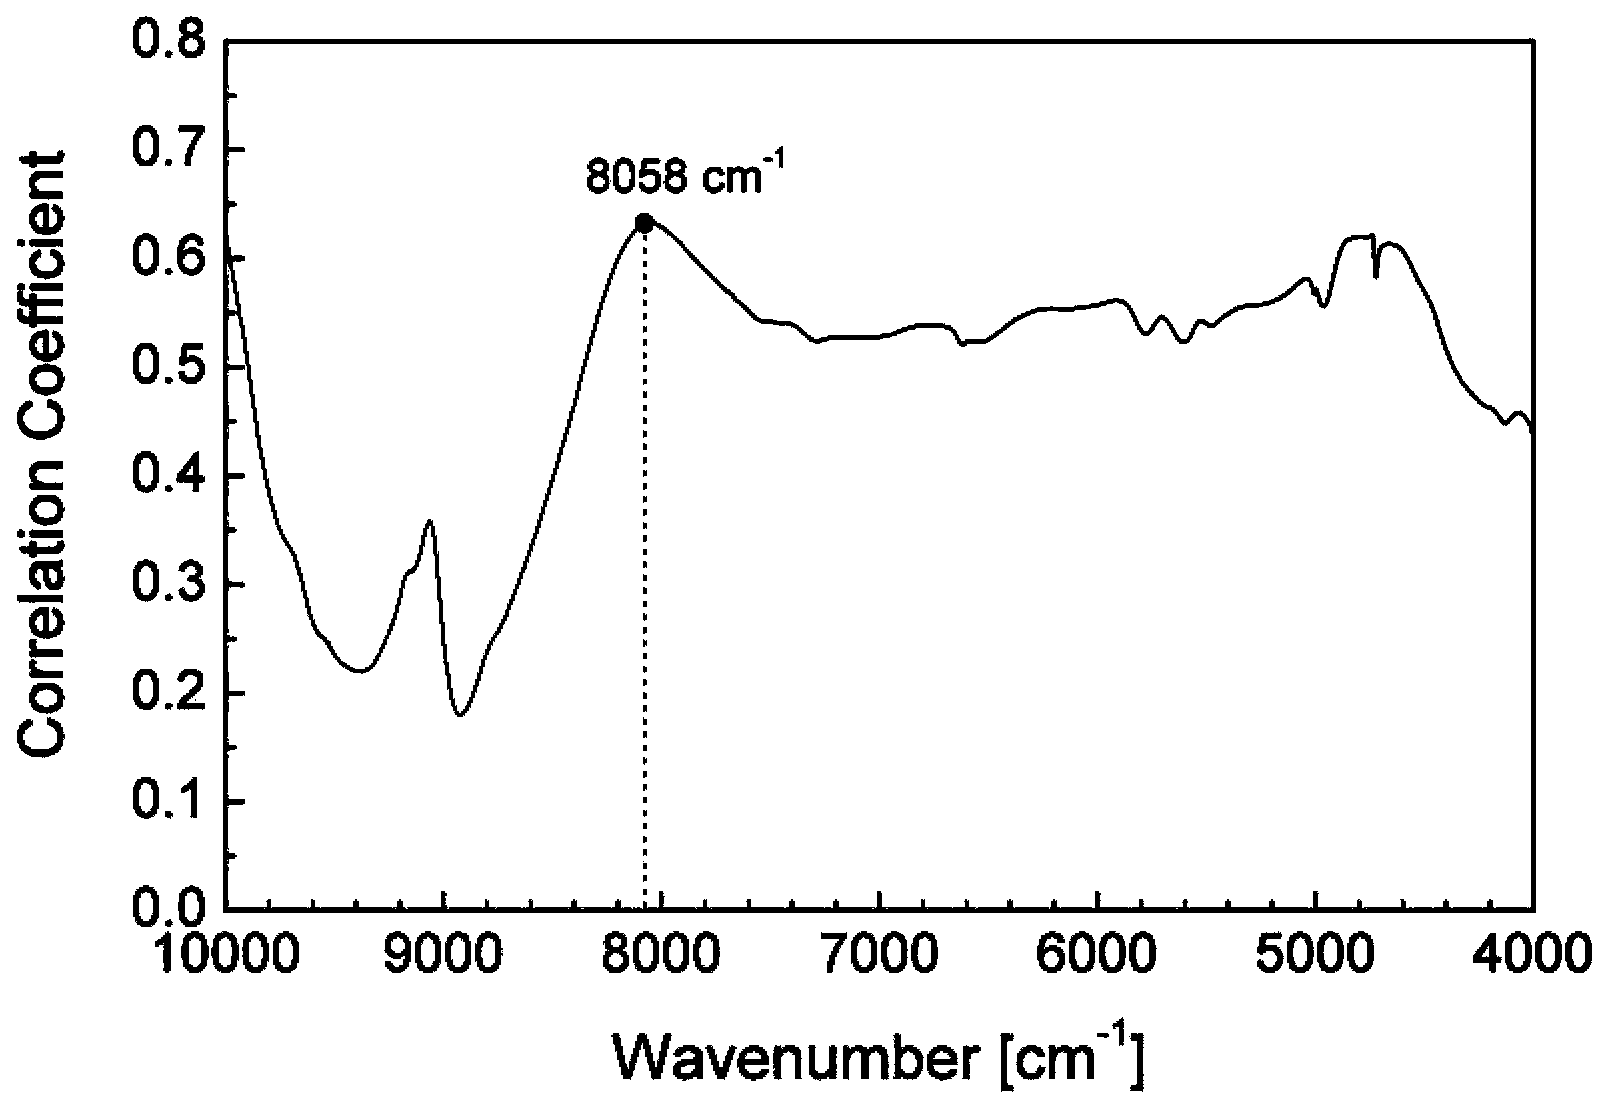
The invention discloses a chemometrics method for classifying sample sets in spectrum analysis. A correlation coefficient of a reference chemical value and spectrum absorbance on each wavelength is calculated, and a wavelength point with highest correlation coefficient is found in a full spectrum range; normalization processing is conducted for the reference chemical value and the spectrum data of each sample; two samples with maximal reference chemical value and minimal reference chemical value and two samples with maximal absorbance and minimal absorbance are placed into a calibration set based on the normalized data, and four samples with correspondently reduced values are placed into a prediction set; and residual samples are adequately and randomly classified for multiple times, a correlation coefficient of each chemical value and absorbance of samples in the calibration set and the prediction set is respectively calculated for each time of classification, and if the correlation coefficient of the calibration set for one time of classification is adequately approximate to the correlation coefficient of the predication set, the classification is selected to establish a spectrum analysis model. Due to the adoption of the chemometrics method, a good data foundation is provided for the optimization of the model of the spectrum analysis.

Description

technical field [0001] The invention relates to the technical field of sample set division in spectral analysis, in particular to a chemometrics method for the division of a calibration set and a prediction set. Background technique [0002] Spectral analysis is a method of determining the chemical composition and content of a substance through qualitative or quantitative analysis based on the spectrum of the substance, because it has the advantages of rapidity, sensitivity, and non-invasiveness. At present, the spectral analysis mainly includes infrared spectral analysis, ultraviolet spectral analysis, Raman spectral analysis and so on. In particular, near-infrared (NIR) spectral analysis technology has application advantages in many fields such as environment, food, agriculture, biomedicine, etc., due to its characteristics of simplicity, rapidity, non-destructiveness, real-time online, and multi-component simultaneous detection. [0003] Spectral analysis needs to divide...

Claims


Application Information

Patent Timeline
Patent Type & Authority Patents(China)
IPC IPC(8): G01N21/31G01N21/35G01N21/359G01N21/33G01N21/65
Inventor 陈华舟
Owner GUILIN UNIVERSITY OF TECHNOLOGY
Learn More