Visual implementation method for sequential function chart

A technology of sequential function diagrams and implementation methods, applied in the field of visual programming, can solve the problems of real-time control applications that cannot meet the response speed, and achieve the effect of improving operating efficiency

Active Publication Date: 2012-07-25
NR ELECTRIC CO LTD +1
View PDF2 Cites 10 Cited by
  • Summary
  • Abstract
  • Description
  • Claims
  • Application Information

AI Technical Summary

Problems solved by technology

[0010] Sequential function charts are used in the fields of industrial control and power systems. However, the existing implementation methods of sequential function charts use a switch-case code generation mode, which needs to complete the state switching and execution functions within two operating cycles, which cannot meet the requirements. Real-time control applications that require high response speed

Method used


Image

  • Visual implementation method for sequential function chart
  • Visual implementation method for sequential function chart
  • Visual implementation method for sequential function chart

Examples


Embodiment Construction

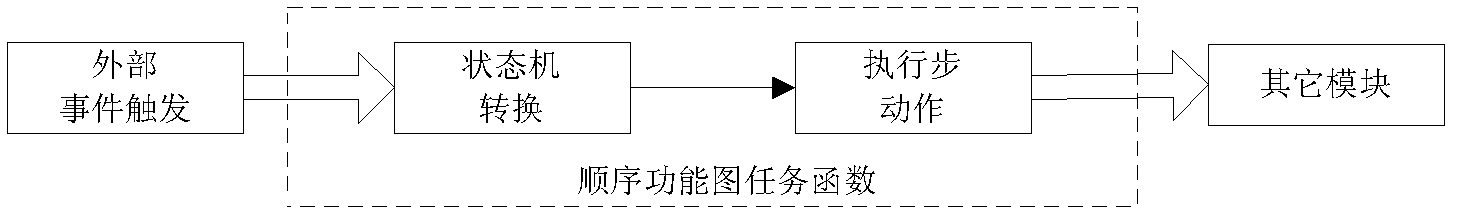
[0028] The present invention provides a visual realization method of sequential function chart, which includes the following three parts:

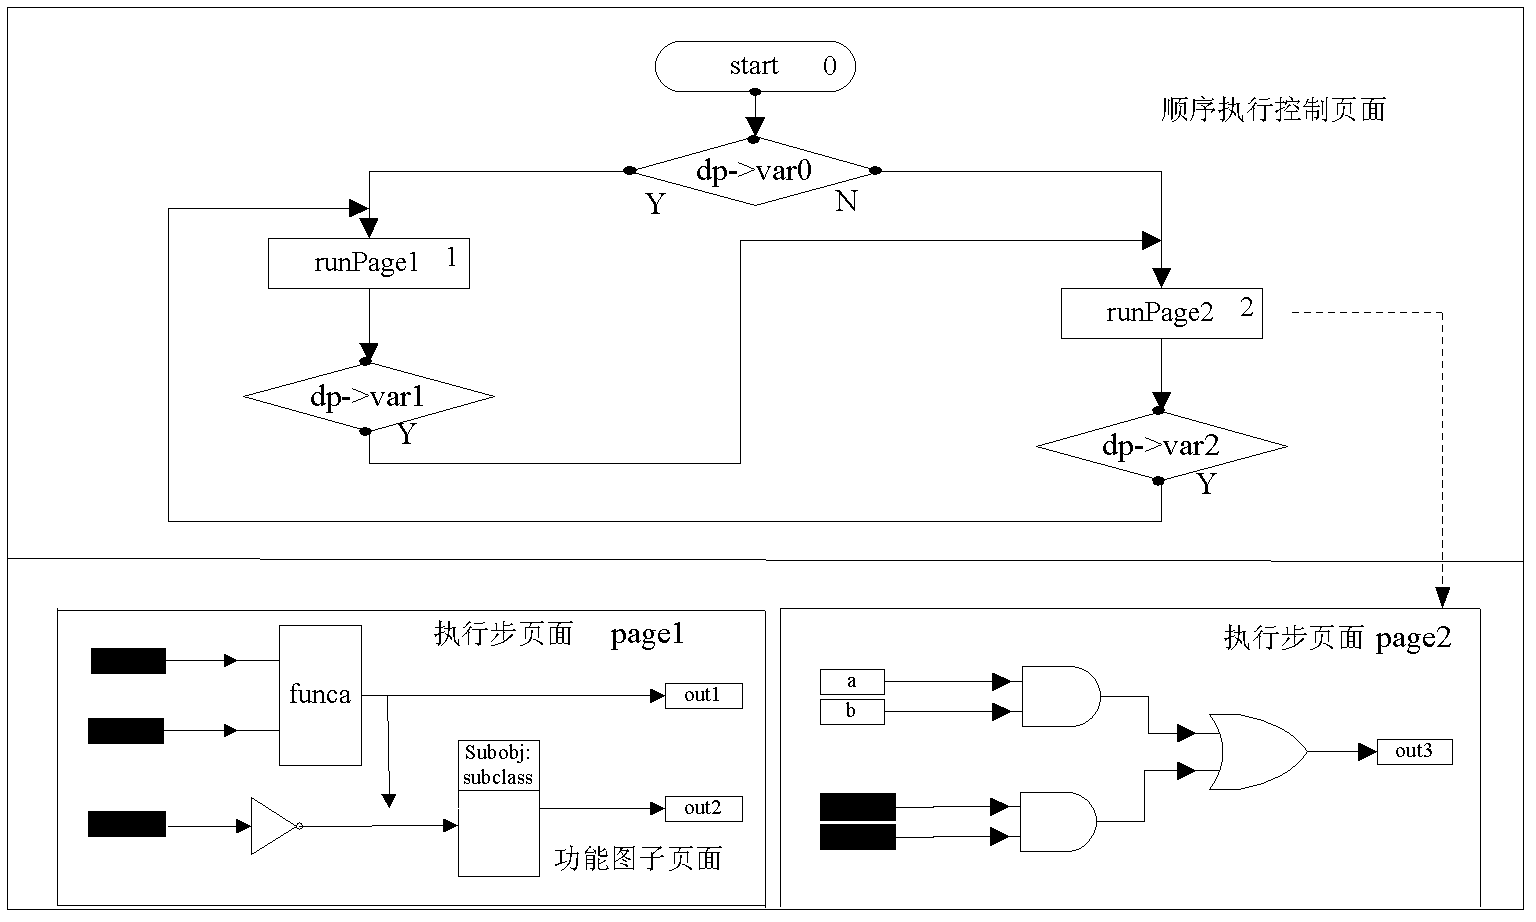
[0029] The first part defines the visual page types of sequential function diagrams. Specifically, the page types are divided into three categories: sequential execution control pages, execution step pages, and function diagram subpages. figure 2 shown below, respectively.

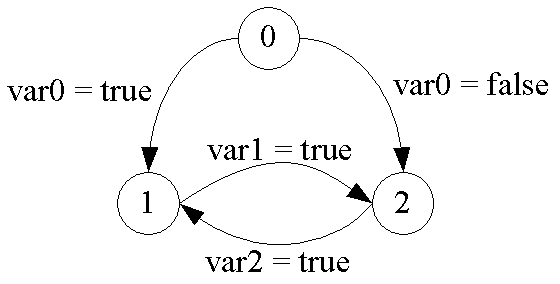
[0030] First, in figure 2 There are a total of 3 if conditional jump blocks in , and the state machine has 3 states (0, 1, 2). Initially the state value is 0. When var0 is true, jump to the first state, when var0 is false, jump to the second state. Jump to the second state when var1 is true. Jump to the first state when var2 is true. When the status value is 1, run runPage1, and when the status value is 2, run runPage2. image 3 expressed figure 2 A state machine transition process that executes functions sequentially.

[0031] The rules of the sequential ex...


PUM


Abstract

The invention discloses a visual implementation method for a sequential function chart, which includes the two steps: firstly, designing a double switch-case code generation pattern of the sequential function chart; and secondly, calling a sequential function chart code generation tool for checking rules and outputting codes. A first switch structure is used for updating state variable values, and a second switch structure is used for operating corresponding control execution functions according to the new state variable values, and switching states and executing action in the same operational cycle. Visual programs are clearly organized by means of classifying page types and defining conception rules, and state switching and execution are completed in the same cycle by the aid of the double switch-case code generation pattern, so that the operational efficiency of the sequential function chart is improved.

Description

technical field [0001] The invention belongs to the field of visual programming, and in particular relates to a visual realization method of a sequential function chart. Background technique [0002] Sequential Function Chart (SFC) refers to a graphic program used to design and implement a certain sequential control function or state transition function. It divides the entire control process into a series of control steps, and describes the effective execution sequence and control conditions. The core components of a sequential function chart are: [0003] 1) A state transition variable, according to the value of the state variable to run the corresponding execution step page function; [0004] 2) The rules of state transition control are realized by designing the sequential execution control page. [0005] The principle of sequential function chart is as follows figure 1 As shown, the relevant terms include state, event, transition, and action, which are introduced separ...

Claims


Application Information

Patent Timeline
IPC IPC(8): G06F9/44
Inventor 冯亚东陈宏君刘克金周强周磊赵天恩熊蕙李秋华
Owner NR ELECTRIC CO LTD
Why Eureka
Try Eureka