Mass spectrum detection method of serum polypeptide
A technology for mass spectrometry detection and serum peptides, which is applied in the field of mass spectrometry detection of serum peptides, can solve the problem of limited number of cases and achieve the effect of improving the discovery rate
- Summary
- Abstract
- Description
- Claims
- Application Information
AI Technical Summary
Problems solved by technology
Method used
Image
Examples
Embodiment 1
[0030] The mass spectrometry detection method of serum polypeptide of the present invention, its specific steps are as follows:
[0031] First, divide the selected magnetic beads (WCX magnetic beads from Dynal Company) into polymerase chain reaction tubes (PCR tubes) according to 32ul / tube (the magnetic beads should be mixed evenly before dispensing), and put the PCR tubes into Store in the refrigerator at 4°C until use;
[0032] Take a portion of the PCR tube packed with magnetic beads and place it on the magnetic processor, and remove the liquid in the PCR tube after 1-2 minutes;
[0033] Take the PCR tube out of the magnetic processor, add 100 μL of 50mmol / L sodium acetate buffer (pH 4.5) into the PCR tube, mix well and let it stand at room temperature for 3-5 minutes, then place the PCR tube on the magnetic processor , remove the liquid in the PCR tube after 1-2 minutes, repeat the above operation once;
[0034] Take out the PCR tube from the magnetic processor, add 100 ...
Embodiment 2
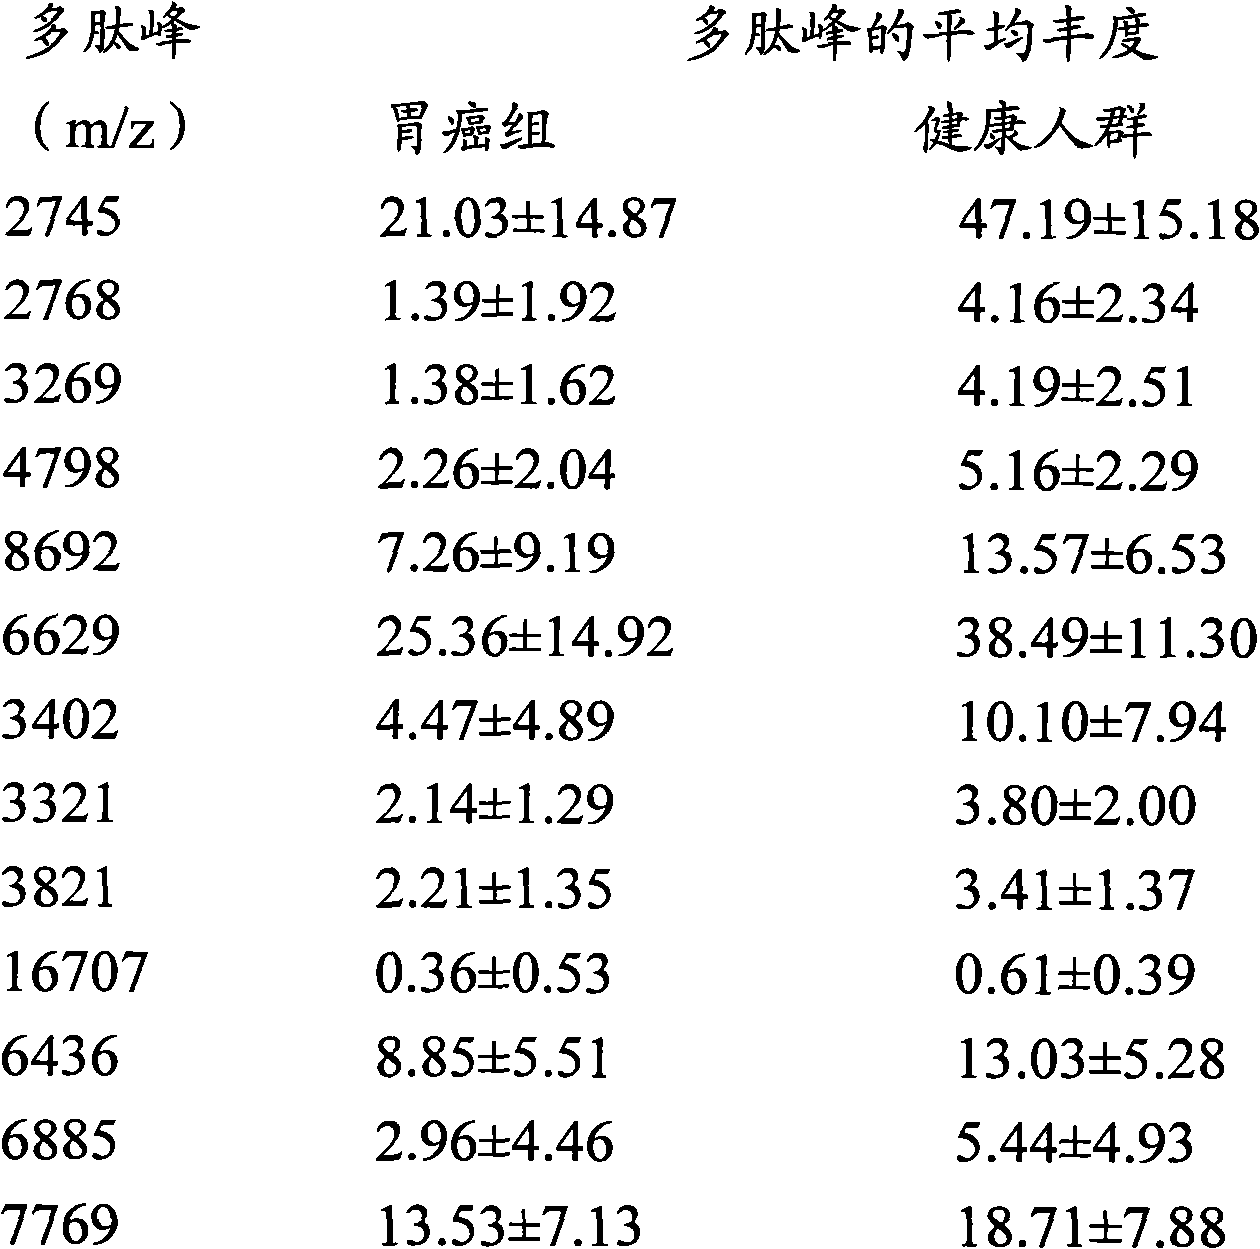
[0042] Serum samples from 42 patients with gastric cancer (including 12 cases of stage I, 6 cases of stage II, 18 cases of stage III, and 6 cases of stage IV, half male and half female) and 42 healthy people with matched sex and age were used as serum samples. Using the same method as in Example 1 to detect one by one. The measured serum peptide spectrum was standardized by the original protein fingerprint, and then analyzed by Biomarker Wizard software. A total of 75 protein peaks were detected in the molecular weight range of 2,000 to 30,000, of which 13 peaks were different from those in the gastric cancer group and the healthy control group. There was a very significant difference in group comparison (P<0.001). The abundance of different peaks is shown in Table 1. Table 1 shows the difference peaks of serum protein between 42 patients with gastric cancer and 42 healthy people.
[0043] Table 1
[0044]
[0045] Statistically, all P<0.001.
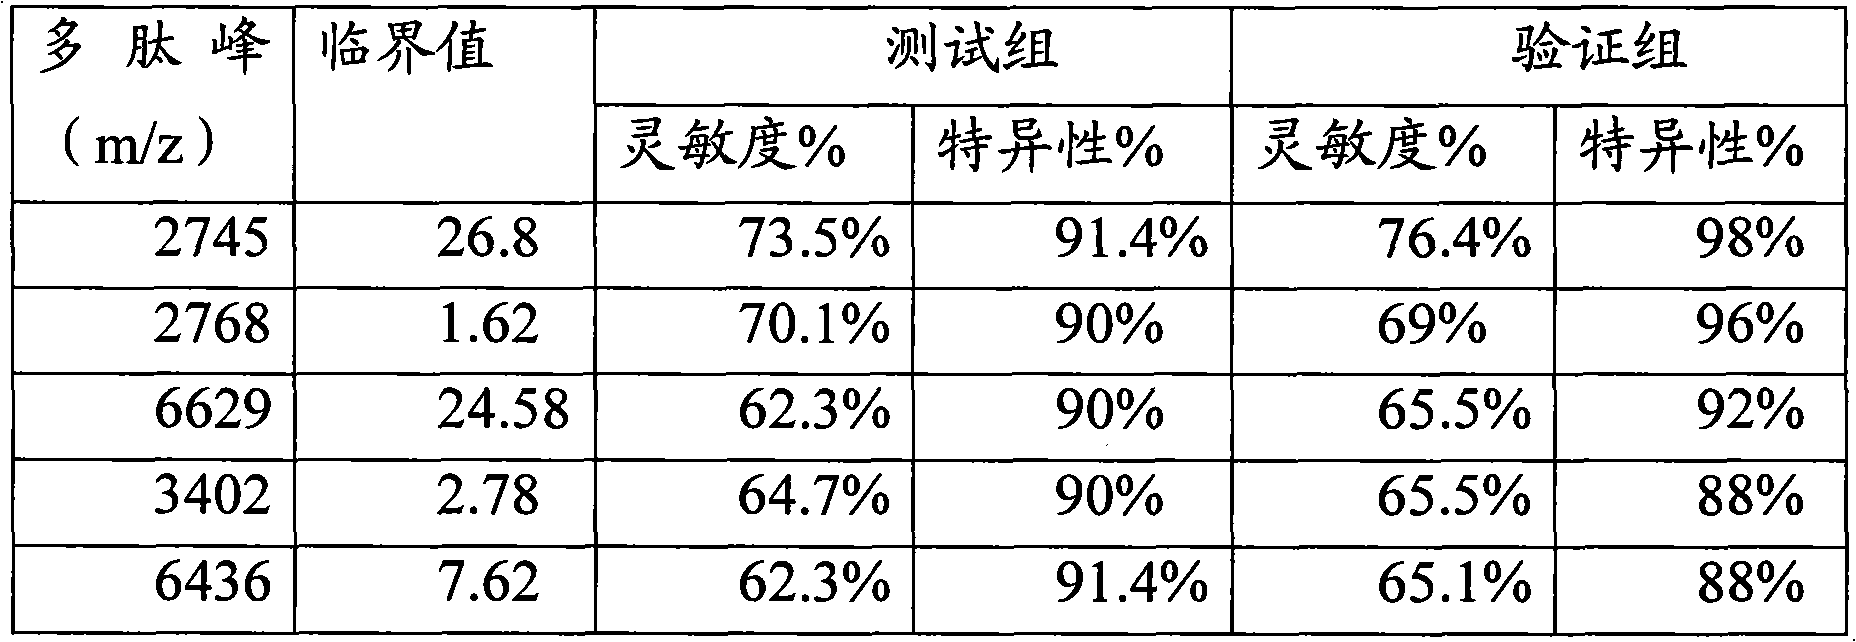
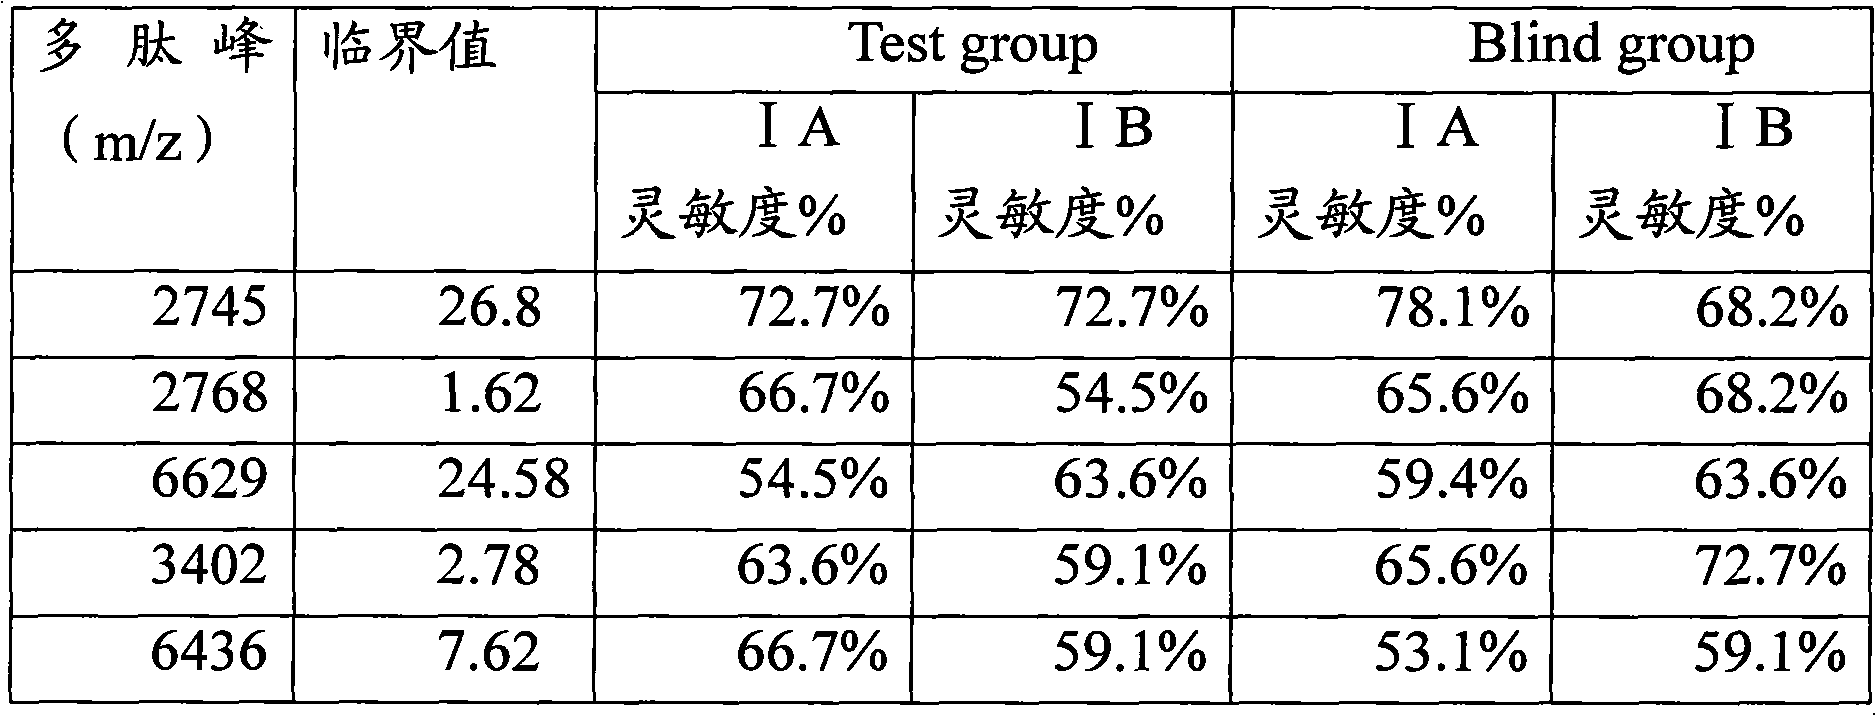
[0046] In order to further ev...
PUM
 Abstract
Description
Claims
Application Information
 - R&D
- Intellectual Property
- Life Sciences
- Materials
- Tech Scout
- Unparalleled Data Quality
- Higher Quality Content
- 60% Fewer Hallucinations
Browse by: Latest US Patents, China's latest patents, Technical Efficacy Thesaurus, Application Domain, Technology Topic, Popular Technical Reports.
© 2025 PatSnap. All rights reserved.Legal|Privacy policy|Modern Slavery Act Transparency Statement|Sitemap|About US| Contact US: help@patsnap.com


