Blood coagulation analyzer, blood coagulation analysis method, and computer program product
a technology of blood coagulation and analyzer, which is applied in the direction of positive displacement liquid engine, laboratory glassware, instruments, etc., can solve the problems of increasing time and cost, dfbg value cannot be used instead of fibrinogen concentration, and measurement requires a lot of time and cos
- Summary
- Abstract
- Description
- Claims
- Application Information
AI Technical Summary
Benefits of technology
Problems solved by technology
Method used
Image

Examples
first example
[0129]FIG. 6 and FIG. 7 show a flowchart illustrating the first example of the analysis operation procedure by the blood coagulation analyzer 1. FIG. 6 shows the first half and FIG. 7 shows the second half of the flowchart. It is noted that A to G in FIG. 6 are connected to A to G in FIG. 7, respectively.
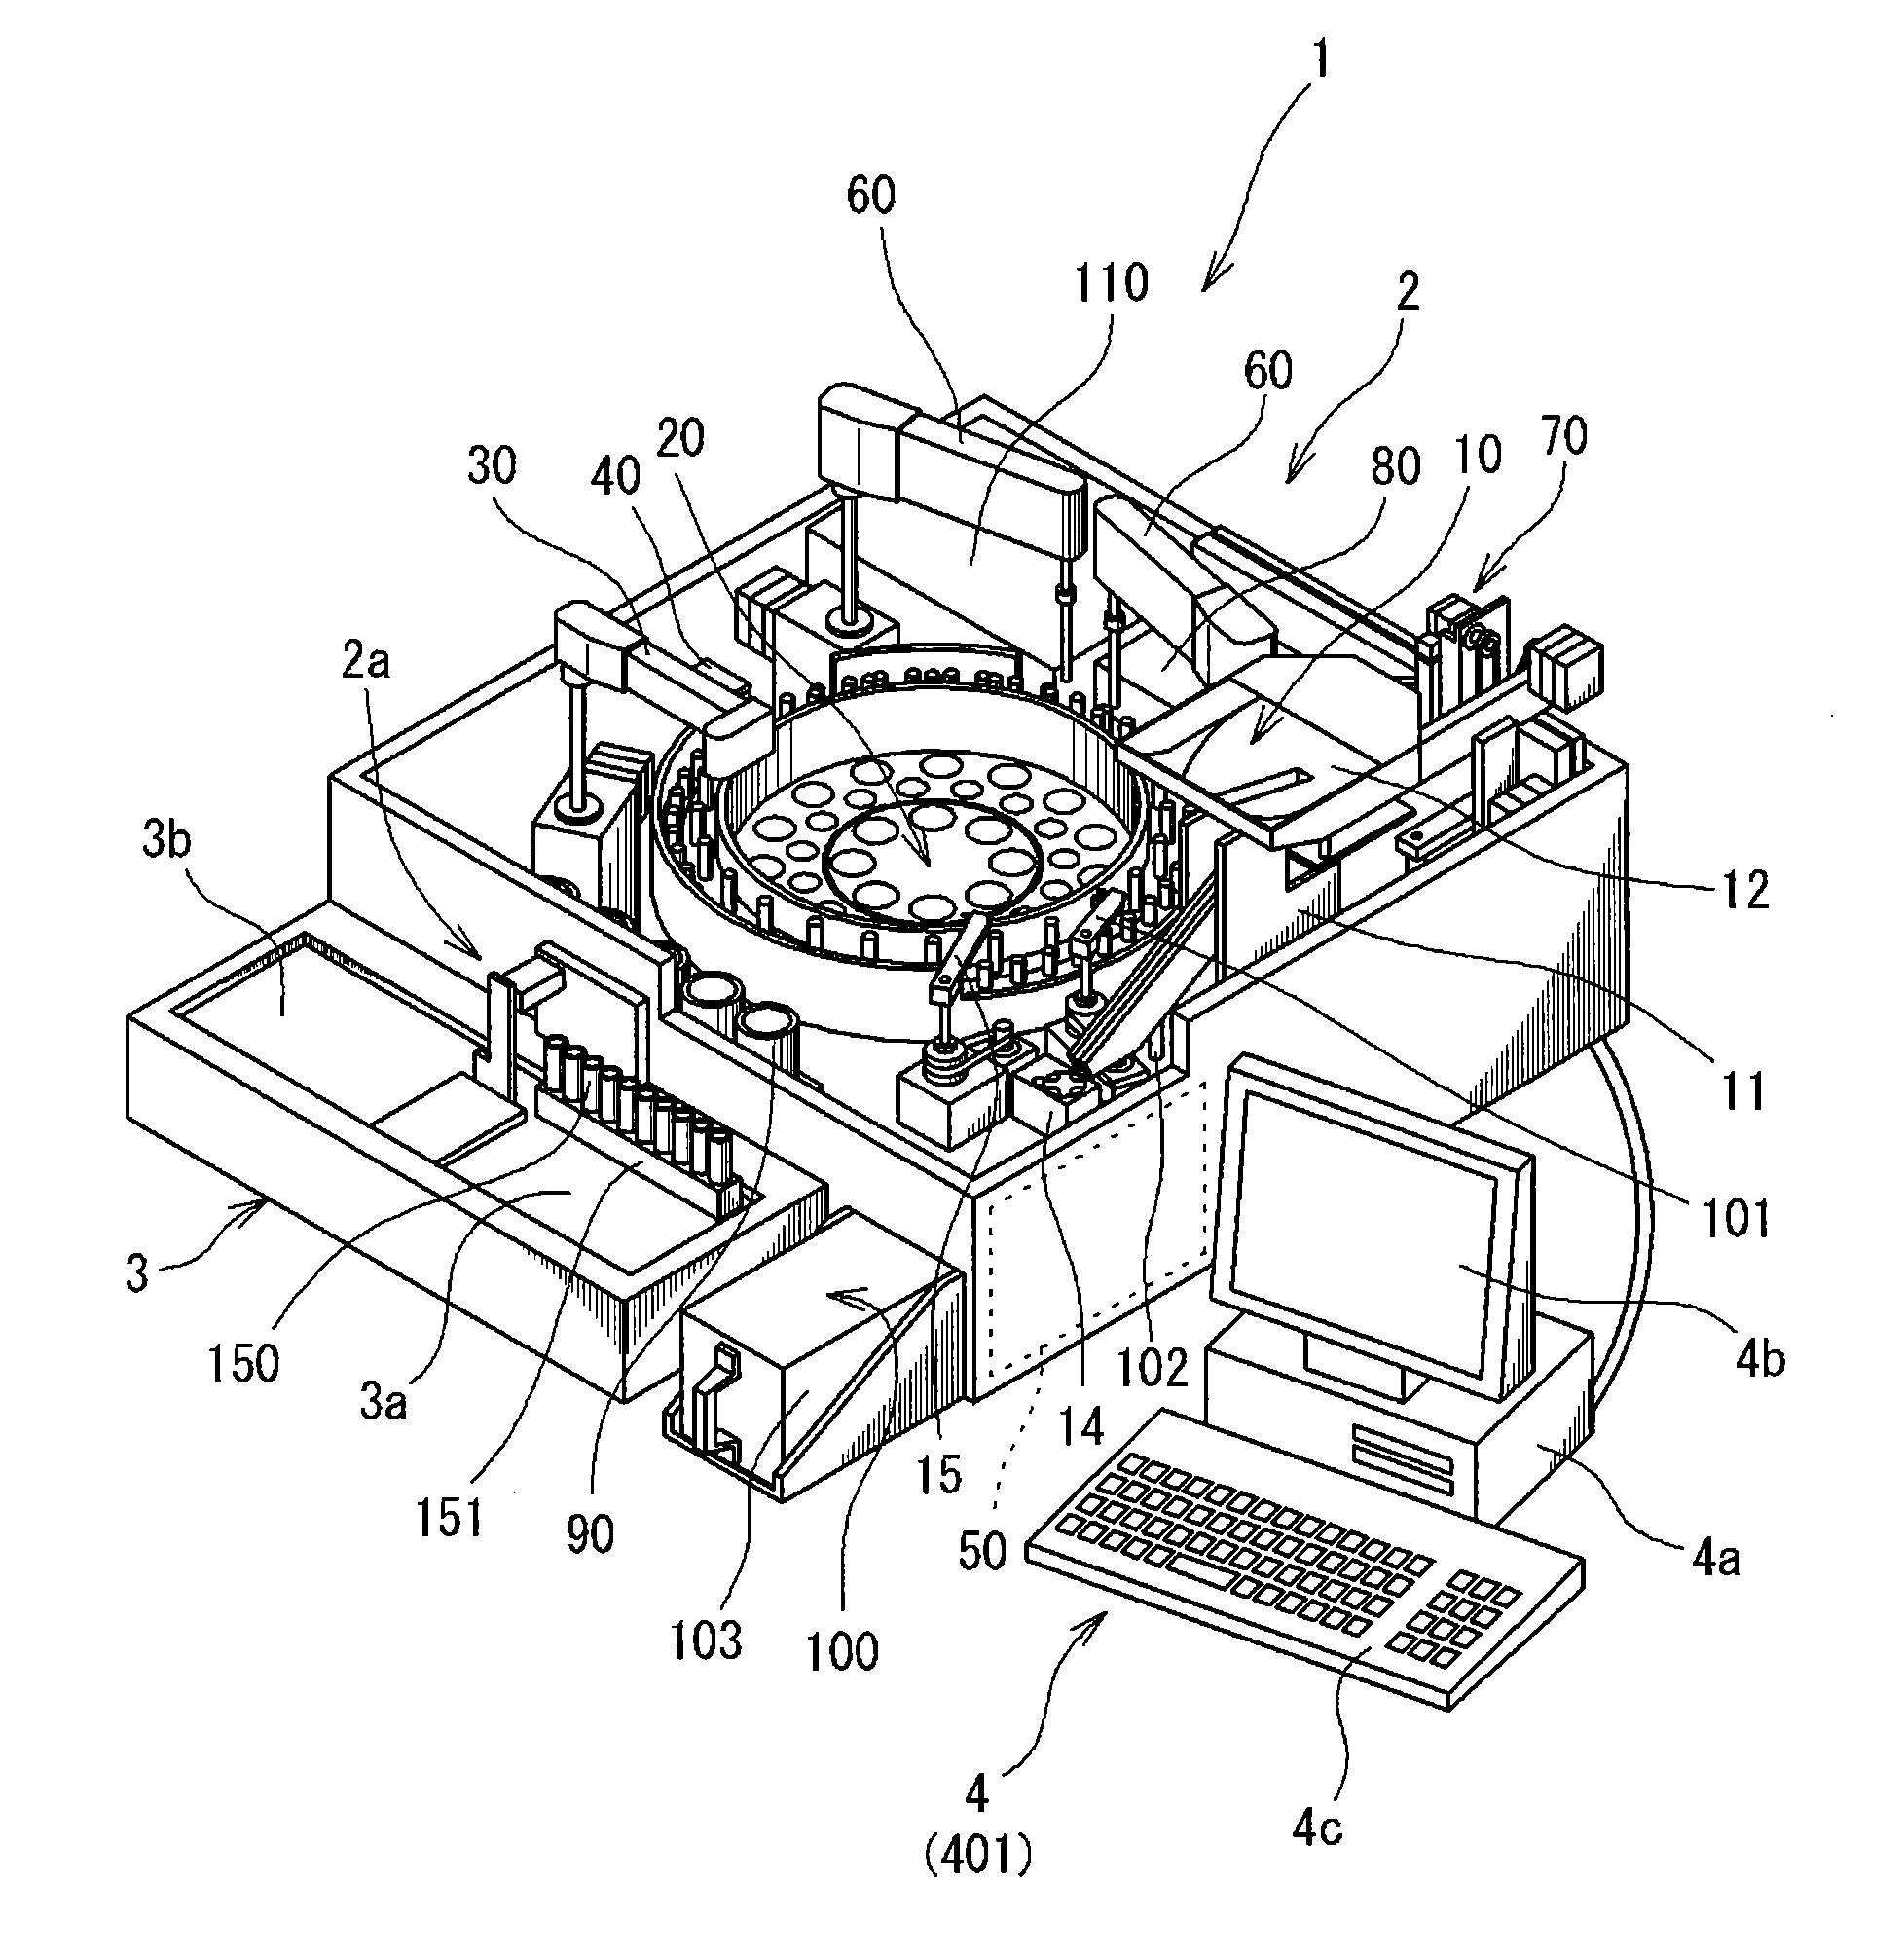
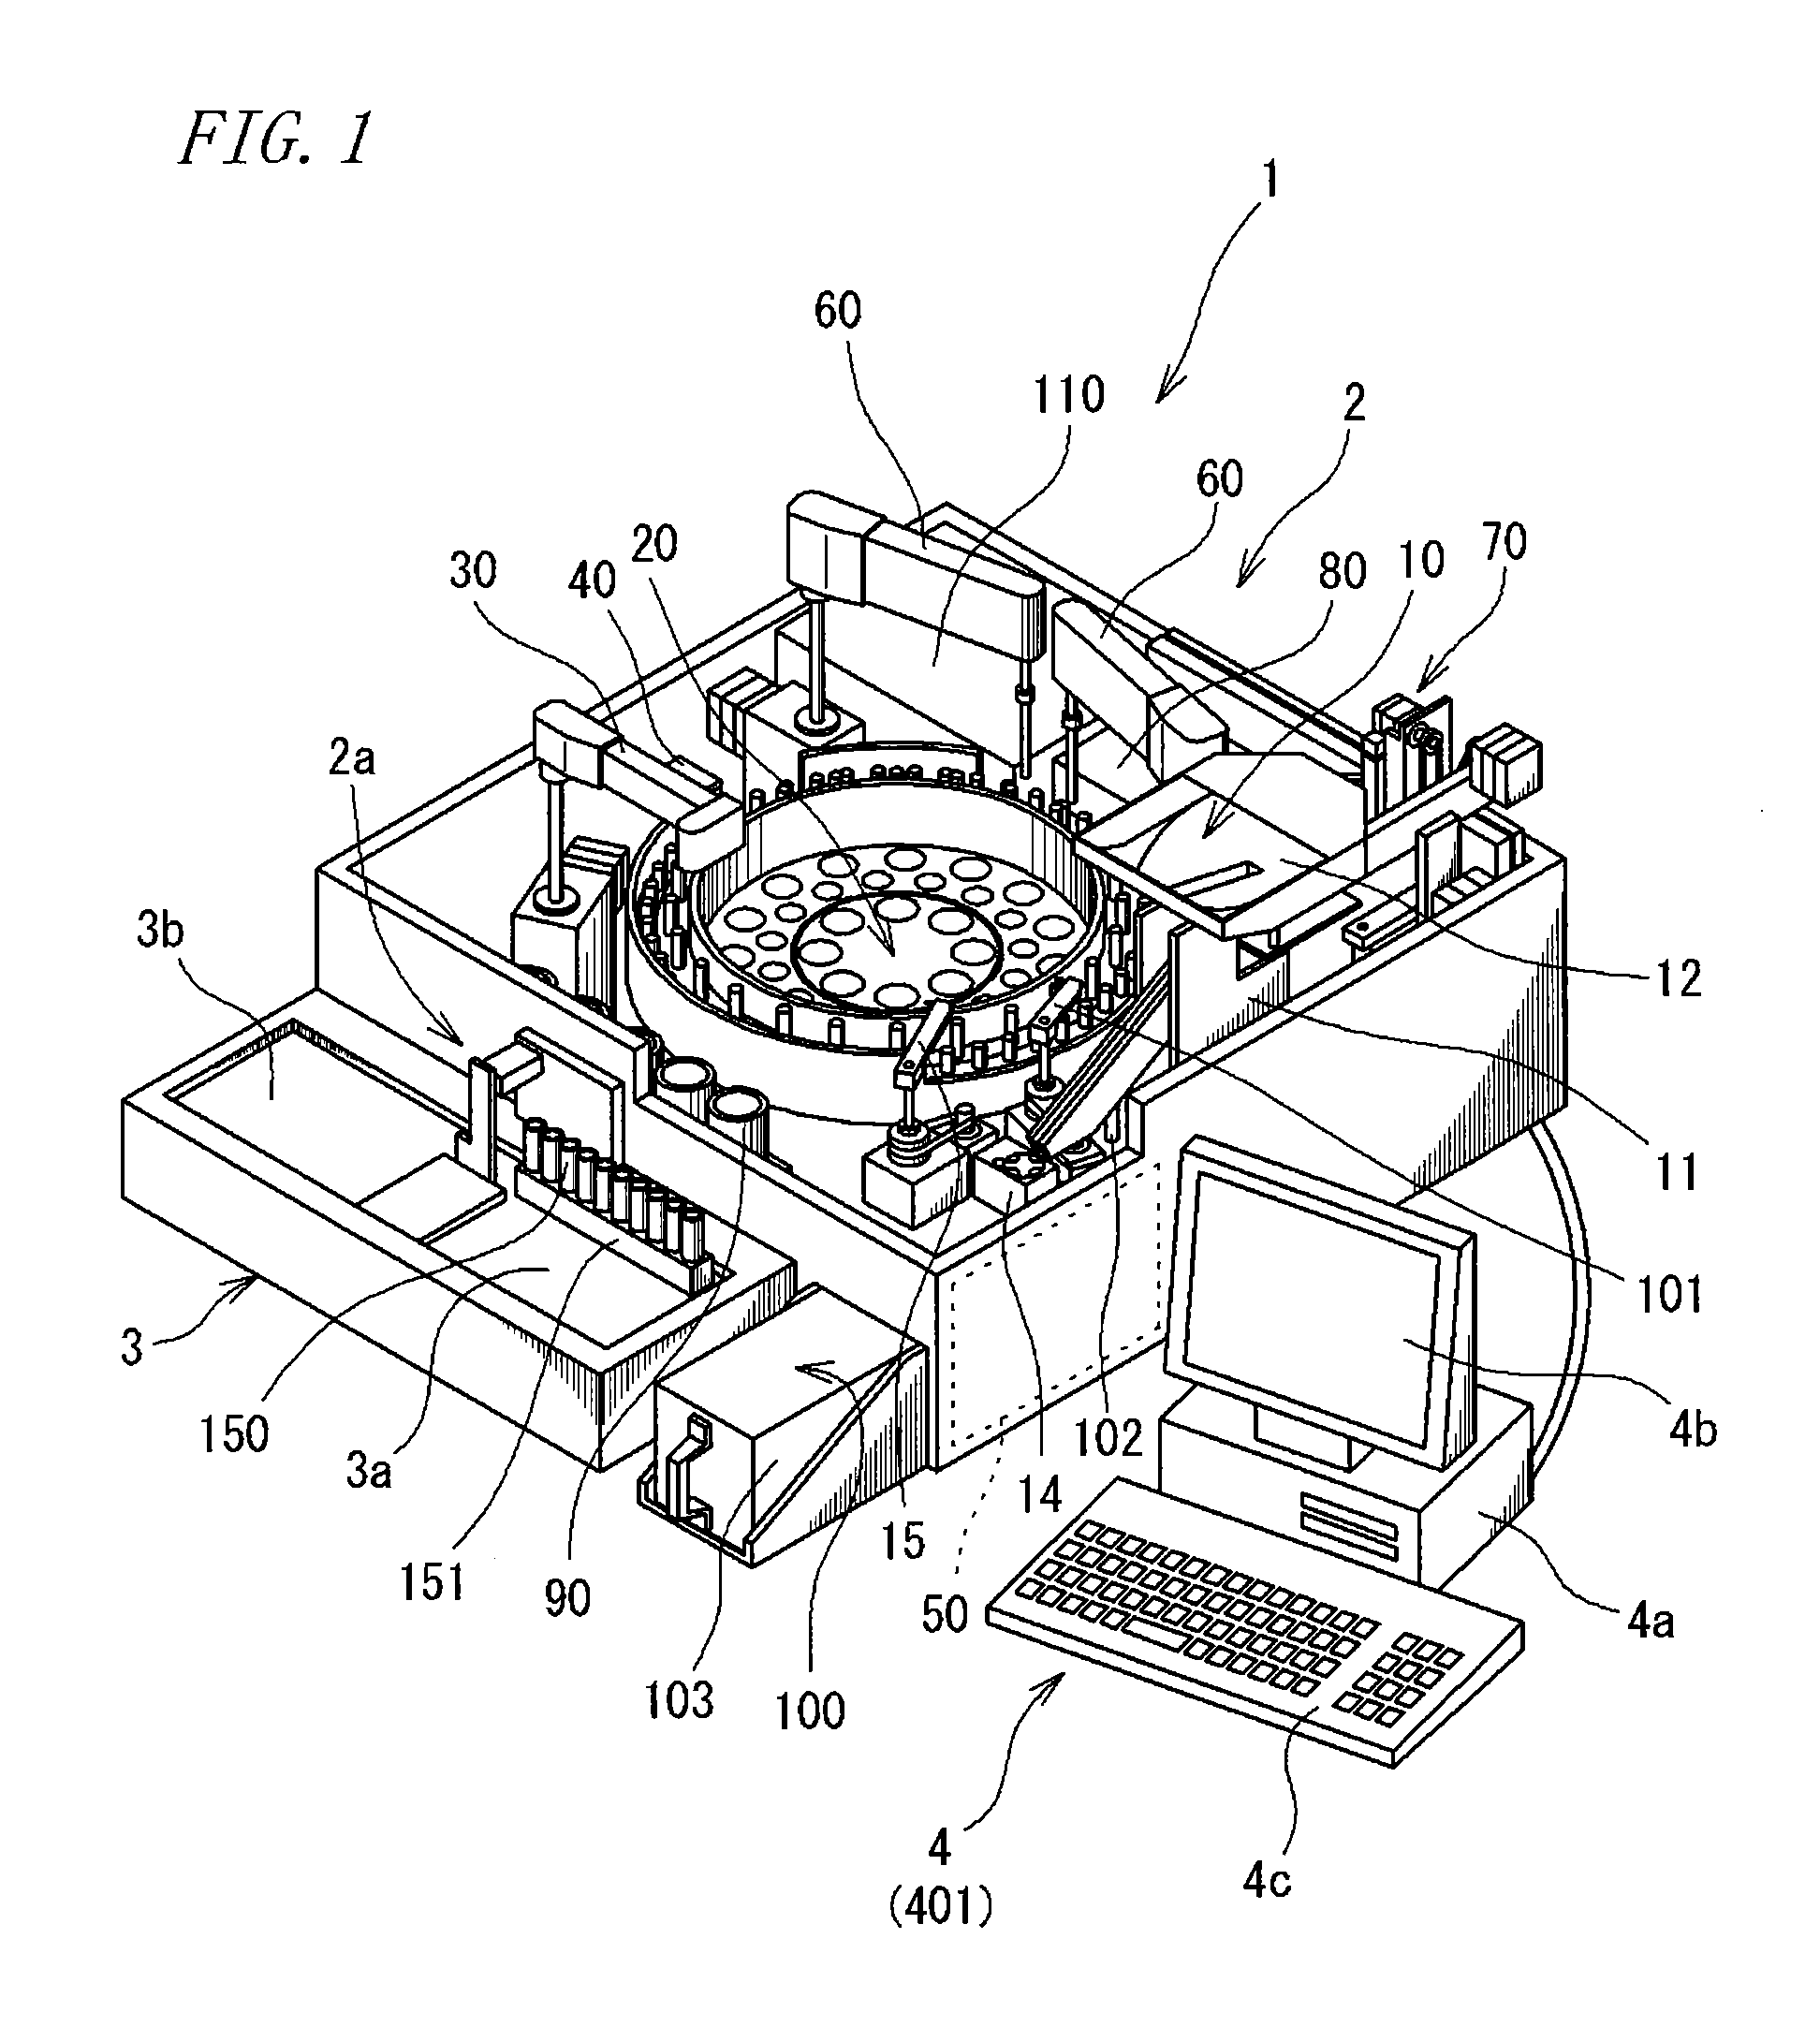
[0130]First, the respective power source of the measurement apparatus and the control apparatus 4 of the analyzer 1 shown in FIG. 1 is turned ON to thereby initialize the analyzer 1 (steps S1 and S101). This consequently provides an operation to return a mechanism for moving the cuvette 152 and the respective dispensing arms to initial positions and the initialization of software memorized in the control section 4a of the control apparatus 4 for example.
[0131]Next, in Step S102, it is determined by the control section 4a whether a measurement starting instruction is accepted or not. When the control section 4a determines that the measurement starting instruction is accepted (Yes), t...
second example
[0173]Next, the following section will describe the second example of the analysis operation procedure of the blood coagulation analyzer 1.
[0174]FIG. 9 to FIG. 10 show a flowchart illustrating the second example of the analysis operation procedure by the blood coagulation analyzer 1. FIG. 9 shows the first half and FIG. 10 shows the second half of the flowchart. It is noted that H to N in FIG. 9 are connected to H to N in FIG. 10, respectively.
[0175]The analysis operation procedure of the flowchart in FIG. 9 and FIG. 10 is different from that shown in FIG. 6 to FIG. 7 in that predetermined condition judgments are performed in Steps S43 and S44 in the measurement apparatus (see FIG. 11 and FIG. 12) and Steps S140 and S141 in the control apparatus 4 allow a dFbg value acquisition to be always followed by an instruction for starting an Fbg measurement. The following section will describe the flowchart in FIG. 9 to FIG. 10 mainly with regard to the differences from FIG. 6 to FIG. 7.
[017...
third example
[0196]Although the analysis operation procedure by the blood coagulation analyzer 1 has been described with regard to the first example and the second example, another configuration is also possible where these two examples are combined. In other words, in the flowchart shown in FIG. 7, the specimen dispensing operation in Step S13 and the reagent dispensing operation in Step S14 also can be substituted with Step S43 and Step S44 of FIG. 10. In this case, in Step S111 of FIG. 7, it is determined whether the dFbg value satisfies the condition of the predetermined range (N12) or not. When the dFbg value does not satisfy the condition of the predetermined range (N12), in Step S13, the dispensing amount of the specimen is determined by the conditional judgment as shown in FIG. 11. Then, in Step S14, the dispensing amount of the buffer solution is determined by the conditional judgment as shown in FIG. 12. Thus, in this case, there exist the threshold values N1 and N2 for determining whe...
PUM
| Property | Measurement | Unit |
|---|---|---|
| wavelength | aaaaa | aaaaa |
| wavelength | aaaaa | aaaaa |
| wavelengths | aaaaa | aaaaa |
Abstract
Description
Claims
Application Information
 - R&D
- Intellectual Property
- Life Sciences
- Materials
- Tech Scout
- Unparalleled Data Quality
- Higher Quality Content
- 60% Fewer Hallucinations
Browse by: Latest US Patents, China's latest patents, Technical Efficacy Thesaurus, Application Domain, Technology Topic, Popular Technical Reports.
© 2025 PatSnap. All rights reserved.Legal|Privacy policy|Modern Slavery Act Transparency Statement|Sitemap|About US| Contact US: help@patsnap.com