Predicting response to anti-CD20 therapy in DLBCL patients
- Summary
- Abstract
- Description
- Claims
- Application Information
AI Technical Summary
Benefits of technology
Problems solved by technology
Method used
Image
Examples
example 1
Selecting Predictive Expression Markers in DLBCL Patients Treated with Rituximab Using the Cox Proportional Hazards Model and a K-Nearest-Neighbor Method
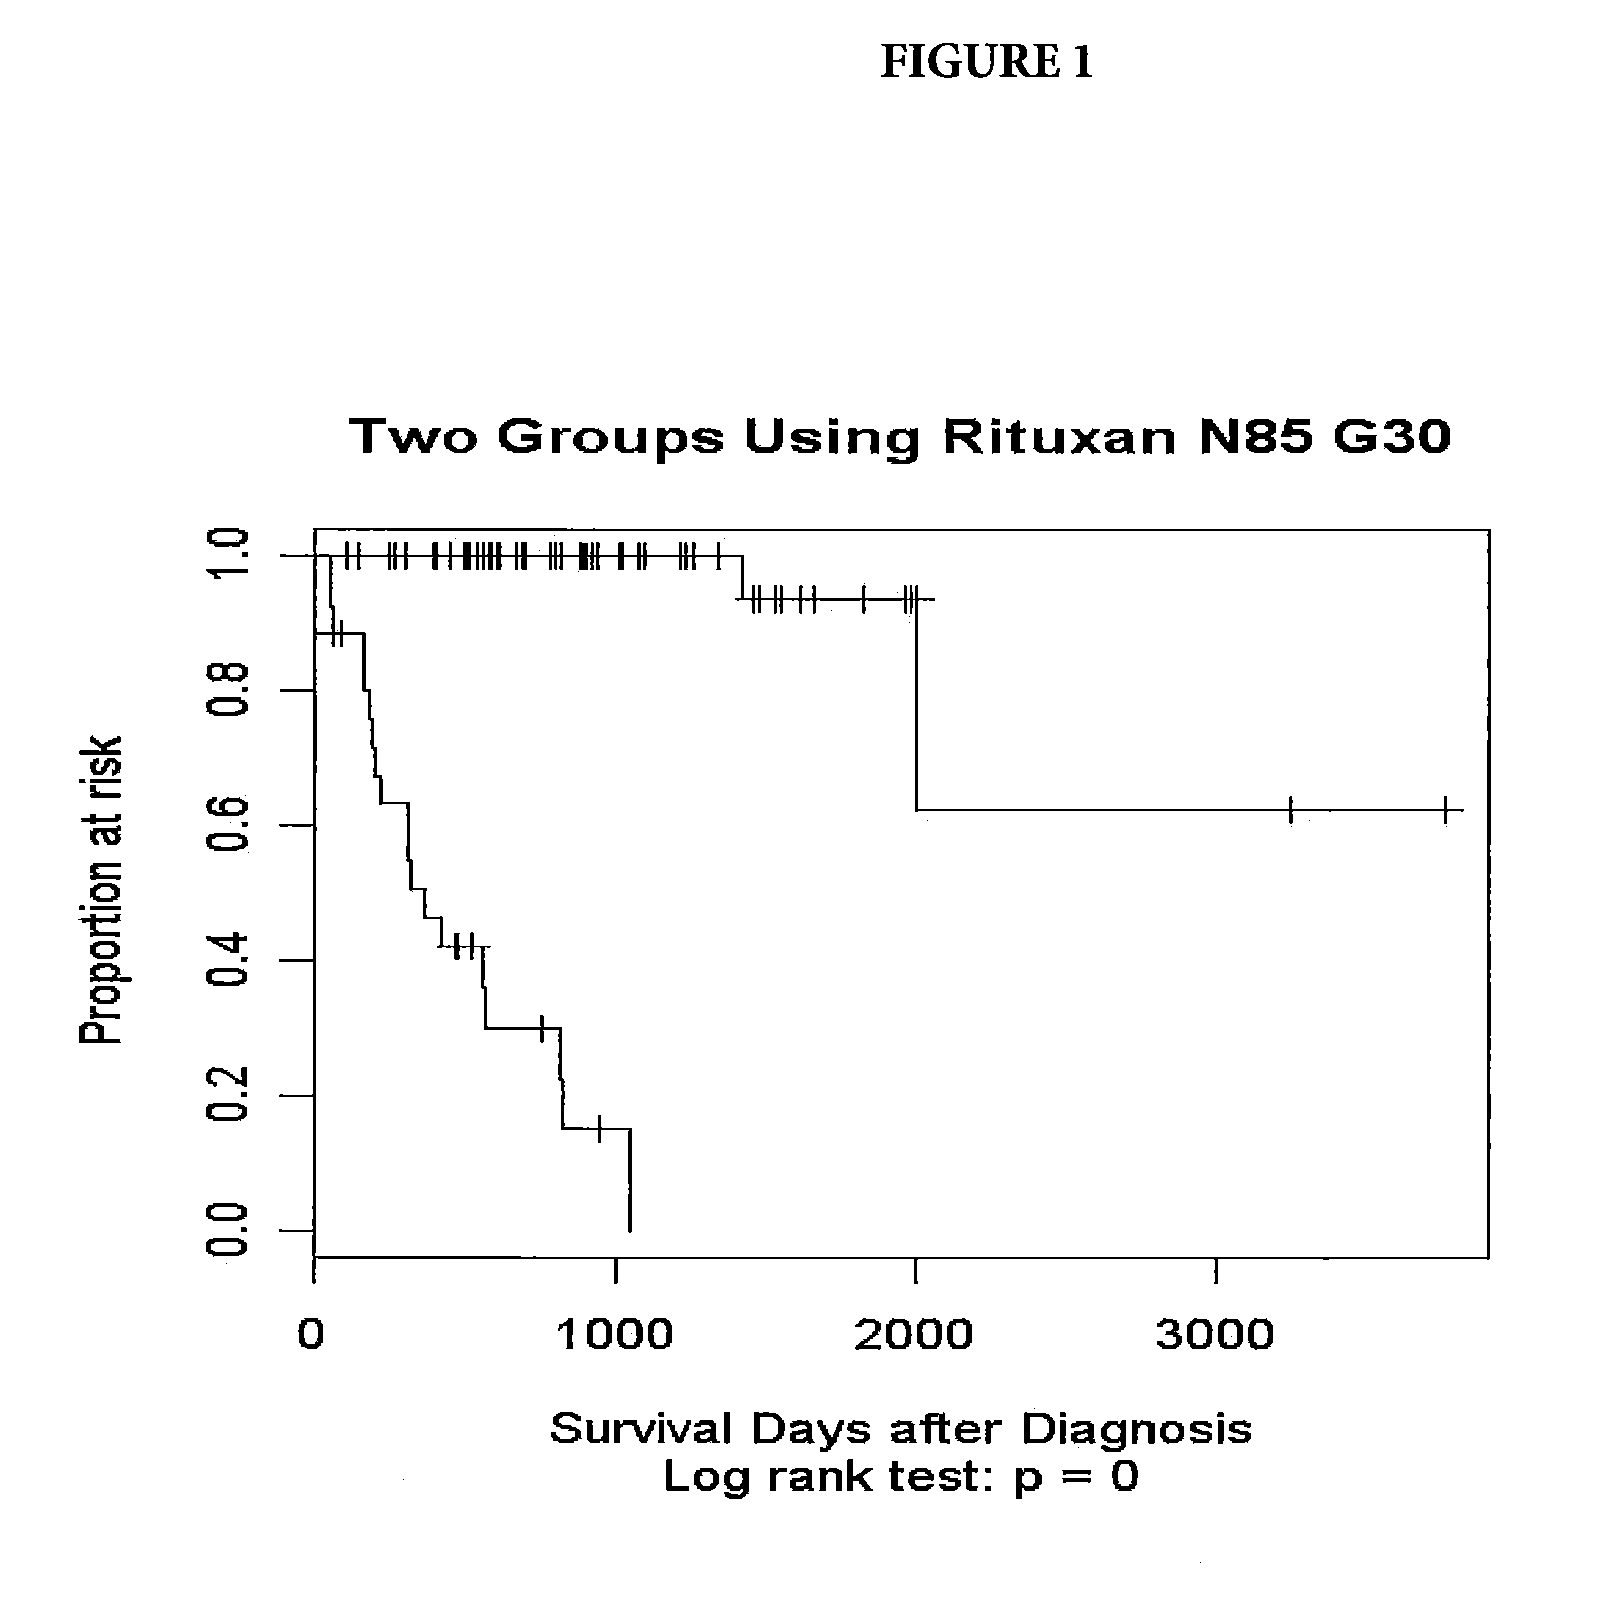
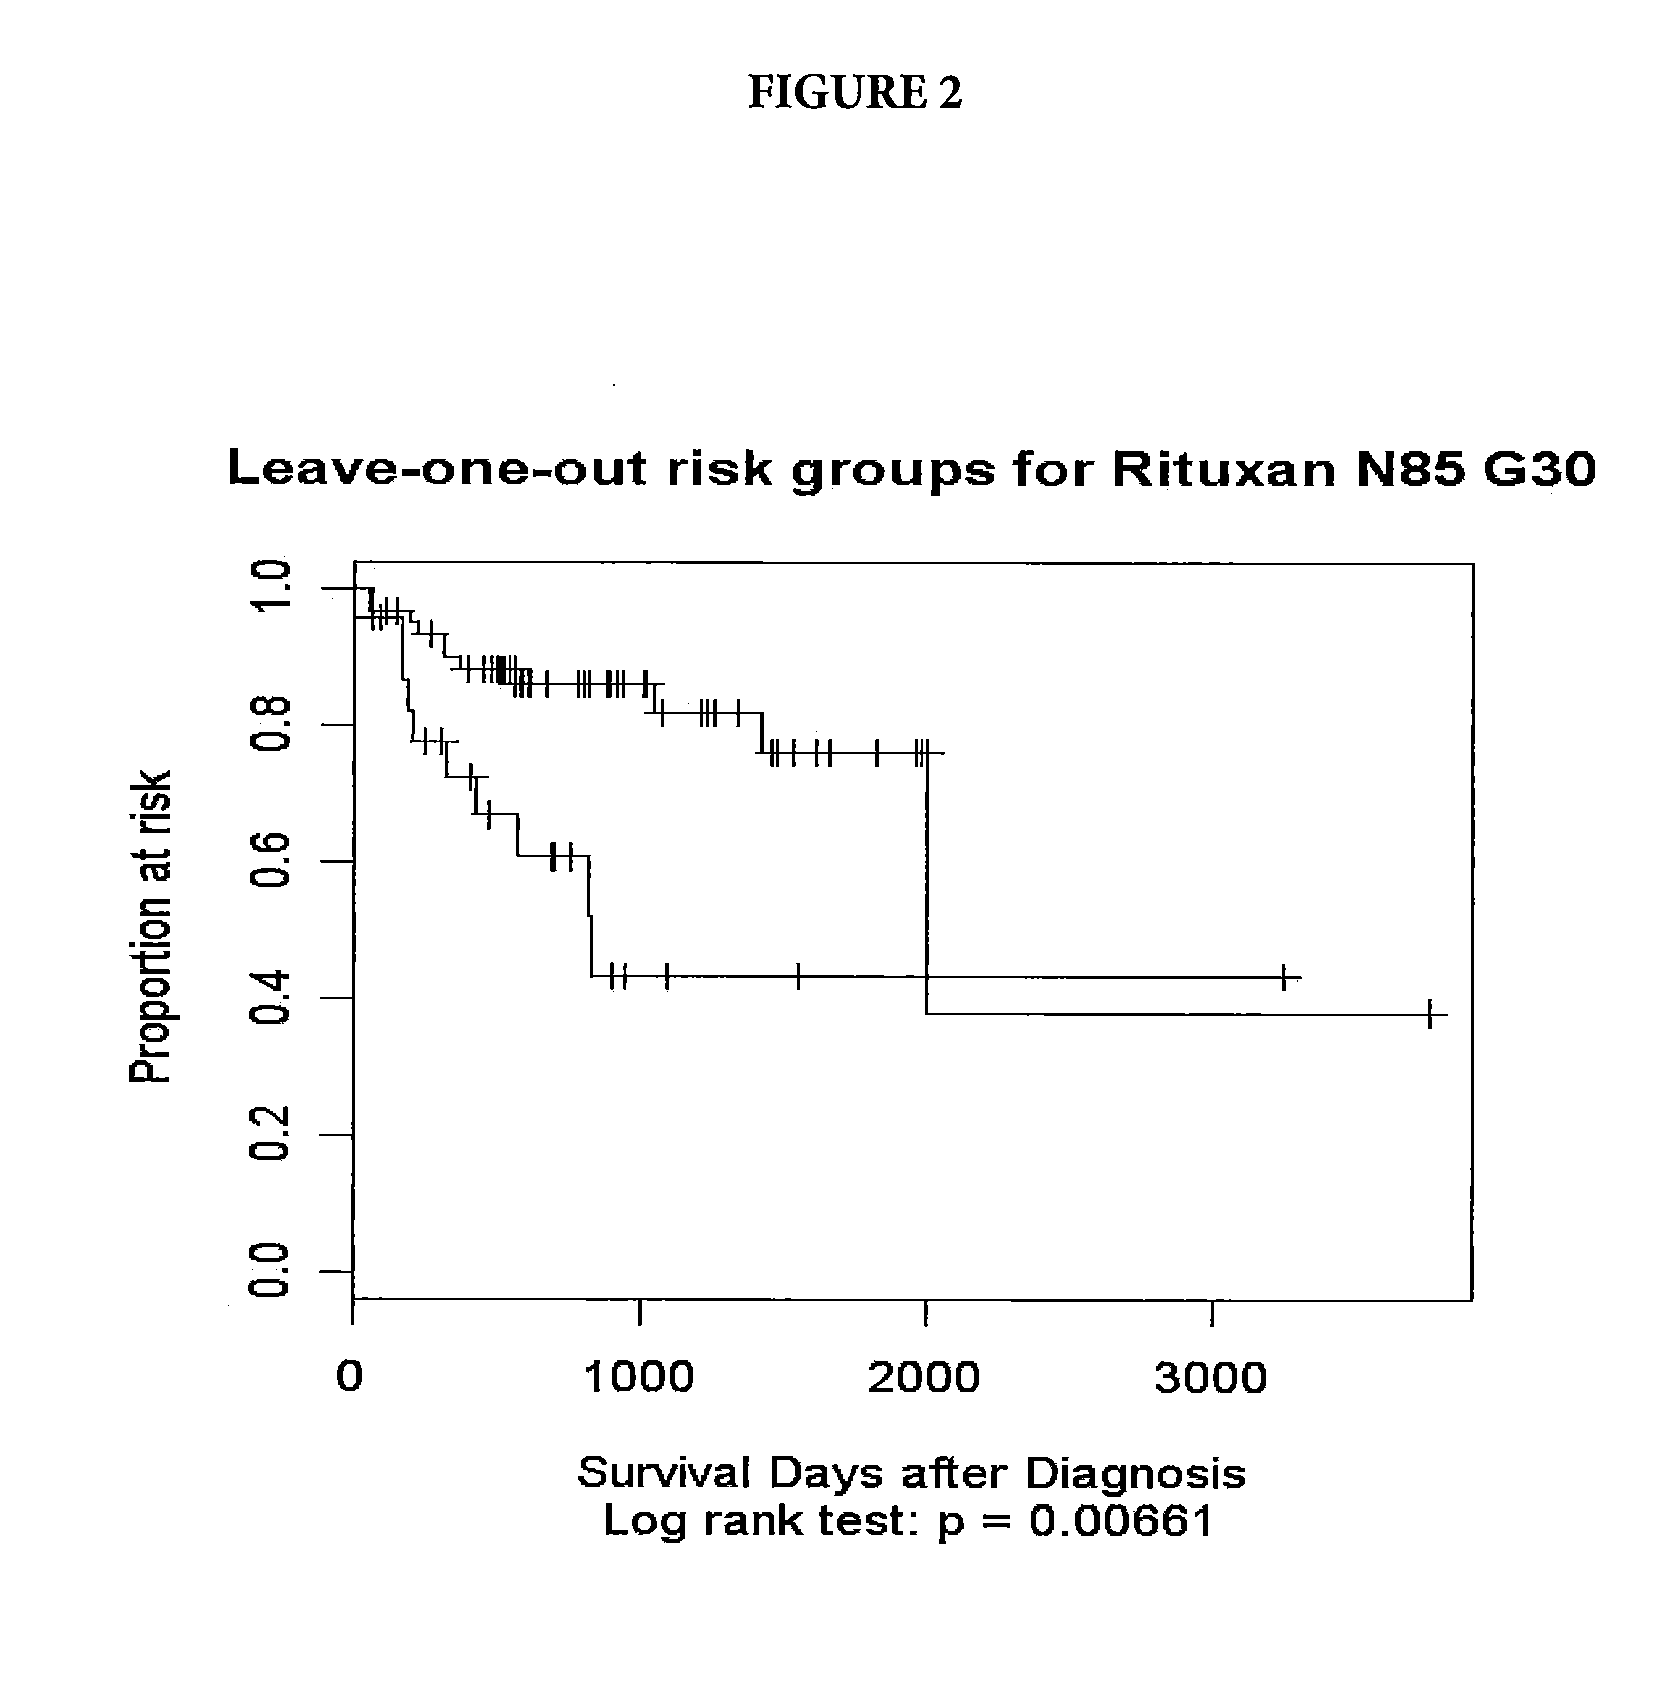
[0047]Tumor samples were obtained from DLBCL patients undergoing therapy with CHOP-R (CHOP in combination with rituximab). For these patients, the three-year survival status has been documented. The samples underwent gene expression profiling through use of an Affymetrix GeneChip® Human Genome U133 Plus 2.0 Array (Affymetrix, Inc. Santa Clara, Calif.). Applying a quality control, samples with low signals or less than 18% present calls (microarray signals) were eliminated. The resulting pool consisted of 85 patients falling into two groups: Group 1—21 long-term survivors, with survival greater than three years (1095 days) and Group 2—19 short term survivors, who died prior the end of three years and 45 patients who dropped out prior to the end of three years.
[0048]The microarray expression data was analyzed using the Cox proportional...
example 2
Selecting Predictive Expression Markers in DLBCL Patients Treated with Rituximab Using the Cox Proportional Hazards Model and Support Vector Machine Method
[0052]Tumor samples were obtained from DLBCL patients undergoing therapy with CHOP and patients undergoing CHOP-R (CHOP in combination with rituximab) therapy. 159 patients for whom the three-year survival status has been documented were selected. Samples from patients who left the study prior to the end of the three year period were not used in this example.
[0053]The 159 samples were randomly split into a training and a testing set in three separate runs as follows: Run 1: 75 training, 84 testing; Run 2: 78 training, 81 testing; Run 3: 83 training, 76 testing. The samples underwent gene expression profiling through use of an Affymetrix GeneChip® Human Genome U133 Plus 2.0 Array.
[0054]The microarray expression data was analyzed using the Cox proportional hazards model. For each gene, the Cox model was used to test association betw...
example 3
Validating the Model on DLBCL Patients Treated with Rituximab
[0058]The method was applied to an independent set of samples: 233 tumor samples from DLBCL patients on the CHOP-R therapy for whom survival data was available. SVM was used to determine the probability of each patient belonging to Group 1 (survival more than three years) or Group 2 (survival less than three years). Samples with low probability of belonging to either group remained unclassified. After the samples were separated into Group 1 and Group 2 using the SVM method, a Kaplan-Meier plot was assembled using the survival information available for each sample (FIG. 5). The middle curve represents the actual survival data for patients predicted to be respondents, while the lower curve represents the actual survival data for the unclassified patients. The upper curve represents the actual survival data for patients predicted to be non-respondents by the method of the present invention. The data does not contradict the te...
PUM
| Property | Measurement | Unit |
|---|---|---|
| time | aaaaa | aaaaa |
| size | aaaaa | aaaaa |
| acid | aaaaa | aaaaa |
Abstract
Description
Claims
Application Information
 - R&D
- Intellectual Property
- Life Sciences
- Materials
- Tech Scout
- Unparalleled Data Quality
- Higher Quality Content
- 60% Fewer Hallucinations
Browse by: Latest US Patents, China's latest patents, Technical Efficacy Thesaurus, Application Domain, Technology Topic, Popular Technical Reports.
© 2025 PatSnap. All rights reserved.Legal|Privacy policy|Modern Slavery Act Transparency Statement|Sitemap|About US| Contact US: help@patsnap.com


