
System and method for the valuation of derivatives

Active Publication Date: 2009-12-08
FINANALYTICA
View PDF7 Cites 44 Cited by
  • Summary
  • Abstract
  • Description
  • Claims
  • Application Information

AI Technical Summary

Benefits of technology

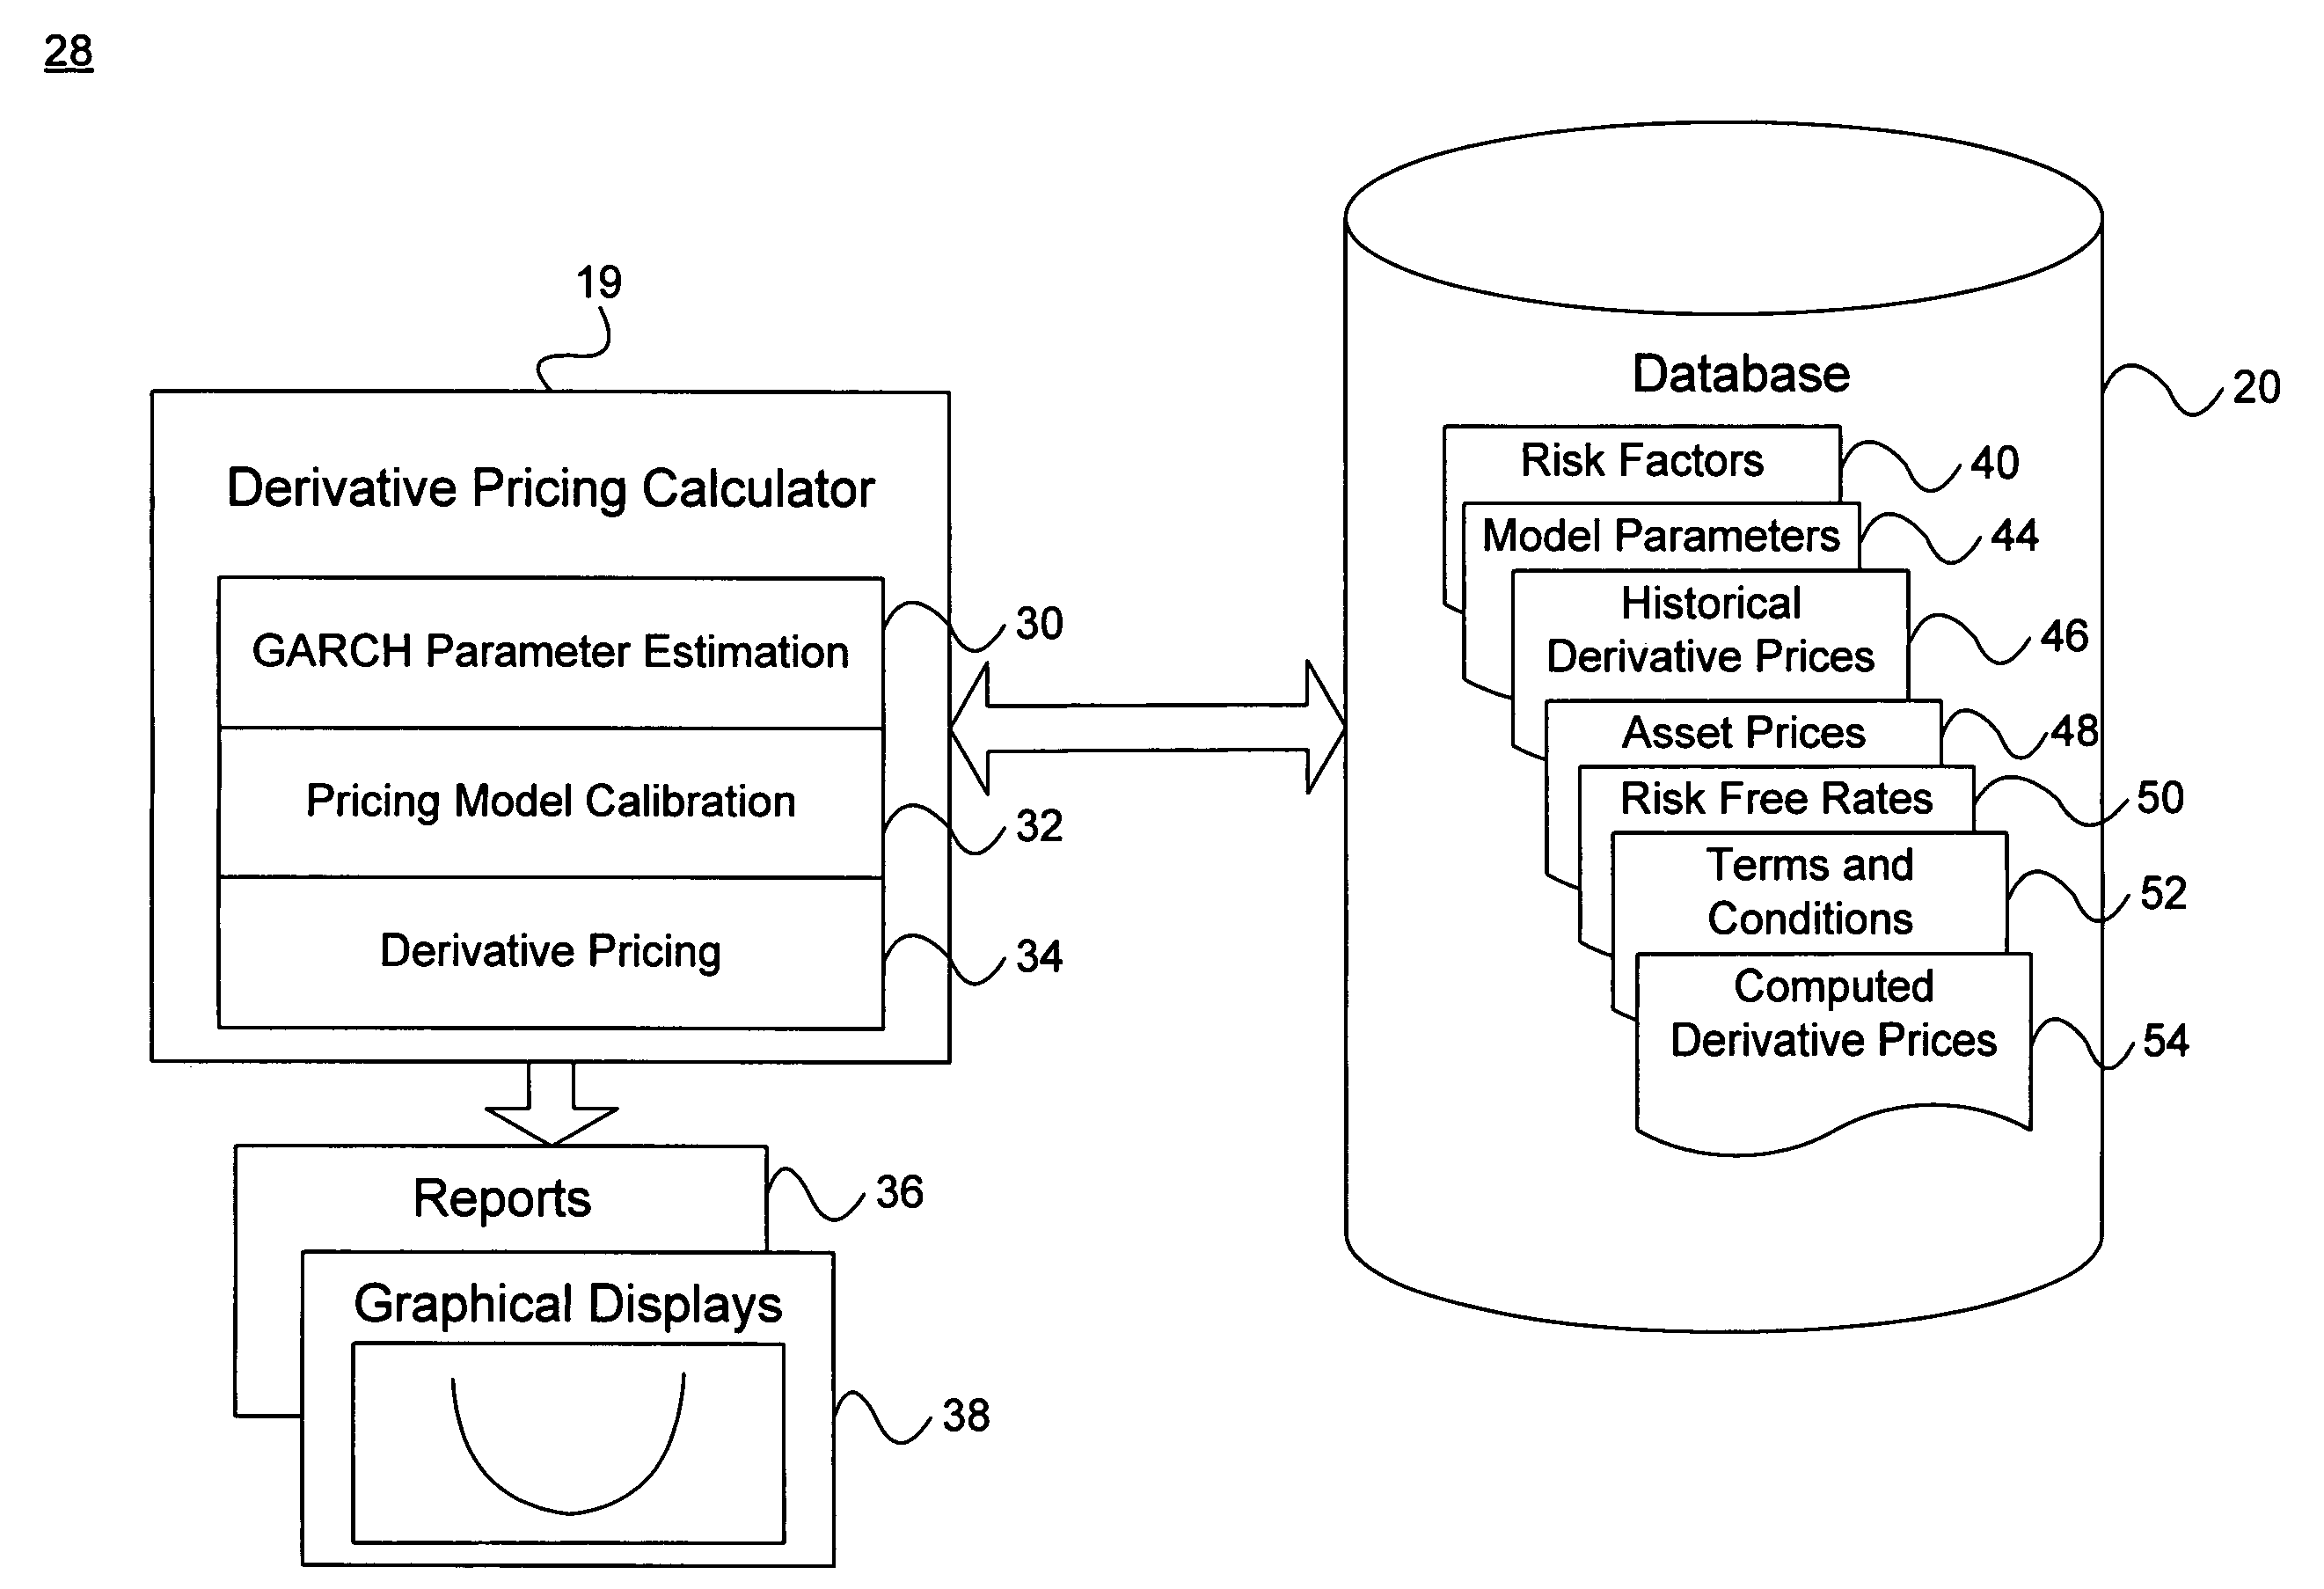
[0010]The drawbacks and limitations of the previous approaches to financial derivative pricing are overcome by the system and method presented in this paper. This system and method achieves maximum statistical reliability, statistical model accuracy, and predictive power to achieve market consistent derivative pricing. The system and method incorporates a unified framework, which provides the required behavior in two respects. First, scenarios for future market prices and value at risk are accurately predicted. Second, arbitrage-free prices of derivatives are produced, in the risk neutral world.
[0017]The use of a multivariate time series model, such as the ARMA-GARCH family, allows for the explanation of key statistical features of returns including, autocorrelation and heteroscedasticity. The STS-distribution offers enough flexibility to describe the leptokurtic or heavy-tailed shape of empirical return distributions, while preserving the essential property of finite second moments of the probability distribution. The use of a copula approach combines modeling flexibility with computational tractability for complex dependency structures. All together the approach leads to a realistic and reliable model to describe the statistical properties of financial risk factors.

Problems solved by technology

As a direct consequence, and at the same time, the main drawback of the calibration framework is that, the market prices cannot be explained, they are just fitted.
However, for exotic derivatives, the prices derived from the implicit models differ substantially, since there is no market data on which to directly calibrate.
Moreover, from an objective viewpoint, there is no way to determine which pricing model is the most reliable one given that the statistical fit to historical realizations of the underlying data is not taken into account.
However, in using these models important aspects of derivative pricing are neglected.
Although members of the ARCH / GARCH-class generate stochastic processes with heavy tailed marginals, the results of applying such processes to the option pricing problem are disappointing in various respects.
In many cases, the predictive value of the model and the quality of the statistical fit are poor, leading to an inability to explain prices of liquid derivatives.
The main drawback of stable non-Gaussian distributions is their infinite variance.

Method used


Image

  • System and method for the valuation of derivatives
  • System and method for the valuation of derivatives
  • System and method for the valuation of derivatives

Examples


example

Modeling Stock / Index Prices

[0062]In this section, the univariate methods used to price a stock option, used in some embodiments, are presented as an example. Some embodiments will have the capabilities to price derivative products with other types of underlying or using the multivariate dependency methodologies discussed previously, and the extensions to these cases should be clearly understood by those skilled in the art.

[0063]The following model is especially defined to meet the needs of modeling stock price changes under the objective probability measure P in the univariate case:

log St−log St-1=rt−dt+λσt−log g(σt)+σtεt  (1.8)

[0064]where rt denotes the risk free rate of return, dt the dividend rate, λ the market price of risk and g the moment generating function of the distribution of ε. As discussed earlier, the volatility is described by a GARCH(p,q) process:

[0065]σt2=α0+∑k=1q⁢⁢αk⁢σt-k2⁢ɛt-k2+∑k=1p⁢⁢βk⁢σt-k2

[0066]It will be known to those skilled in the art that from the theory ...


PUM


Abstract

A system and method for pricing of derivatives is presented. A volatility clustering time series process, including one or more predictive variables, is generated with an innovation process. Marginals of a probability distribution for the time series process follow a smoothly truncated heavy tailed and asymmetric probability distribution. Model parameters for the time series process are calibrated to a set of exogenously provided derivative prices. Pricing of derivatives, including options and swaps, is determined.

Description

CROSS-REFERENCE TO RELATED APPLICATION[0001]This non-provisional patent application claims priority under 35 U.S.C. § 119(e) to U.S. provisional patent application Ser. No. 60 / 663,220, filed Mar. 17, 2005, the disclosure of which is incorporated by reference.FIELD OF THE INVENTION[0002]The system relates to automatic computing methods for the market consistent pricing of financial derivative instruments.BACKGROUND OF THE INVENTION[0003]Stock market crashes like those in October 1987 and October 1997, the turbulent period around the Asian Crisis in 1998 through 1999 or the burst of the “dotcom bubble” together with the extremely volatile period after Sep. 11, 2001 constantly remind financial engineers and risk managers how often extreme events actually happen in real-world financial markets. These observations have led to increased efforts to improve the flexibility and statistical reliability of existing models to capture the dynamics of economic variables.[0004]The history of proba...

Claims


Application Information

Patent Timeline
IPC IPC(8): G06Q40/00
CPCG06Q40/00G06Q40/06G06Q40/04
Inventor RACHEV, SVETLOZAR TODOROVMENN, CHRISTIAN
Owner FINANALYTICA
Learn More