Eureka AIR delivers breakthrough ideas for toughest innovation challenges, trusted by R&D personnel around the world.

Method and system for analyzing and predicting the performance of computer network using time series measurements

a computer network and time series measurement technology, applied in the field of computerized monitoring and modeling systems, can solve problems such as difficult to reliably detect, abnormal system behavior, and relatively erratic operation patterns

Inactive Publication Date: 2007-10-09
NETUITIVE
View PDF20 Cites 81 Cited by
  • Summary
  • Abstract
  • Description
  • Claims
  • Application Information

AI Technical Summary

Benefits of technology

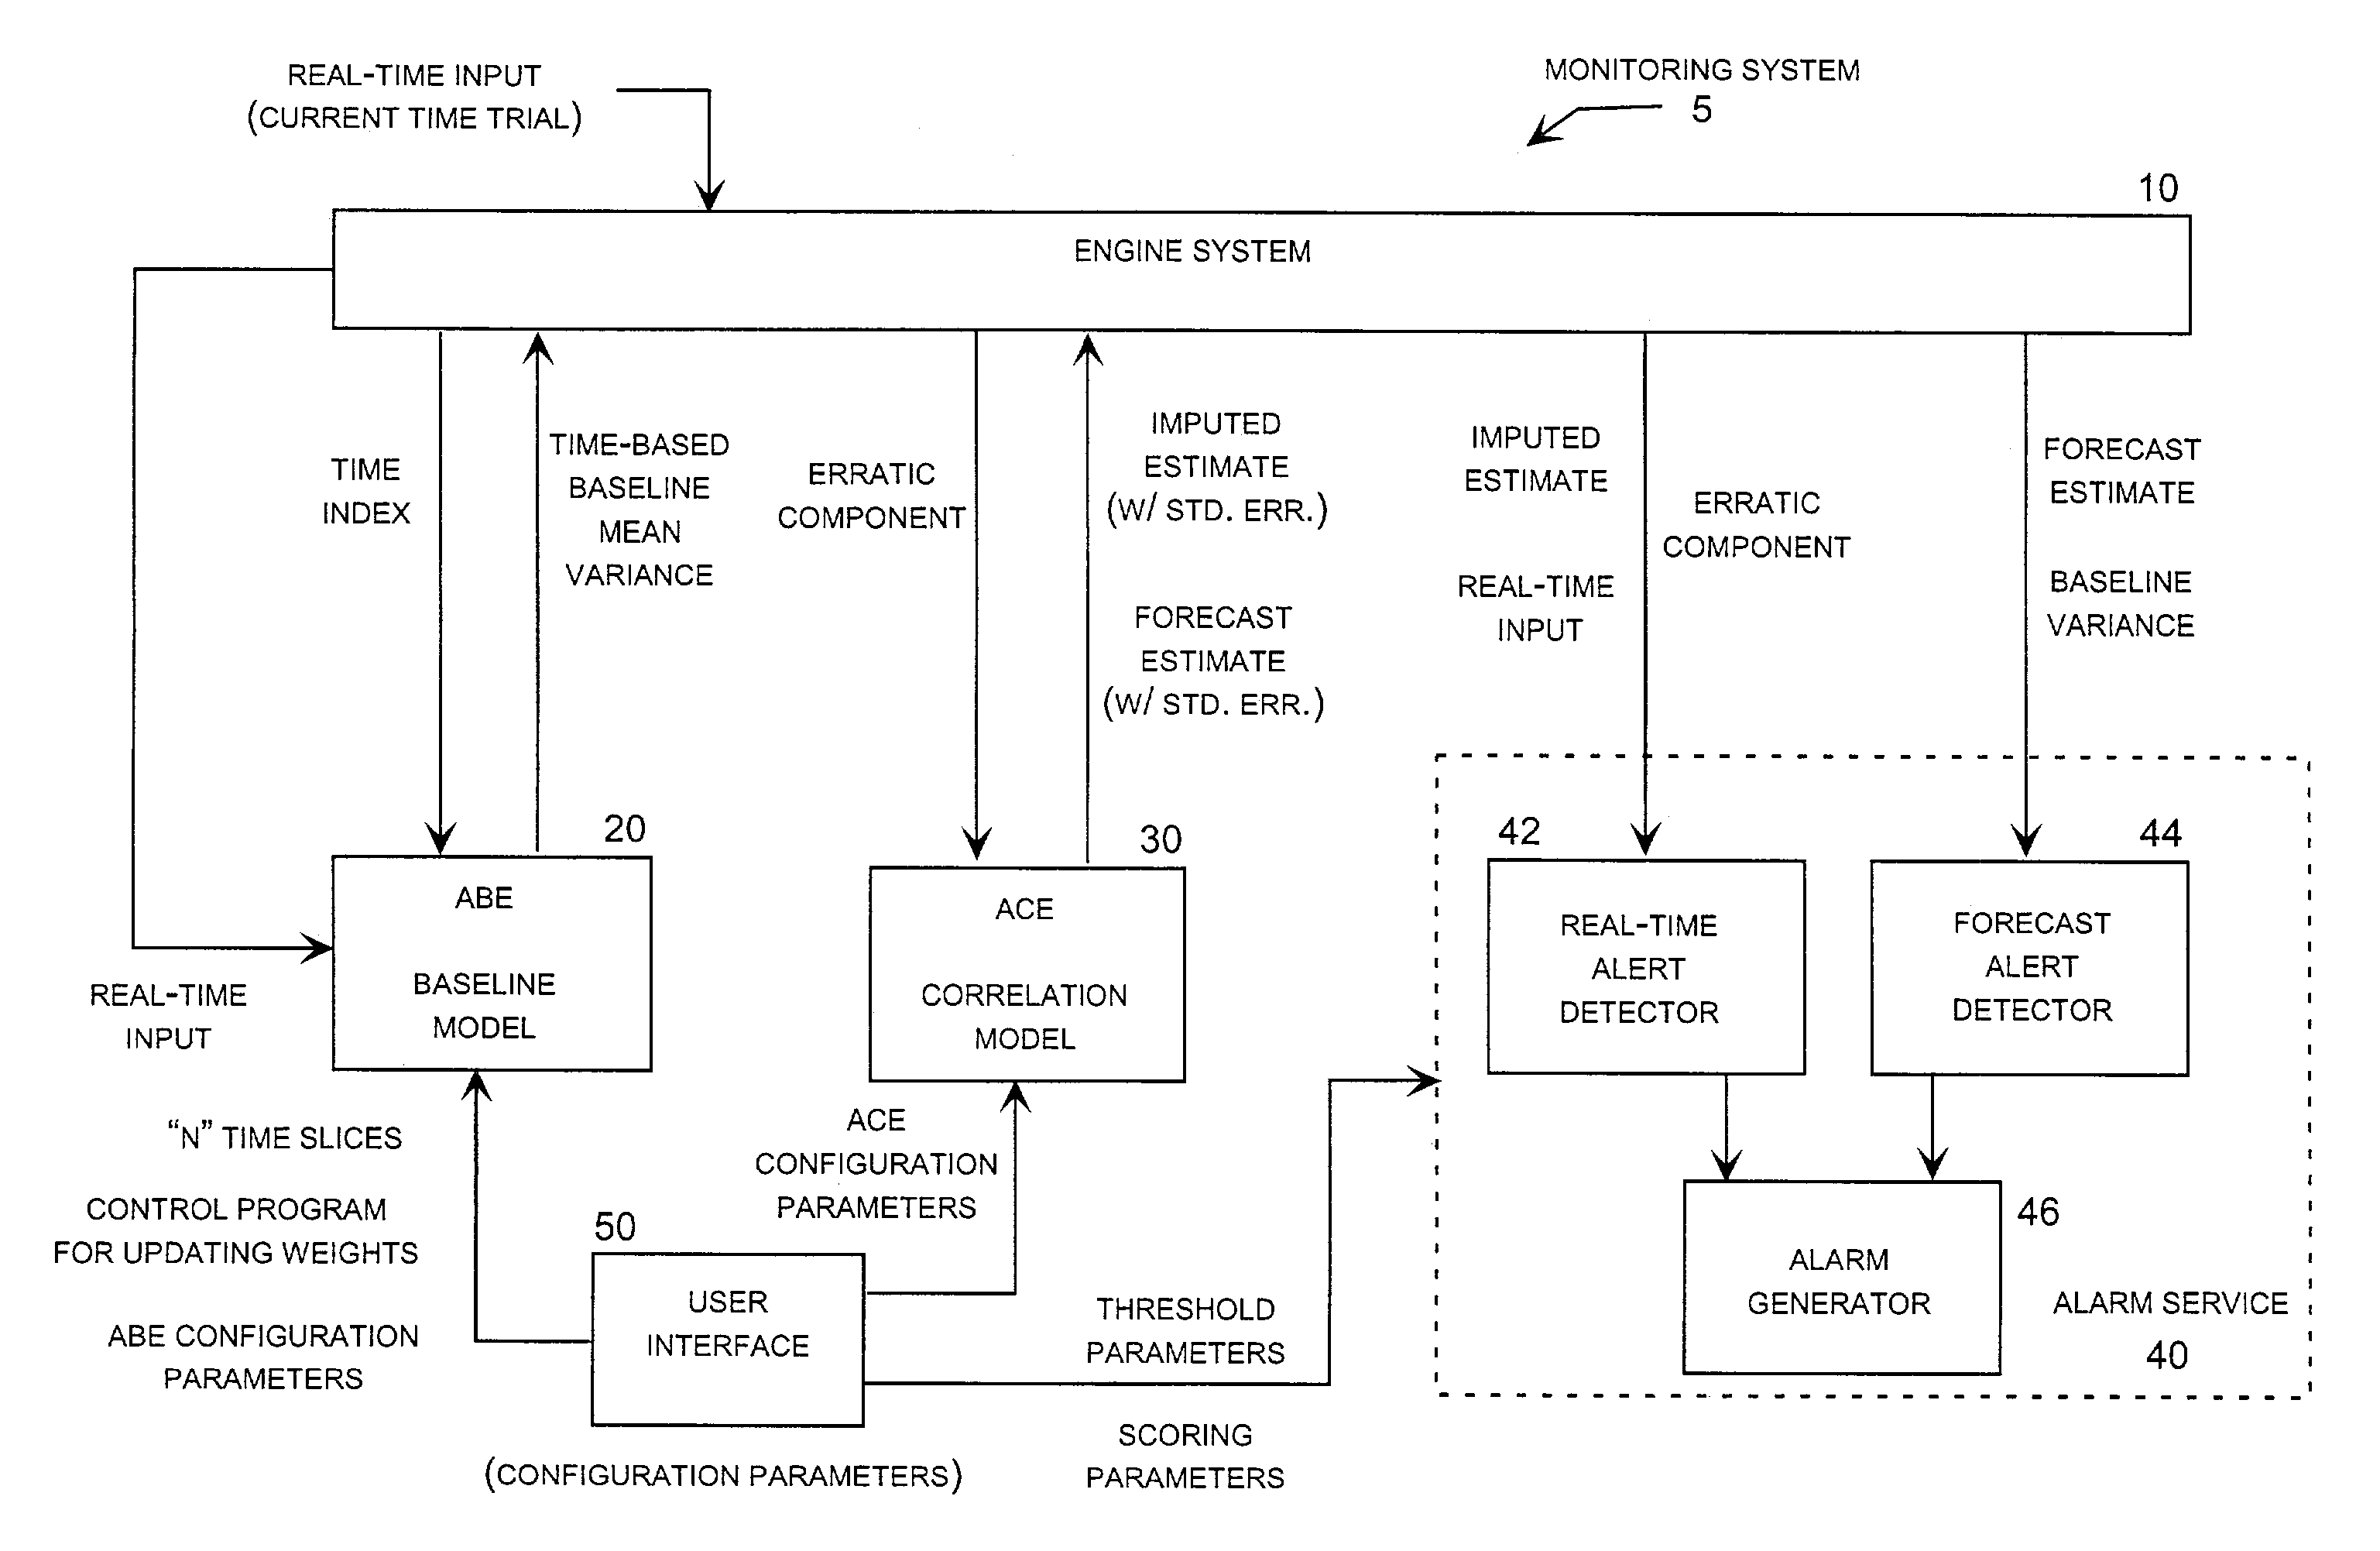
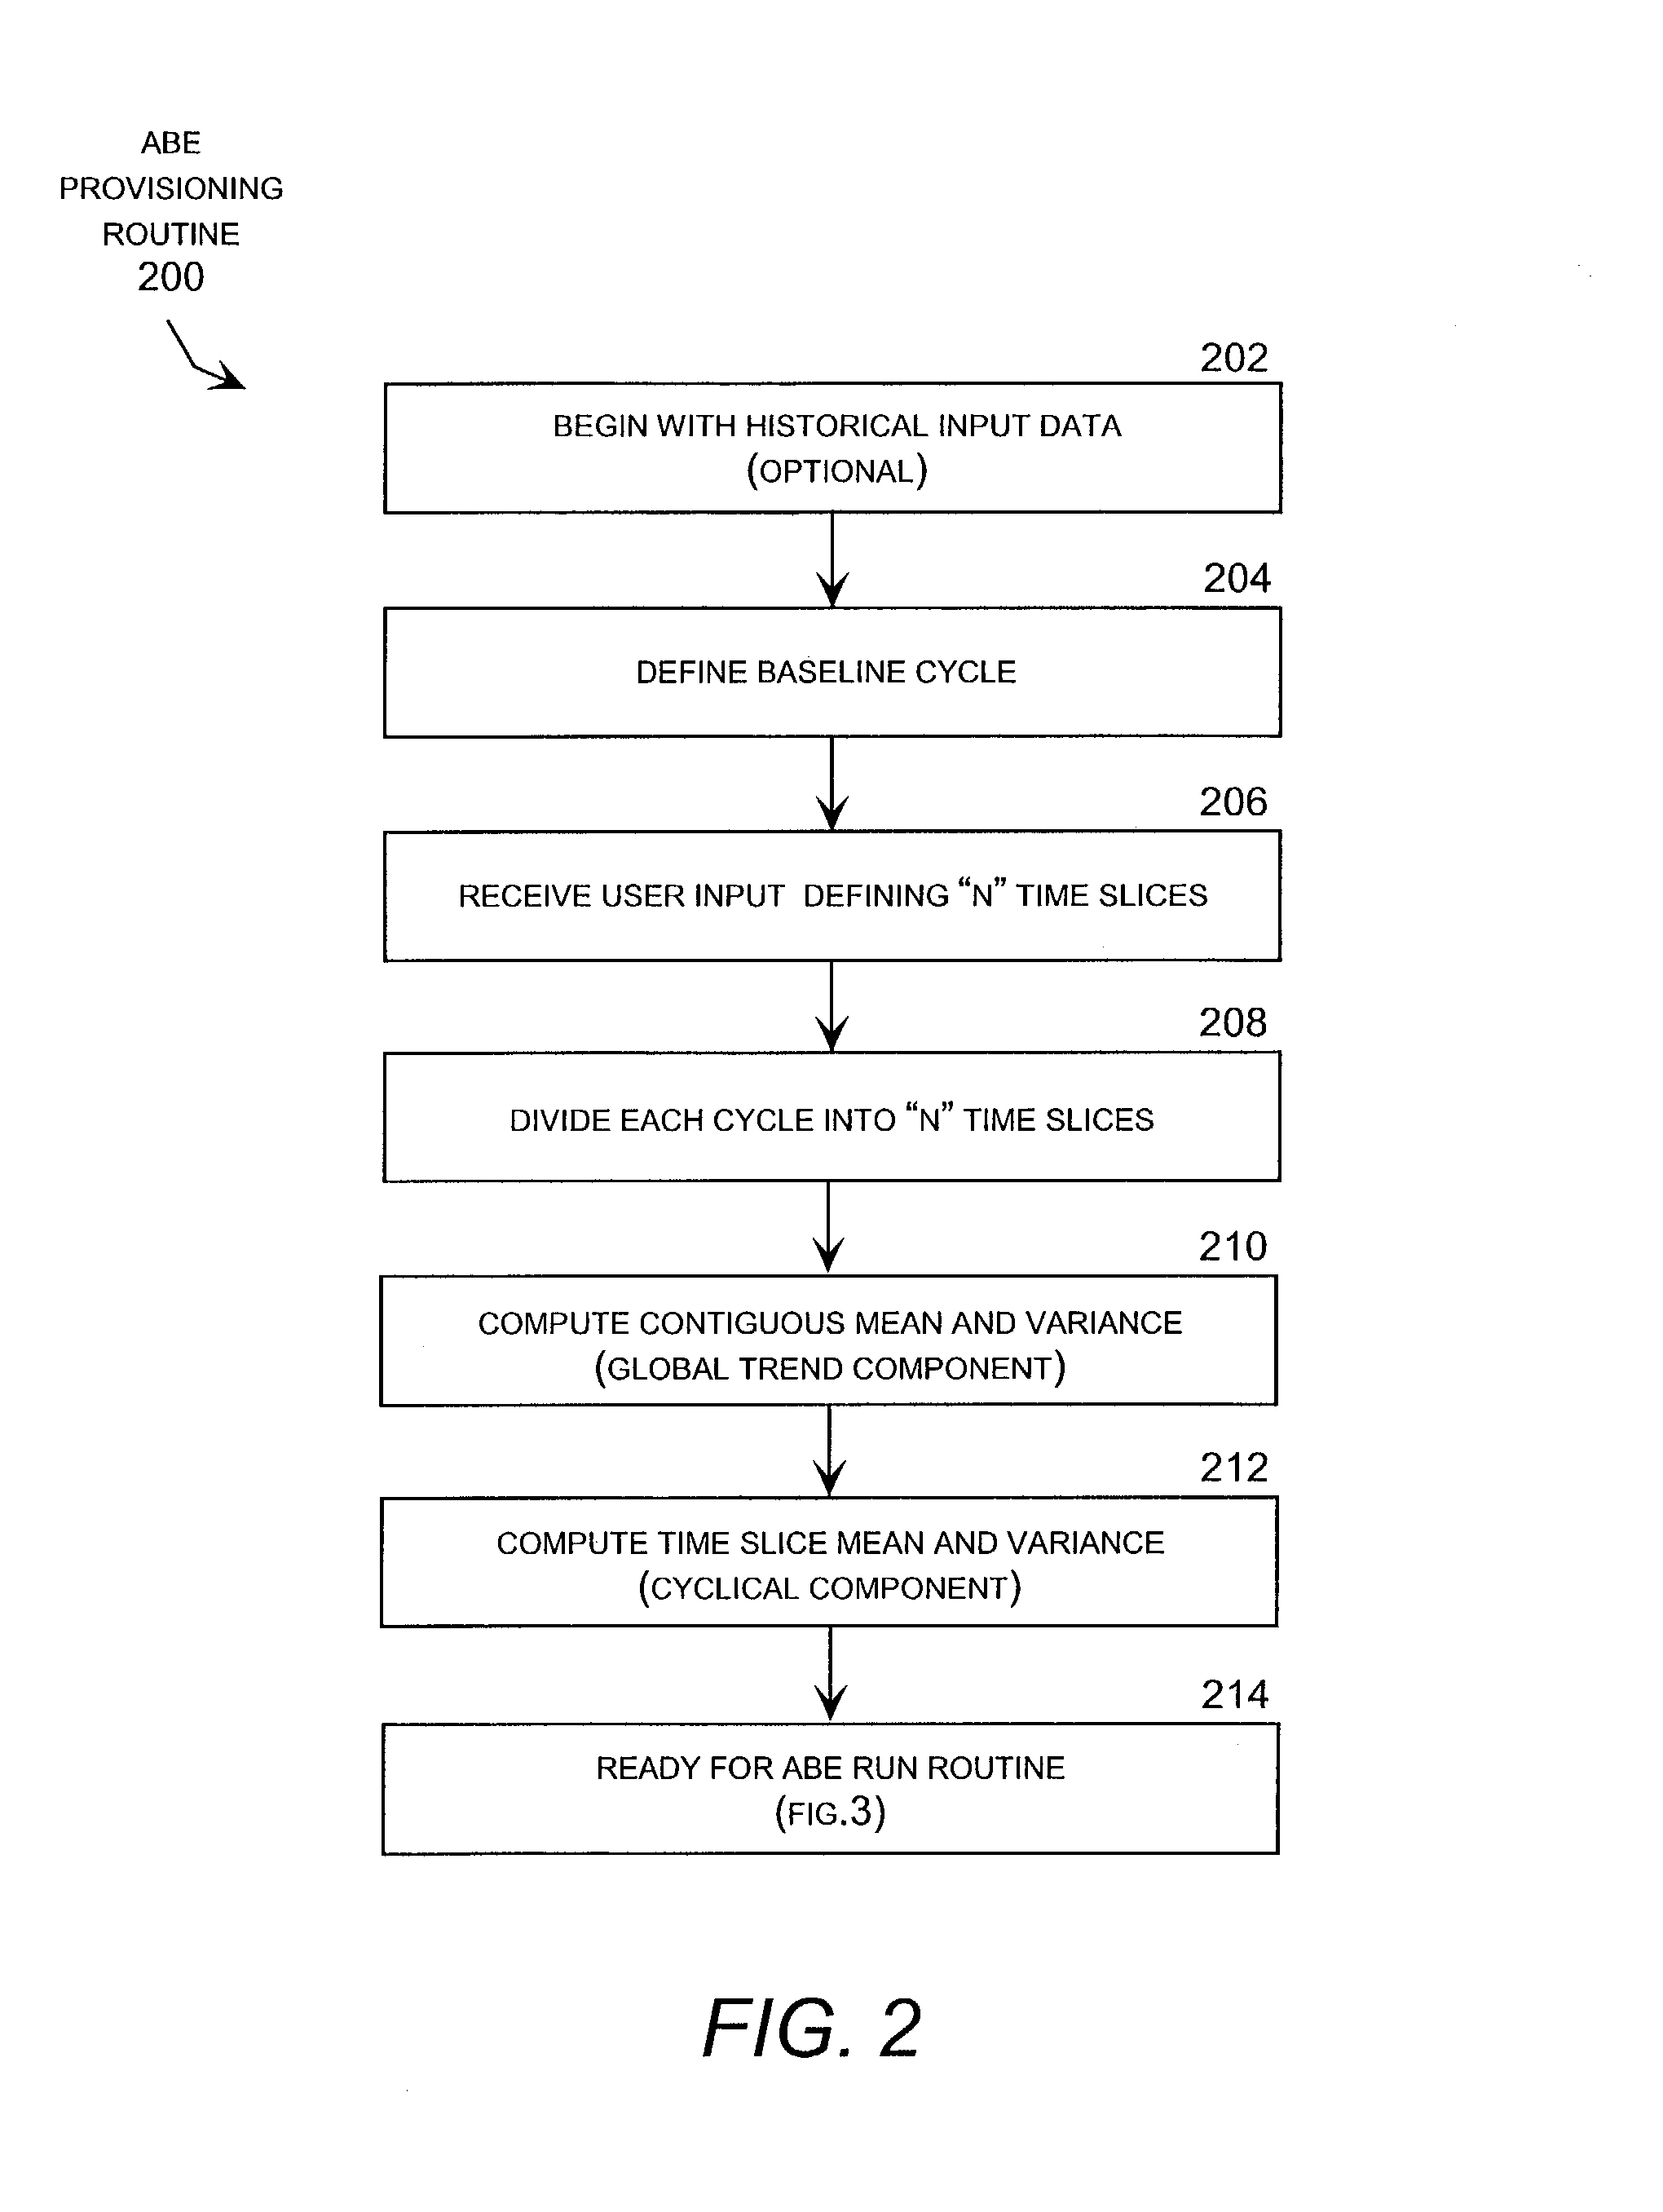
[0012]More specifically, the baseline model automatically captures and updates signatures for multiple input variables representing normal system operation on an on-going basis. Although historical data may be used to initialize the system, this step is optional, and the system may “bootstrap” itself into a working model without the need for extensive analysis of historical data. More importantly, the monitoring system automatically updates the baseline model for each set of data inputs (i.e., each time trial) to continually refine the model while detecting and adapting to changes in the normal system operation that occur over time. The baseline model also tracks and models each input variable individually, and decomposes the signature for each input variable into components that track different characteristics of the variable. For example, each input variable may be modeled by a global trend component, a cyclical component, and a seasonal component. Modeling and continually updating these components separately permits a more accurate identification of the erratic component of the input variable, which typically reflects abnormal patterns when they occur. This improved modeling accuracy allows the system to implement tighter alarm thresholds while maintaining acceptable levels of false alarms.
[0016]The alarm service computes imputed estimate alerts and forecast estimate alerts for each input individually. Typically, these alerts are based on threshold values based on user-defined parameters, which allows the user to tune this aspect of the alarm service for each input variable individually, and for imputed estimate alerts and forecast estimate alerts separately. In addition, the alarm service includes an alarm generator that accumulates and weights the various alerts generated for the various input variables and computes an alarm score based on the overall alert condition. This avoids false alarms from isolated outliers or data errors. These and other advantages of the invention will be readily appreciated by those skilled in the art.

Problems solved by technology

In particular, abnormal system behavior indicative of system problems, such as those caused by individual component overloads and localized equipment or software failures, tend to exhibit relatively erratic operational patterns that are often smaller than the wide fluctuations that occur in the normal usage patterns.
These abnormal operational patterns, which are superimposed on top of normal operational patterns that fluctuate widely and change continuously over time, can be difficult to reliably detect.
For this reason, systems analysts have long been engaged in a continuing challenge to develop increasingly effective ways to reliably detect real abnormal system behavior indicative of system problems while avoiding false alarms based on the normal operational patterns.
A fundamental difficulty in this challenge arises from the fact that abnormal system behavior can sometimes be masked by normal operational patterns, which causes real system problems to go undetected.
Conversely, normal operational patterns can sometimes be misdiagnosed as abnormal system behavior indicative of system problems, which cause false alarms.
Consistently acceptable tuning is not always possible because loosening the alarm thresholds tends to increase the occurrence of real problems that go undetected, whereas tightening the alarm thresholds tends to increase the occurrence of false alarms.
First, historical data is not always available for the monitored system and, even when it is available, the task of developing a predictive function for the normal operational pattern of the system based on historical usage patterns is technically challenging, expensive, and time consuming.
Second, the normal behavior of complex computer networks tends to change over time, which periodically renders the historically-determined predictive functions obsolete.
Combating this problem requires periodic updating of the historical analysis, which adds further cost and complexity to the monitoring system.
Moreover, unpredictable changes in the behavior of the monitored system can still occur, resulting in systemic failure of the monitoring system.
However, these types of systems may encounter problems related to the sensitivity of the updating process.
For example, a predictive function that is updated too quickly can misdiagnose a real system problem as a developing change in the normal system behavior, whereas a predictive function that is updated too slowly can produce false alarms based on legitimate changes in the normal system behavior.
Moreover, the opportunity for truly adaptive monitoring systems to take full advantage of observable patterns in the normal behavior of complex computer networks remains largely unmet for a variety of reasons, including the inherent difficulty of the underlying problem, high data rates in the monitored systems, fast and highly fluctuating changes in normal system behavior, high levels of system complexity, and high levels of sophistication required in the monitoring systems themselves.

Method used


Image

  • Method and system for analyzing and predicting the performance of computer network using time series measurements
  • Method and system for analyzing and predicting the performance of computer network using time series measurements
  • Method and system for analyzing and predicting the performance of computer network using time series measurements

Examples


Embodiment Construction

[0040]The present invention may be embodied in a system intended to address the task of modeling, estimating, predicting and detecting abnormal behavior in systems that exhibit unpredictable abnormal events superimposed on top of rapidly fluctuating and continuously changing normally operational patterns. As noted above, this system will be referred to as a “monitoring system” for descriptive convenience. However, it should be understood that it may perform additional functions, such as predicting abnormal system behavior, activating alerts and alarms based on detected or predicted system problems, implementing response actions to detected system problems, accumulating descriptive statistics, implementing user-defined system tuning, and so forth.

[0041]Although the embodiments of the invention described below are tailored to operate as a monitoring system for a complex computer network or server system, it should be understood that the monitoring system may be used for any of a wide ...


PUM


Abstract

A monitoring system including a baseline model that automatically captures and models normal system behavior, a correlation model that employs multivariate autoregression analysis to detect abnormal system behavior, and an alarm service that weights and scores a variety of alerts to determine an alarm status and implement appropriate response actions. The baseline model decomposes the input variables into a number of components representing relatively predictable behaviors so that the erratic component e(t) may be isolated for further processing. These components include a global trend component, a cyclical component, and a seasonal component. Modeling and continually updating these components separately permits a more accurate identification of the erratic component of the input variable, which typically reflects abnormal patterns when they occur.

Description

REFERENCED TO RELATED APPLICATIONS[0001]This application claims priority to commonly-owned U.S. Provisional Patent Application Ser. No. 60 / 342,312 filed on Dec. 19, 2001, which is hereby incorporated by reference. This application also incorporates by reference the disclosures of the following commonly-owned patents and patent applications: U.S. Pat. Nos. 5,835,902; 6,216,119; 6,289,330; 6,876,988; and co-pending U.S. patent application Ser. No. 10 / 165,232.TECHNICAL FIELD[0002]This invention relates to computerized monitoring and modeling systems and, more specifically, relates to a method and system for modeling, estimating, predicting, and detecting abnormal behavior in systems, such as complex computer networks, servers, and other computer-based systems.BACKGROUND OF THE INVENTION[0003]Many systems, and in particular complex computer networks, exhibit operational patterns that include broad trends that evolve gradually, cyclical components that fluctuate widely on a largely predi...

Claims


Application Information

Patent Timeline
IPC IPC(8): G06E1/00G06F11/30G06F11/32G06F11/34
CPCG06F11/3006G06F11/3055G06F11/3082G06F11/3452G06F11/327G06F11/3447G06F11/3476G06F2201/81
Inventor HELSPER, DAVIDHUARD, JEAN-FRANCOISHOMOKI, DAVIDRASMUSSEN, AMANDAJANNARONE, ROBERT
Owner NETUITIVE
Why Eureka
Eureka Blog
Learn More