
Method and system for automatically interpreting computer system performance measurements

a computer system and performance measurement technology, applied in the field of analysis of computer system performance, can solve the problems of not easy for human users to interpret, the maximum performance of modern computer operating systems has been achieved, and the effort has been put into achieving the maximum performance of a system

Inactive Publication Date: 2006-03-21
INTEL CORP
View PDF12 Cites 20 Cited by
  • Summary
  • Abstract
  • Description
  • Claims
  • Application Information

AI Technical Summary

Benefits of technology

[0032]Insights, advice, and behaviors can all be fuzzy properties (that is, there is a score associated with each), which makes it possible to generate visualizations of the changes in these scores across a contextual dimension like time. For example, generating a visualization that graphs the score of the insights “L1 data cache bottleneck” against time makes it possible for the user to quickly understand the relative severity at different times, and to relate this to what other system functions are occurring at the same time. This feature (visualizing performance problem hotspots) can complement any existing hotspot-tracking visualization features, which in conventional systems only allow the user to visualize counter hotspots and counter ratio hotspots. The visualization can be in the form of a graph of the scores of insights plotted against the associated regions of code, as defined by the instruction pointer or by some other user defined metric.

Problems solved by technology

Modern computer operating systems have become quite capable and equally complex, with a great deal of interdependency between the various resources that are managed by the operating system.
As a result, much effort has been put into getting the maximum performance out of a system by monitoring the system and adjusting various parameters to improve the performance parameters that are considered most important in that particular system.
Unfortunately, many analysis systems present their results in ways that are not easy for the human user to interpret.
Also, many such systems do not allow the user to supplement the database with “knowledge plug-ins”, or supplemental knowledge, to encapsulate performance tuning expertise for specific problem domains like database tuning, graphics tuning, etc., or to upgrade the existing tuning system as relevant knowledge evolves.
Because of these shortcomings, only experienced system tuners are able to make full use of such performance tuning systems, and many software developers do not fully benefit from such tools.

Method used


Image

  • Method and system for automatically interpreting computer system performance measurements
  • Method and system for automatically interpreting computer system performance measurements
  • Method and system for automatically interpreting computer system performance measurements

Examples


Embodiment Construction

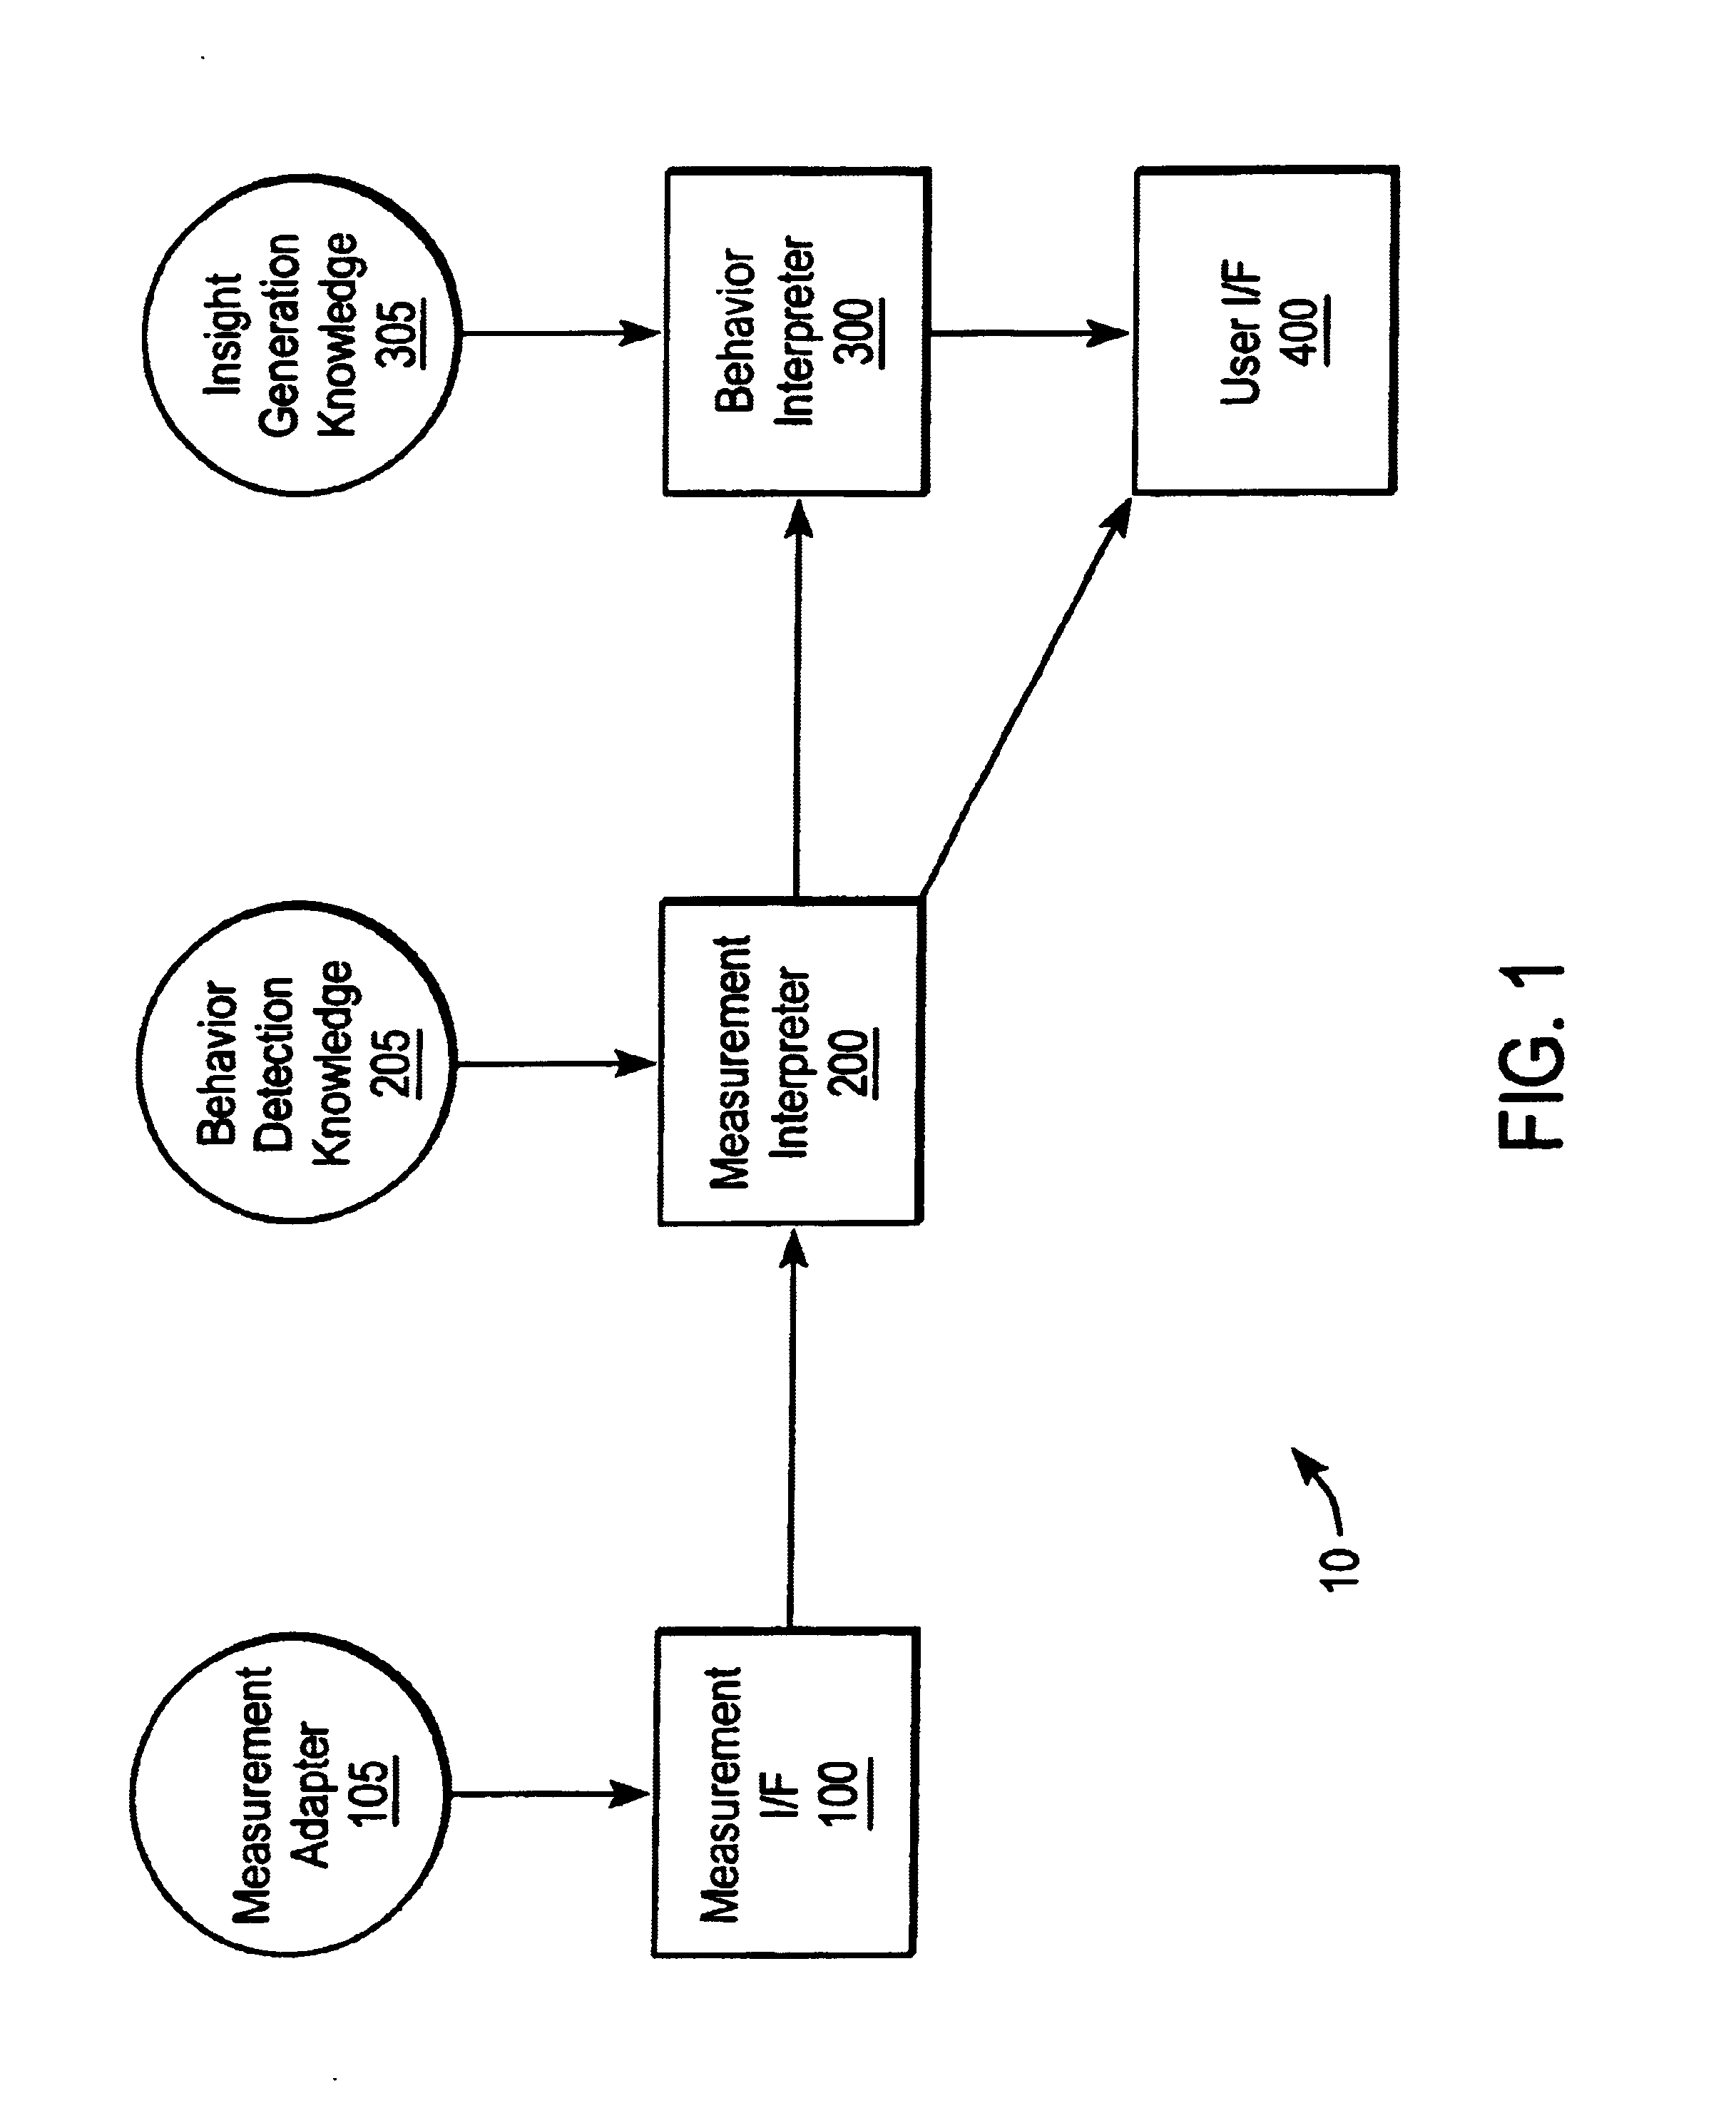
[0013]The invention adds functionality and ease-of-use to conventional computer tuning systems. The invention uses qualitative descriptions such as ‘high’, ‘low’, ‘excessive’, etc., to describe quantitative measurements, and uses these qualitative descriptions to generate insights / advice and present them to the user. In particular, the invention can include such things as: 1) user extensibility, 2) insights based on behavioral properties, 3) visualization of performance insights across measurement context dimensions such as time, 4) explanation of insights based on the same encoded knowledge data that is used to generate the insights, and 5) use of the abstraction of fuzzy subsystem behavioral properties to simplify knowledge development and insight explanation, and to permit portability of the tuning system by permitting threshold values to be adjusted without affecting other areas of the database.

[0014]It is helpful to define some of the terms used in this description, and provide...


PUM


Abstract

An improvement in applying and interpreting encoded knowledge about computer system performance engineering and in enabling a user to more readily understand and apply that knowledge to improve computer system performance. Textual and graphical depictions of insights, advice, behaviors, and explanations can be presented, all related to improving computer system performance. Fuzzy logic can be employed to accommodate incomplete measurement data and to present results in a qualitative format, presenting relevant data as being high, low, substantial, etc., rather than simply presenting the values of the associated counters leading to those determinations. Intermediate values used to generate the results can also be processed with qualitative rather than quantitative values.

Description

BACKGROUND OF THE INVENTION[0001]1. Field of the Invention[0002]The invention pertains generally to analyzing computer system performance. In particular, it pertains to expert systems for interpreting computer system performance measurements.[0003]2. Description of the Related Art[0004]Modern computer operating systems have become quite capable and equally complex, with a great deal of interdependency between the various resources that are managed by the operating system. Such resource management can include task priority, the allocation of memory, distribution of programs and data between disk / main memory / cache, spooling, and many others. As a result, much effort has been put into getting the maximum performance out of a system by monitoring the system and adjusting various parameters to improve the performance parameters that are considered most important in that particular system. In a related activity, application developers conduct similar optimization efforts to maximize perfo...

Claims


Application Information

Patent Timeline
IPC IPC(8): G06F11/00G06F11/30
CPCG06F11/2257G06F11/3612G06F11/3409G06F2201/88G06F11/3447
Inventor GOTWALS, JACOB K.GARG, NEERAJ
Owner INTEL CORP
Learn More