System for transmitting optical data
- Summary
- Abstract
- Description
- Claims
- Application Information
AI Technical Summary
Benefits of technology
Problems solved by technology
Method used
Image
Examples
Embodiment Construction
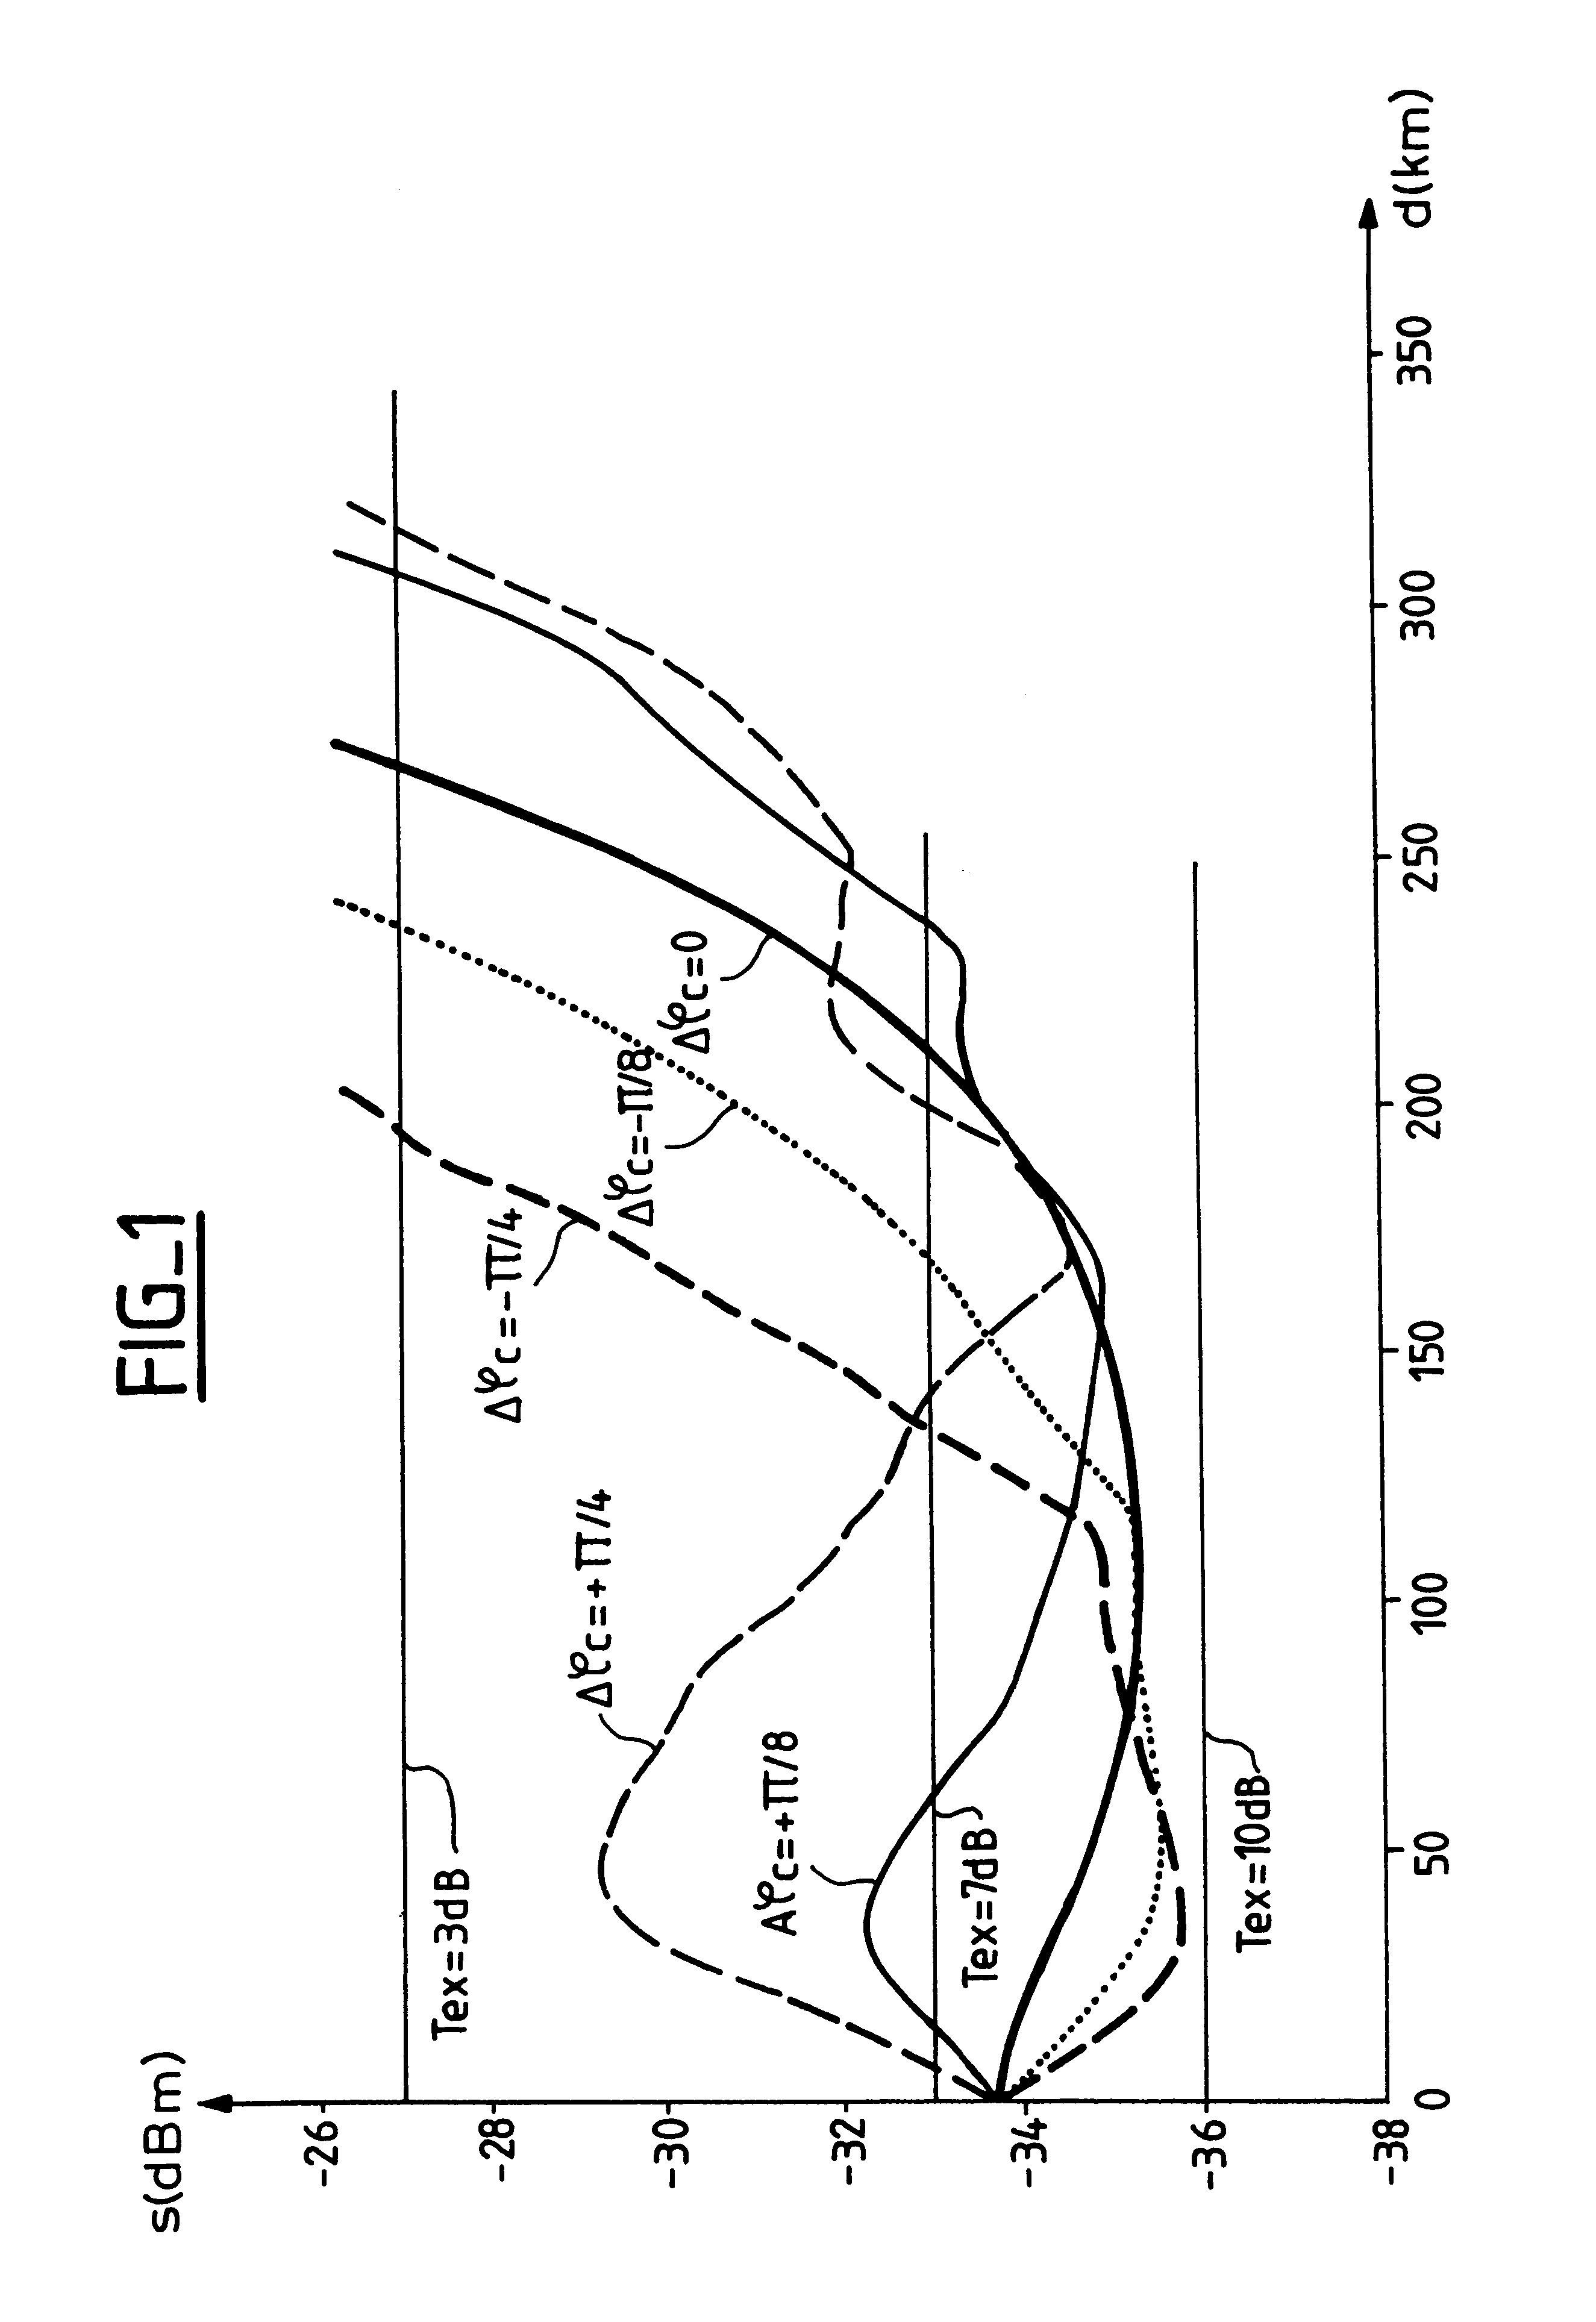
The curves in FIG. 1 represent the sensitivity s of a receiver as a function of the propagation distance d on standard fiber using PSBT modulation at 10 Gbit / s and for various transient "chirp" values. The curves are for links without amplifiers.
Sensitivity, which constitutes an indication of transmission quality, is here defined as the minimum value of the average received optical power (in dBm) to obtain a bit error rate of 10.sup.-9 at the receiving end.
Each curve corresponds to a transient "chirp" value here characterized by the value of the phase shift .DELTA..phi.c introduced at each transition of the optical power level of the transmitted signal. For example, the thick continuous line curve corresponds to .DELTA..phi.c=0, i.e. to pure PSBT modulation.
Note in particular that a negative phase shift .DELTA..phi.c in the range -.pi. / 8 to -.pi. / 4 is beneficial for transmission for distances less than 70 km while a positive phase shift in the range +.pi. / 8 to +.pi. / 4 is beneficial ...
PUM
 Abstract
Description
Claims
Application Information
 - R&D
- Intellectual Property
- Life Sciences
- Materials
- Tech Scout
- Unparalleled Data Quality
- Higher Quality Content
- 60% Fewer Hallucinations
Browse by: Latest US Patents, China's latest patents, Technical Efficacy Thesaurus, Application Domain, Technology Topic, Popular Technical Reports.
© 2025 PatSnap. All rights reserved.Legal|Privacy policy|Modern Slavery Act Transparency Statement|Sitemap|About US| Contact US: help@patsnap.com


