Graphic user interface for database system

Inactive Publication Date: 2001-12-04
ZARBANA DIGITAL FUND
View PDF10 Cites 442 Cited by
  • Summary
  • Abstract
  • Description
  • Claims
  • Application Information

AI Technical Summary

Benefits of technology

The present invention therefore addresses these problems, and provides other advantages, through a new type of system for dealing with data sets graphically at a user, rather than programmer, level. As envisioned by the present invention, sets of data within a data space are represented graphically. In general, the data set represented by the graphic representation are defined by a rule or set of rules. However, a particular advantage of the present invention is that a plurality of these graphic representations, each representing a different data set defined by a different rule or set of rules, may be defined and depicted on the interface, either discretely, sequentially or simultaneously. Typically, a user will seek to use the database system to help define an optimal resulting data subset, wherein the rule or rules defining that data set are unknown at the outset or are inefficiently defined as a single consolidated set of rules. Thus, by defining a group of less complex rule sets, and then consolidating the rule sets, the desired information may be analyzed and extracted.
is that a plurality of these graphic representations, each representing a different data set defined by a different rule or set of rules, may be defined and depicted on the interface, either discretely, sequentially or simultaneously. Typically, a user will seek to use the database system to help define an optimal resulting data subset, wherein the rule or rules defining that data set are unknown at the outset or are inefficiently defined as a single consolidated set of rules. Thus, by defining a group of less complex rule sets, and then consolidating the rule sets, the desired information may be analyzed and extracted.
One aspect of the present system therefore presents a basic or generic icon, defining a plurality of logical data regions representing a Boolean relationship of two or more data sets. For simplicity, the majority of the present description will focus on the relationship of two sets, with the extensions to the representation of three or more sets as known in the art.
In a preferred embodiment, a generic icon is provided as a Venn diagram icon, divided into four set spaces, with two intersecting circles in a rectangular box. The space within each circle and not intersecting defining two set spaces, the intersection defining a third set space, and the external area defining a fourth set space. These set spaces are independently selectable, defining the various binary operators of the elements of sets A and B, in groups of up to four spaces, as shown in FIG. 6:
In this system, a generic graphic icon is defined having a boundary and two intersecting areas in the boundary, each area representing a data set, an intersecting portion of the areas representing a conjunction of the data sets. The generic icon thus has four discrete regions, the portion outside the union of the areas, an intersecting portion of the areas, and portions within one area and not within the other area. A selection of one or more regions within the boundary is received from the user to define an output data set and presenting the generic graphic icon on the GUI as a first modified graphic icon, having visual indication of the selected regions corresponding to the defined output set. In addition, a set inclusion property is defined to correspond to each data set for the first modified graphic icon. These graphic icons may be selected from a pick list or tool bar or generated from a template generic icon. For example, commonly used relationships may be provided on a tool bar, with all possibilities available by manipulation of a generic icon template, in which selected regions are altered, e.g., change color. The icon may then be used in a larger graphic representation of a complex logical definition, by chaining or linking a plurality of icons together. This chaining or linking process is generally by graphic connector lines which connect the inputs and outputs of the iconic representation. These connector lines may be smart, i.e., intelligently routed, spaced and sized in accordance with the overall search strategy, graphic presentation and page or presentation layout.
A preferred Venn diagram icon according to the present invention includes a rectangular box with two overlapping circles staggered symmetrically along the elongated axis. Each circle is connected to a line intersecting a side of the box, either spaced through an elongated side or through opposite short sides, from the outside. A third line emanates from an elongated side of the box, opposite the inputs if these pass through an elongated side. Each line may be provided with an arrowhead to indicate the nature of the line as generally being considered an input or an output, with an arrowhead pointing inward for an input and outward for an output. The circle closest to each line corresponds to that line. The standard Venn diagram notation is employed, e.g., a change in color or density of a circle to represent selection of a particular set, with each graphic region representing a different subset of the data space.

Problems solved by technology

In general, however, the user does not operate to modify the icon itself with a corresponding function executed by the operating system or application.
These systems do not, however, provide a generic icon which is modified to reflect a data subset employed.
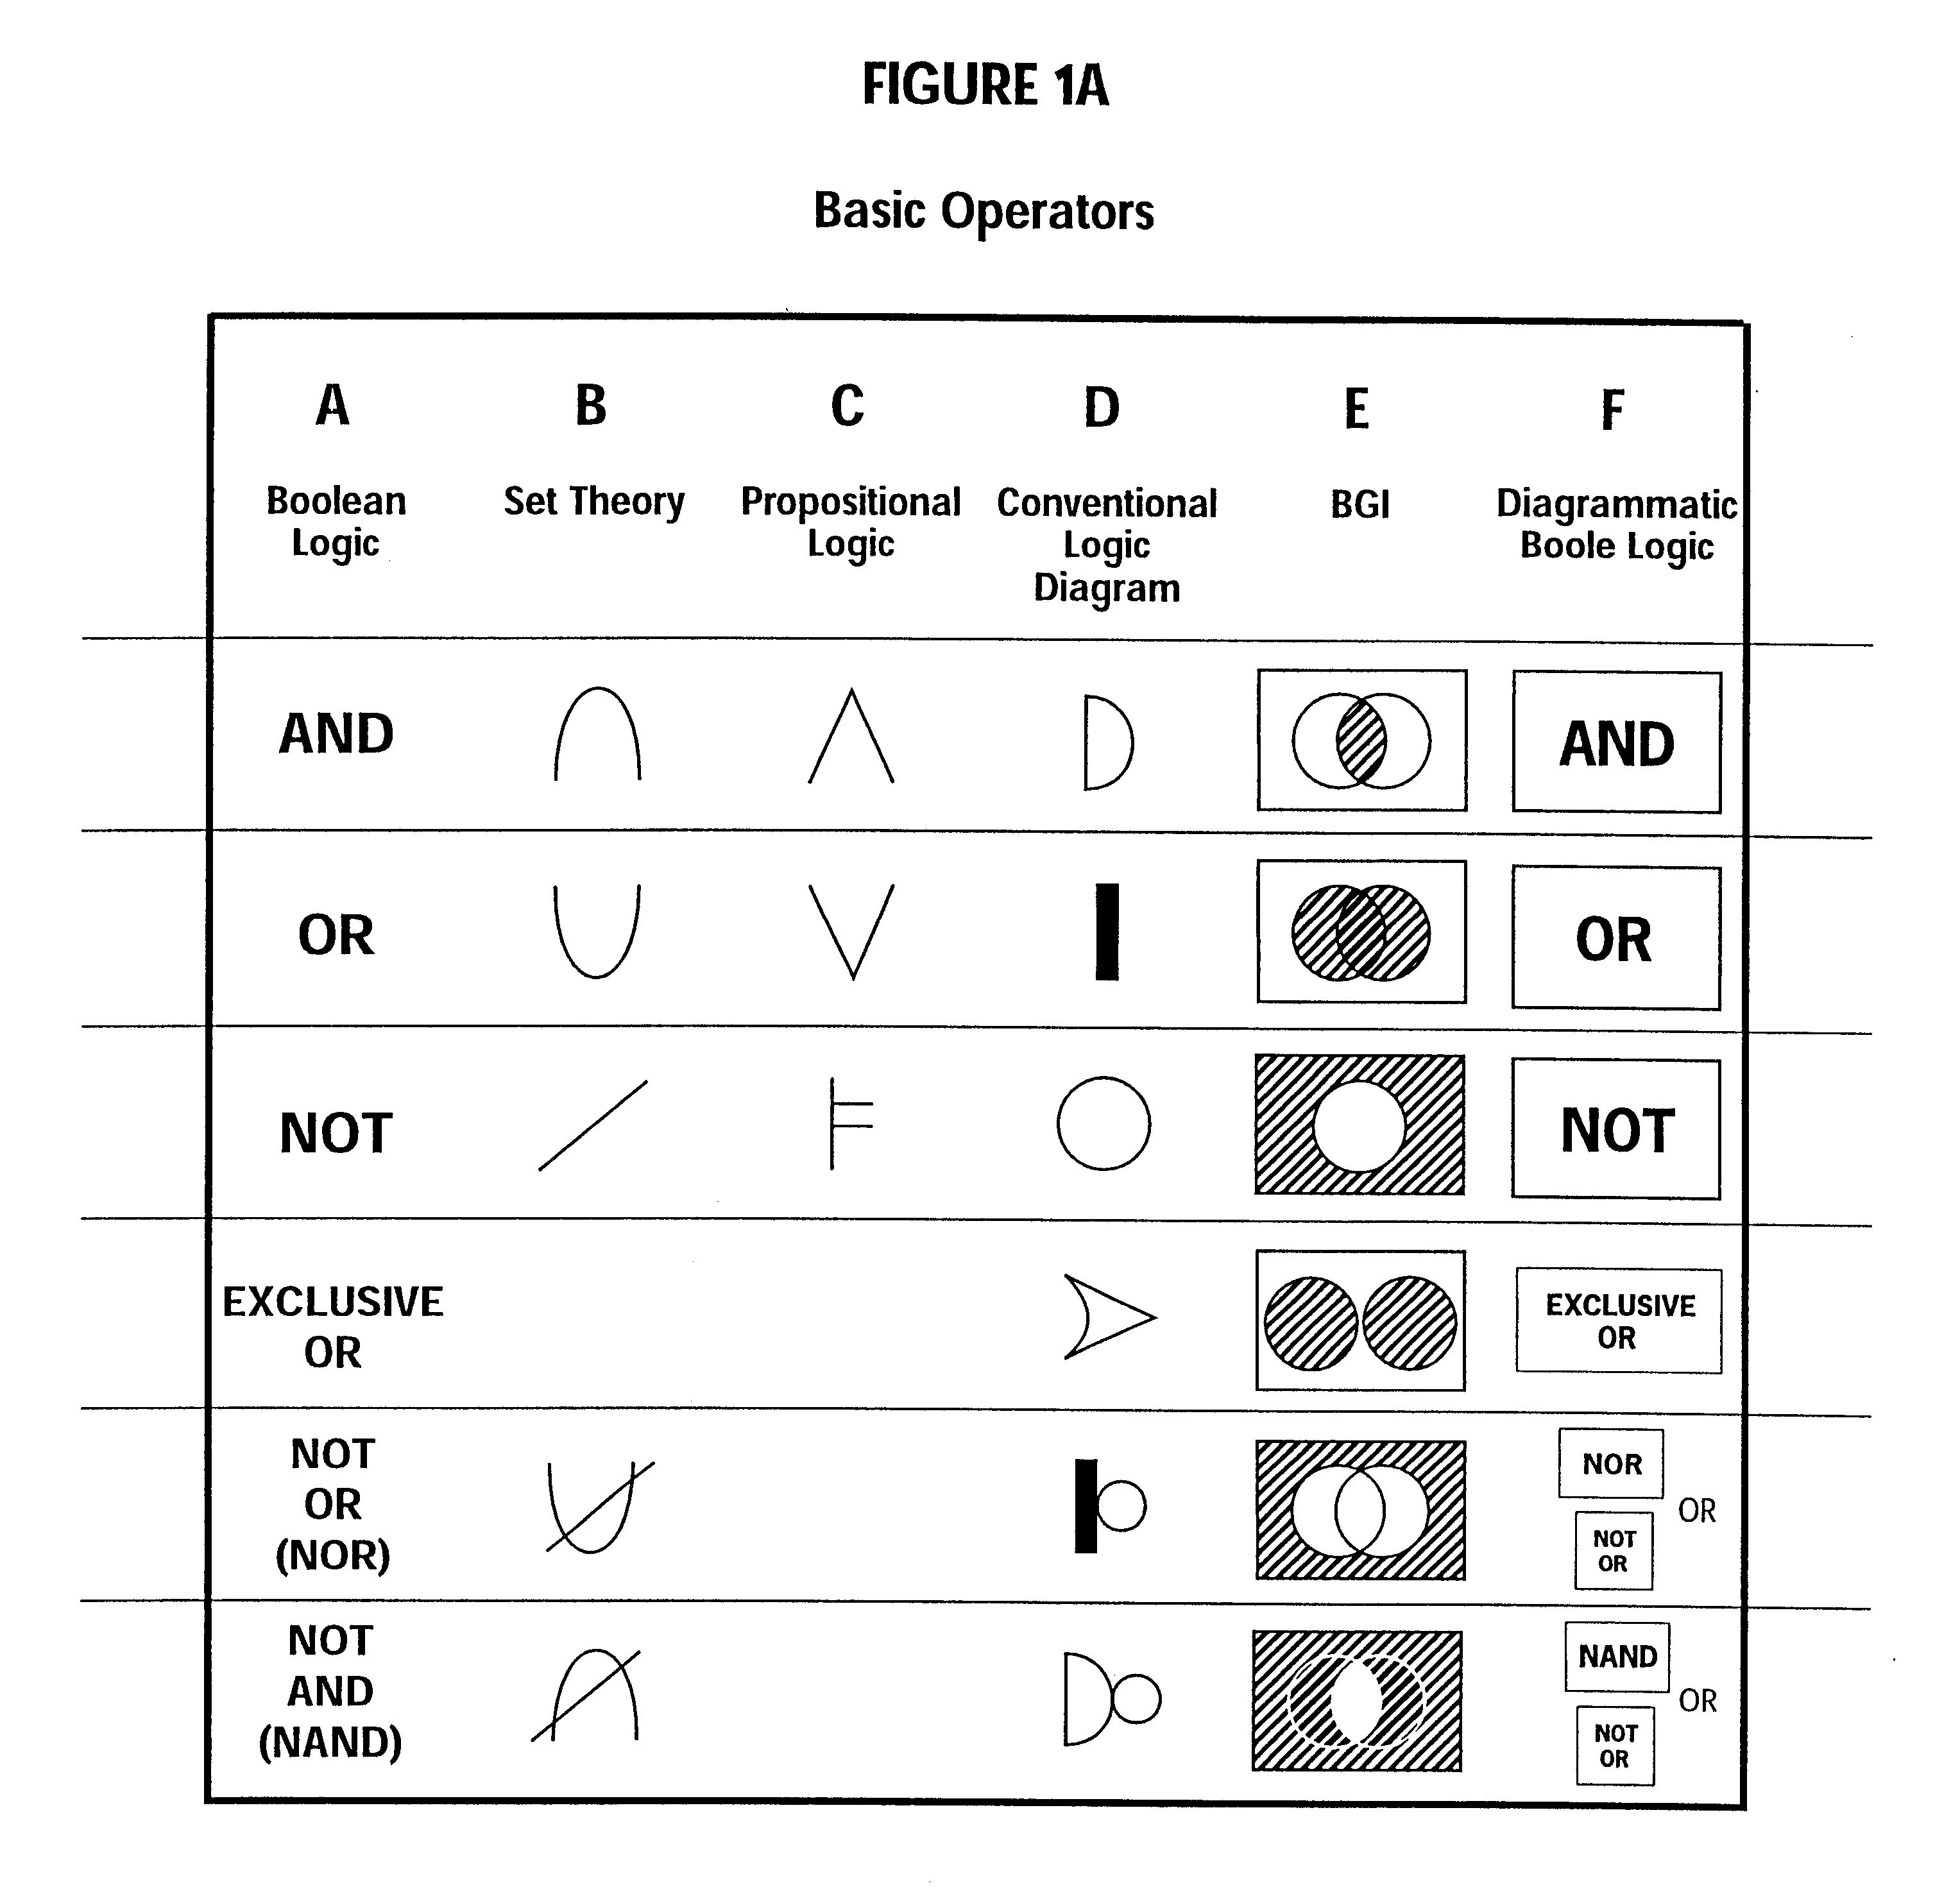
However, it is not well known in the art of front ends for search engines or browsers to use well-articulated graphical representations of set theory, including graphical representations of the logical operations "AND", "OR" and "NOT," and any symbols that are used tend to be static and non-manipulable.
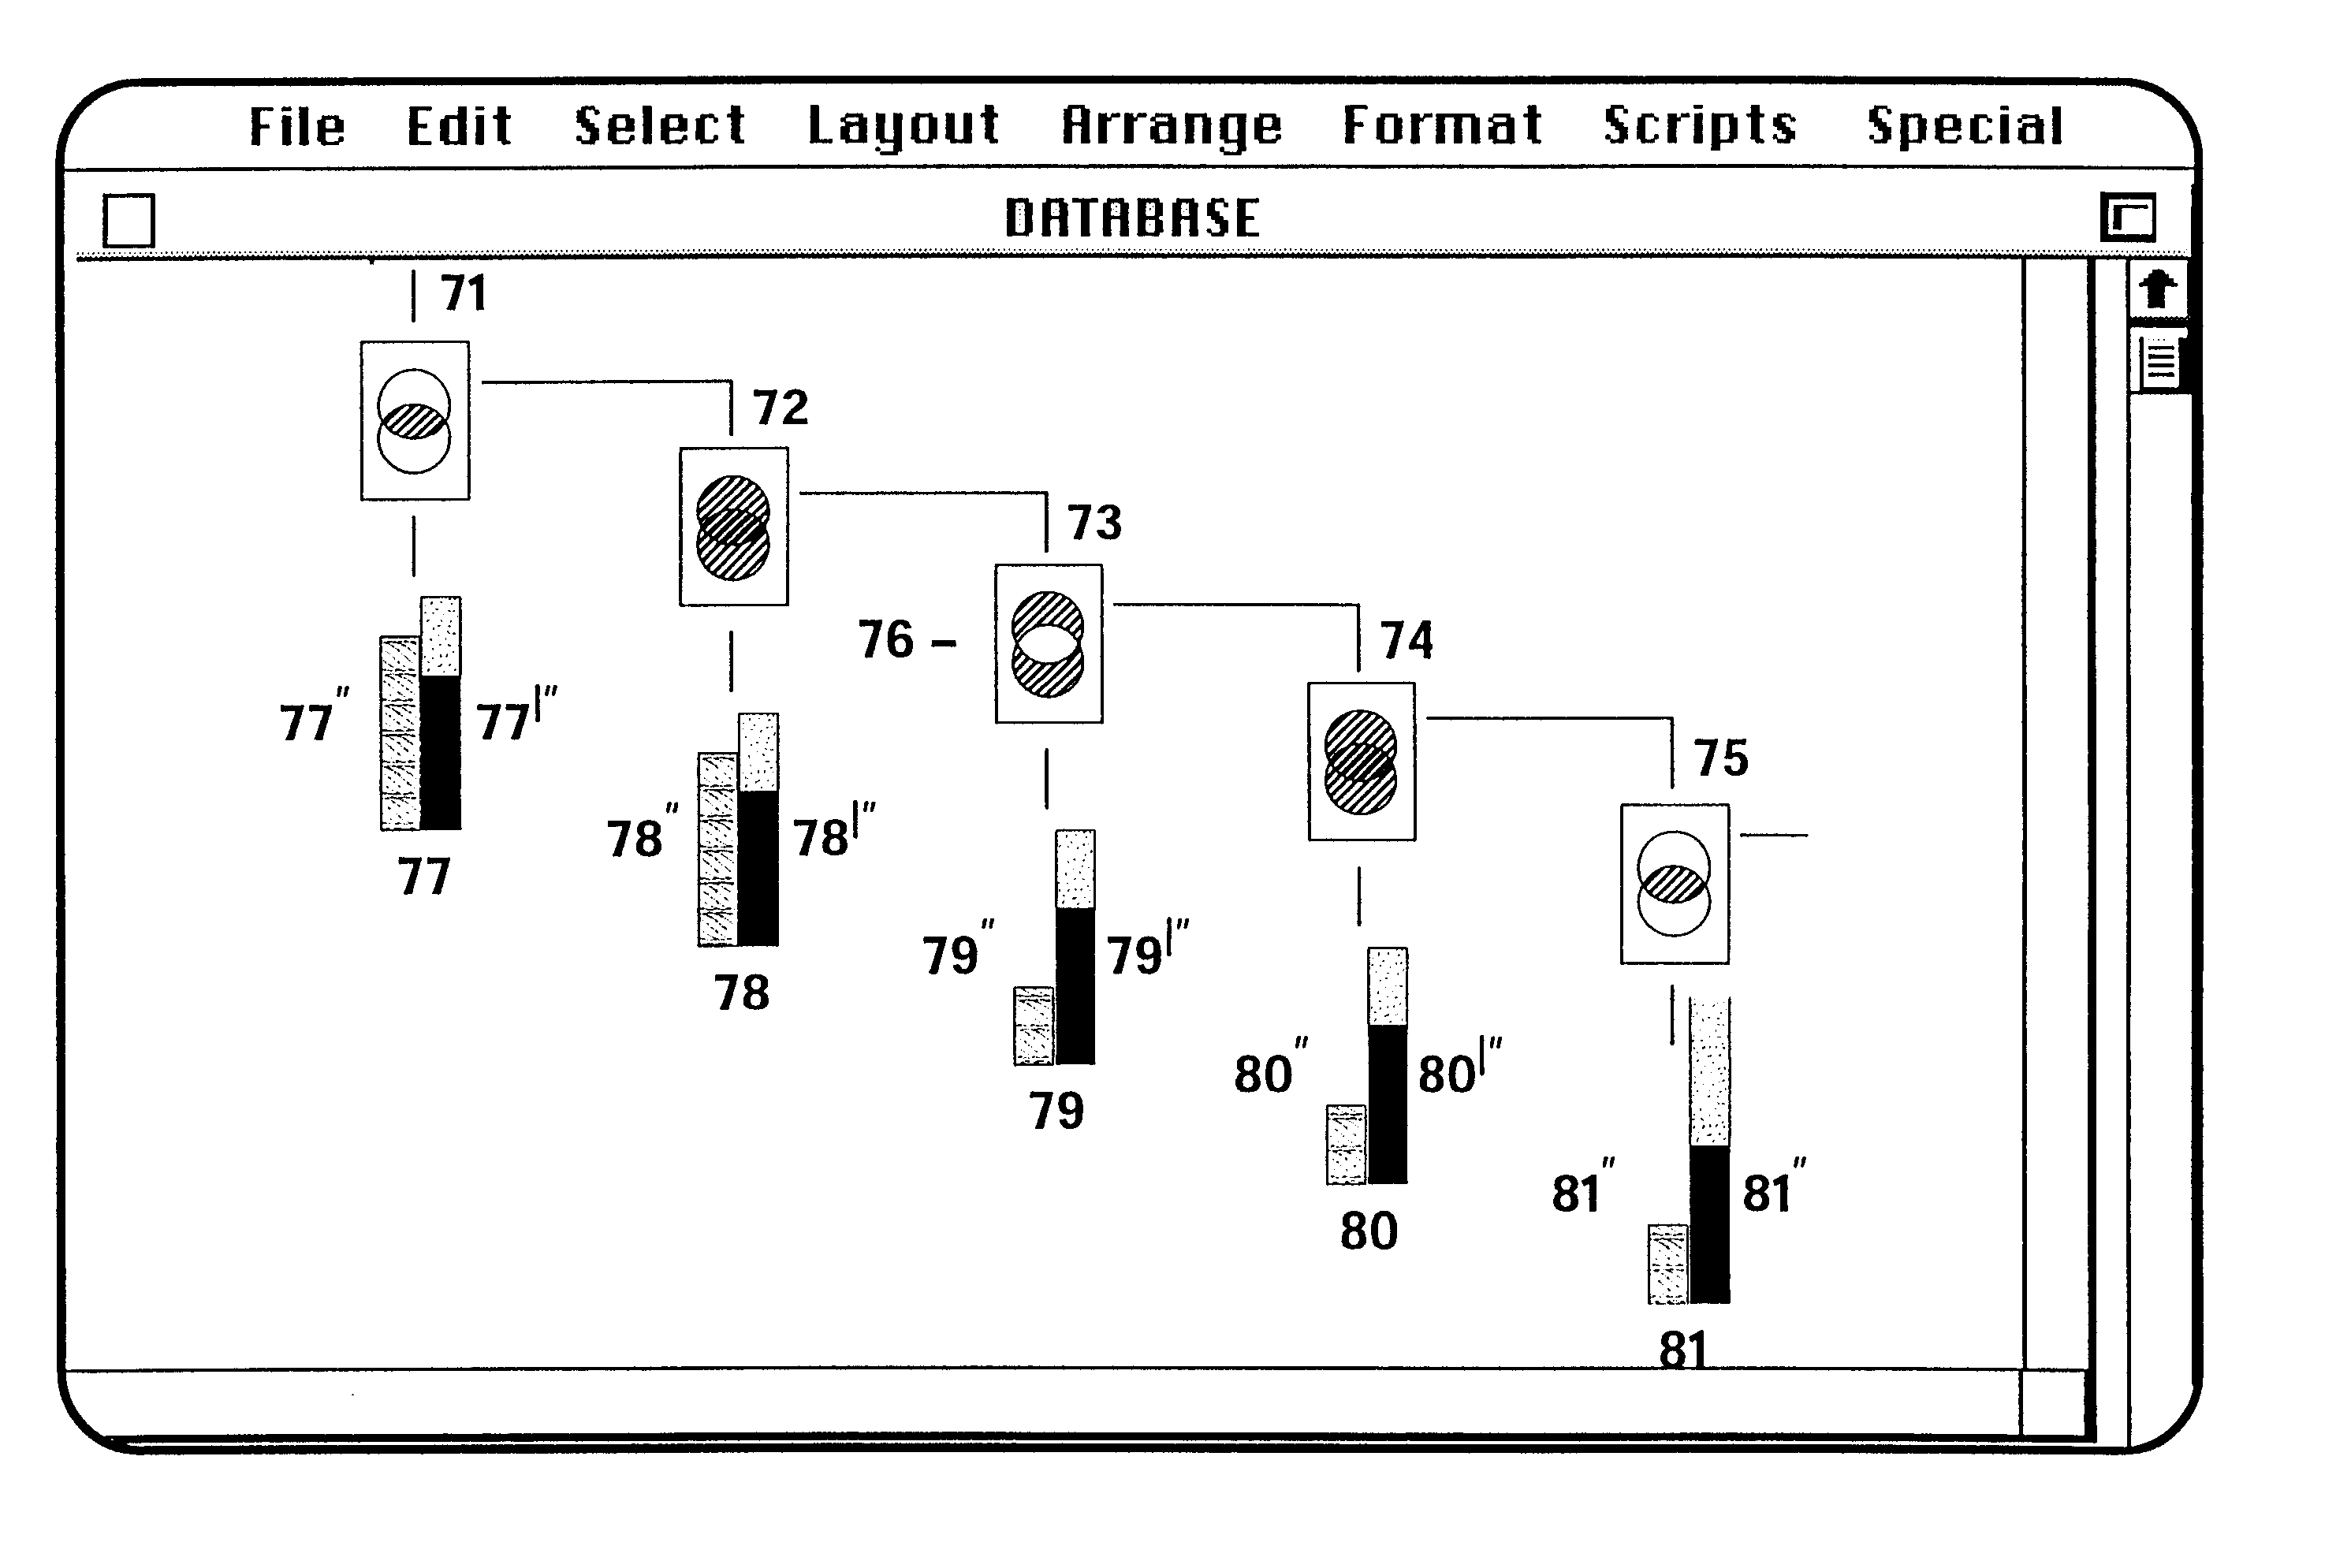
Thus, this system allows the user to visualize the element of the search in a graphical representation, but does not graphically represent the chaining of search criteria.
This system does not provide for interactive modification of the search based on the graphic representation.
Thus, while AND, OR and NOT are readily understood, a complex expression employing such words may become incomprehensible.
(1) proliferation of results, which are extremely time consuming or impossible to consider in their totality; and alternatively a paucity of results;
(2) aggregation of data results, in many cases, in one undifferentiated pile;
(3) loss of the logical history of a search, and the corresponding hot links, requiring reentering and researching of requests in some cases;
(4) lack of an intuitively appealing graphic representation either of a projected search or the results thereof,
(5) lack of an intuitively appealing graphic interface for interaction with an "
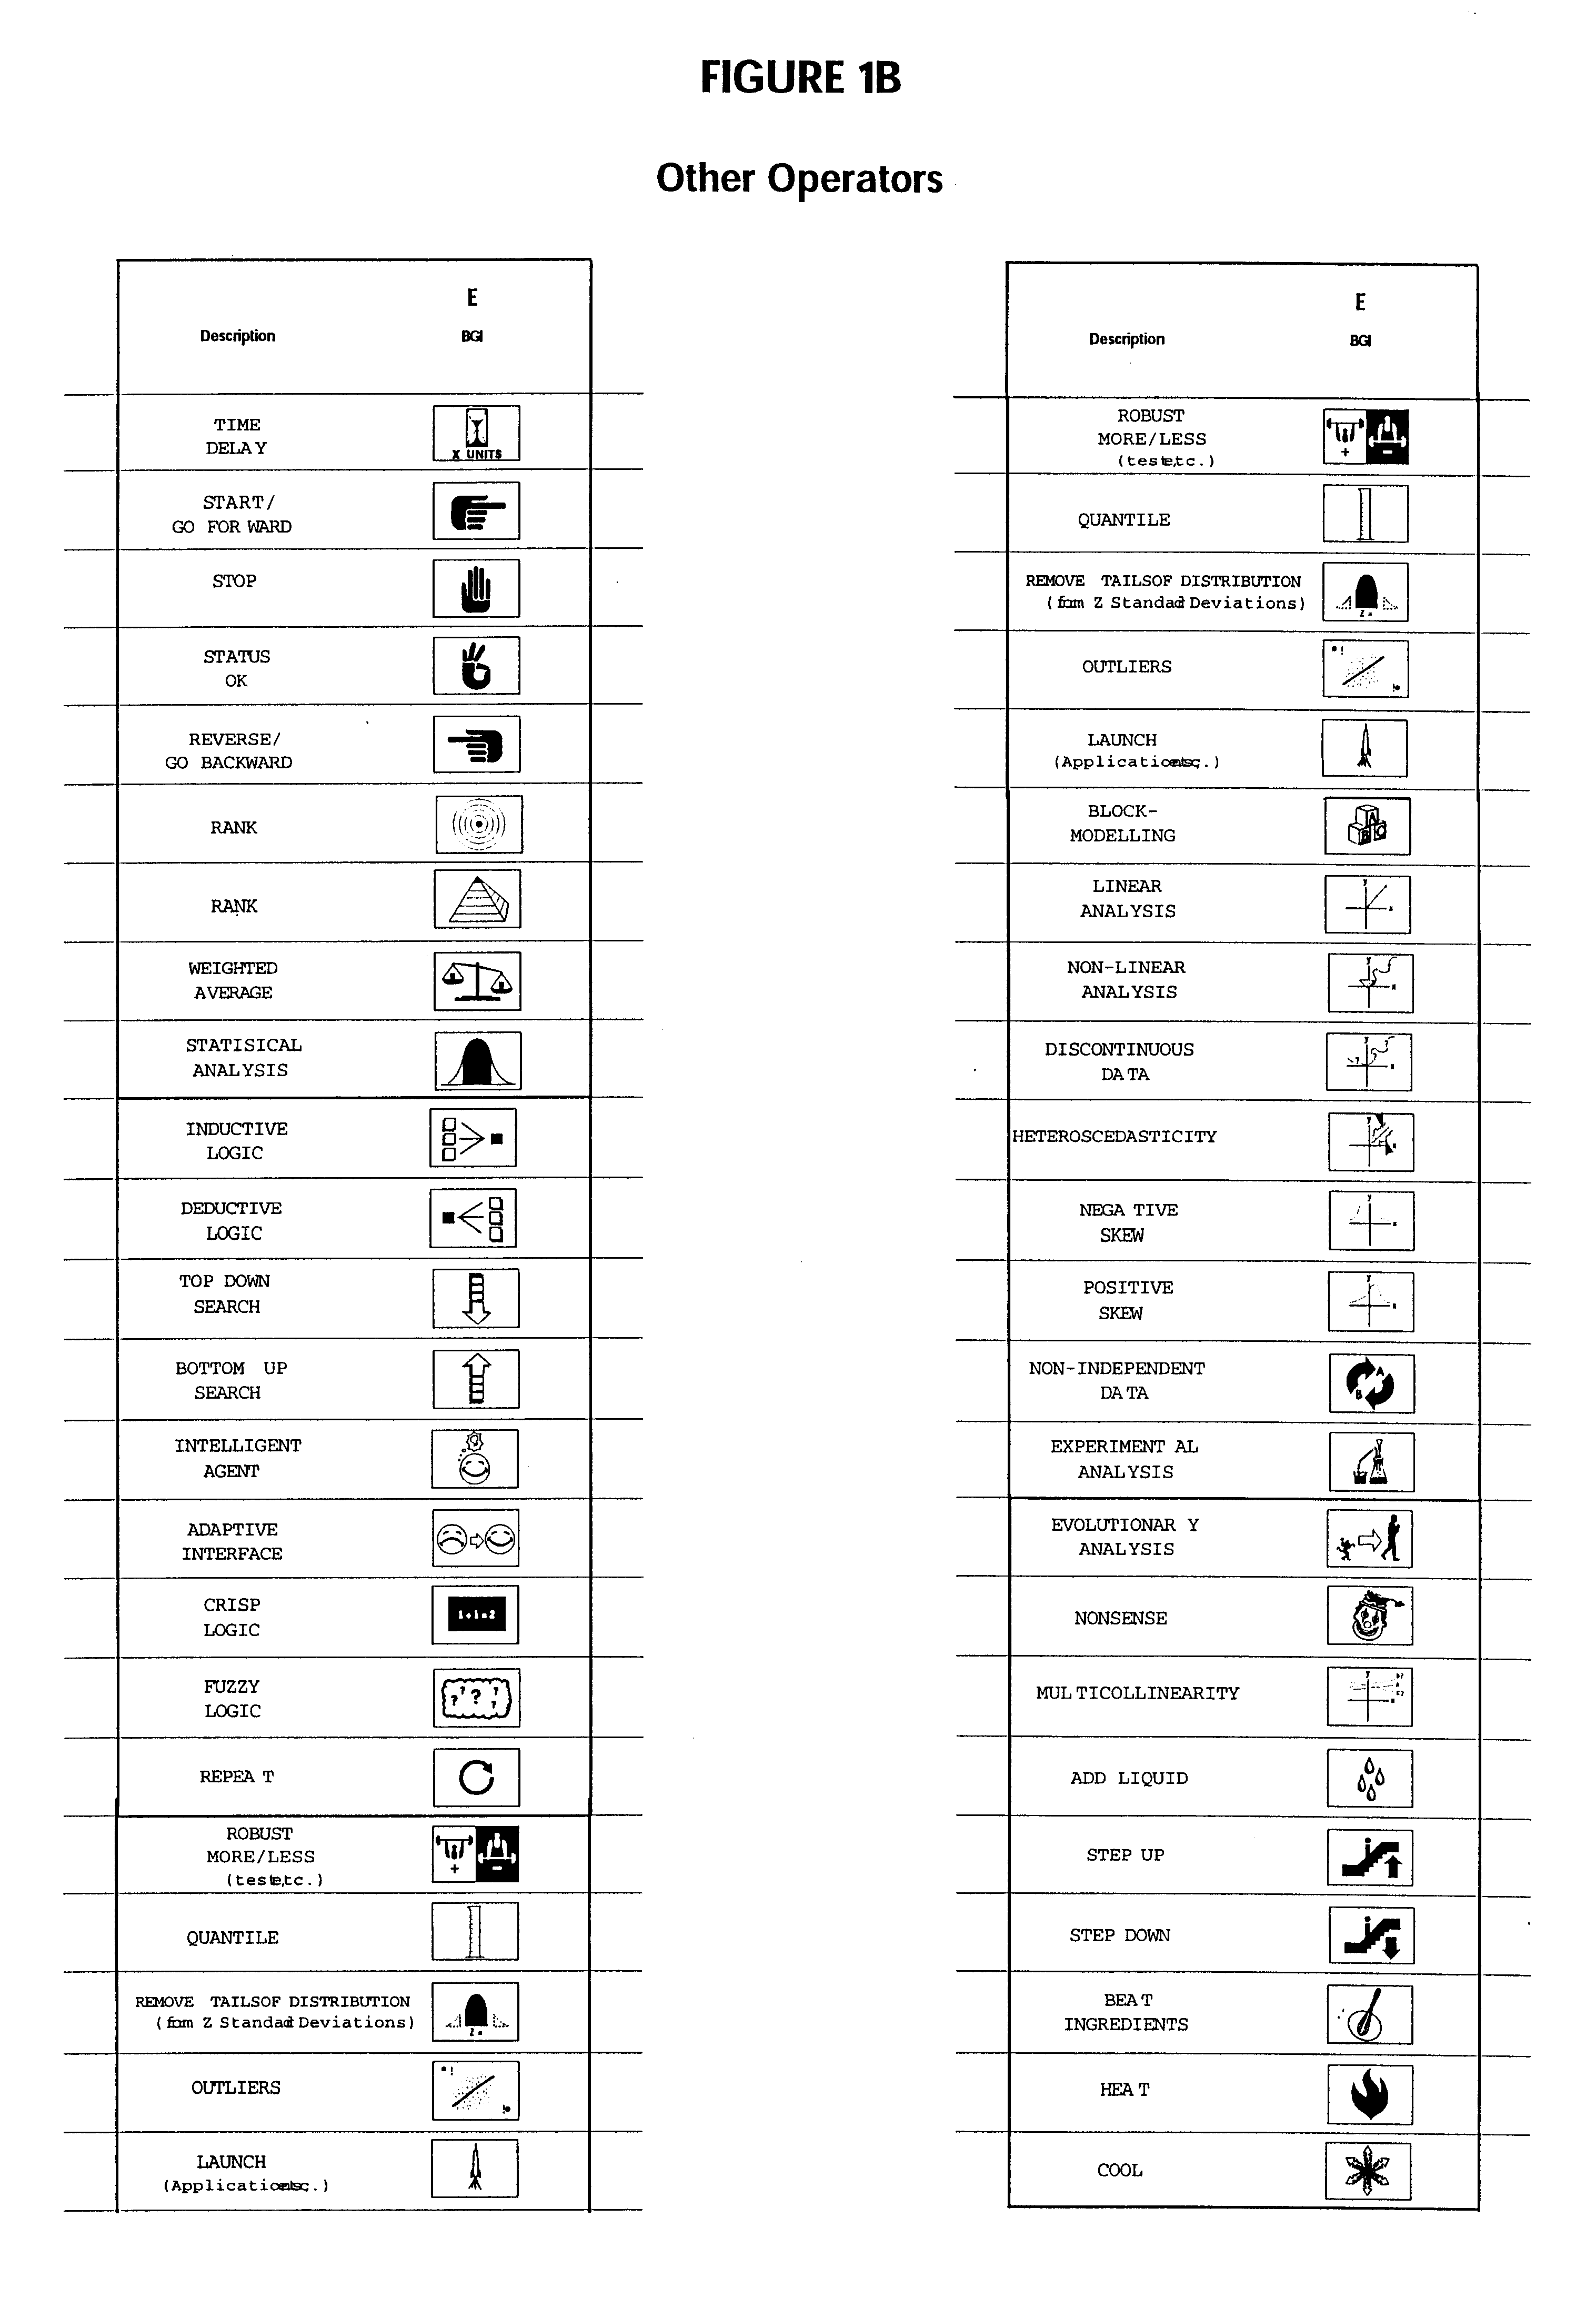
intelligent agent";
(6) lack of a suitable graphic interface for manipulation of index and table of contents data;
(7) lack of a suitable graphic interface to handle a search of two or more databases simultaneously;
(8) lack of a suitable graphic interface for handling complex data searches involving fuzzy logic; and
(9) lack of an intuitively appealing interface to represent the results of a database search.
(10) Lack of a graphic interface for search processes that is universally understandable, regardless of one's natural language.
Typically, a user will seek to use the database system to help define an optimal resulting data subset, wherein the rule or rules defining that data set are unknown at the outset or are inefficiently defined as a single consolidated set of rules.
The standard Boolean set operators fail to provide certain useful functions, such as ranges, chronology, ranking, proximity and semantic features.
In other cases, traditional Boolean logical expressions cannot readily represent the search concept, such as a proximity of two terms.
In some instances, a portion of the database may be readily accessible, and a portion difficult to access, and these search requests may be scheduled and / or dispatched accordingly.
Of course, there are instances where this information will be unavailable to the interface prior to execution of a search, in which case the interface will perform its normal functions, even with these trivializations.
Using unitary Venn diagrams, more complex logic is less easily represented, i.e., while such representations are possible, they may require display systems with greater than two dimensions for greater than three sets.
On the other hand, the surrogate criteria, estimations, cutoffs and simplifying assumptions often lead to errors, i.e., loss of significant set members or inclusion or erroneous set members, or both.
Sometimes, multiple underinclusive set definitions are used to define the concept, either because the search tools do not allow a single criterion of sufficient breadth, or because such a single criterion would result in the inclusion of a high proportion of undesired set elements without a corresponding increase in desired set elements.
While a user might also directly indicate the desired metric, often, the data does not have a linear distribution or other simple distribution.
In some instances, this is impossible, for example where the represented set inclusion criteria do not include any continuous or stepwise continuous formulation.
Thus, while such systems have certain limitations, they provide additional tools and opportunities for ranking of references.
In this case, institution information may be less reliable however, domain name may be useful information.

Method used


Image

  • Graphic user interface for database system
  • Graphic user interface for database system
  • Graphic user interface for database system

Examples


example 2

Instead of entering set definitions, as provided in the method according to Example 1, a user defines a search using prior known techniques, such as natural language searching, query by example, or other known techniques. Using these techniques, a search expression is constructed, using e.g., Boolean and other data relationships, which is normally not employed by the user. However, according to the present invention, this derived search strategy is presented as a series of icons interconnected in accordance with the present invention, such as is shown in FIG. 7. Thus, the user need not explicitly define the search parameters, but rather, an automated or intelligent system may be employed to generate the initial search.

After the search is formulated using the known prior art techniques, the user is presented with the results. While these results may sometimes be acceptable, often the user desires a search of differing scope than that presented. Therefore, the interconnected icons may...


PUM


Abstract

A graphic user interface method for representing a search of a database, providing a plurality of stylized Venn diagrams each representing an intersection of at least two sets; receiving from the user, for each generic graphic icon, a selection of at least one region, defining an output data set; presenting the generic graphic icons on the graphic user interface as modified graphic icons, each having graphic indication of the selections; and receiving linkage information from the user for the modified graphic icons to represent a composite set inclusion property, based on the output data sets and the linkage information. Once a search is defined, it may be translated, as necessary, for execution by a typical database search engine. Retrieved results may be quantified and ranked by the interface system for optimal presentation to the user.

Description

The present invention relates to the field of graphic user interfaces for computer systems, and more particularly to graphic user interface systems having graphic objects representing data sets, in which a manipulation of the graphic object instructs the system to perform logical or set theory operations on the data represented by the graphic object.Traditionally, graphic user interfaces (hereinafter "GUIs") have been employed to facilitate interaction of a user with the file and execution system of a computer system, to present information graphically and / or in a manner approximating a printed page ("what you see is what you get" or "WYSIWYG"), or to present a desktop metaphor. Of course, there are other aspects of modern GUIs not encompassed by this generalization, but which are known to those skilled in the art.Typical graphic objects in a GUI are icons presented on a background or "desktop", with icons each representing a set of files, application programs, system resources, or ...

Claims


Application Information

Patent Timeline
IPC IPC(8): G06F9/44G06F17/30
CPCG06F9/4443G06F17/30398G06F17/3053G06F17/30554G06F17/30696Y10S715/968G06F9/451G06F16/2428G06F16/24578G06F16/248G06F16/338
Inventor SZABO, ANDREW J.
Owner ZARBANA DIGITAL FUND
Why Eureka
Try Eureka